Detection of Financial Statement Fraud using
Data Mining Technique and
Performance Analysis
KK Tangod1, GH Kulkarni2Assistant Professor, Dept of Information Science and Engg, Gogte Institute of Technology, Belagavi, Karnataka, India 1 Professor& Head, Department of Electrical and Electronics, Jain Engineering College, Belagavi, Karnataka, India2
Abstract:Financial statement fraud is a deliberate misstatement of material facts by the management in the books of accounts of a company with the aim of deceiving investors and creditors. This illegitimate task performed by management has a severe impact on the economy throughout the world because it significantly dampens the confidence of investors. Financial statements are a company's basic documents to reflect its financial status. A careful reading of the financial statements can indicate whether the company is running smoothly or is in crisis. If the company is in crisis, financial statements can indicate if the most critical thing faced by the company is cash or profit or something else. Financial statements are records of financial flows of a business. Generally, they include balance sheets, income statements, cash flow statements, statements of retained earnings, and some other statements. In a nutshell, the financial statements are the ‗mirrors of a company‘s financial status. This paper presents implementation of two data mining techniques namely K-Means Clustering Algorithm and Multi-Level Feed Forward Network (MLFF). Performance of both the techniques is analysed and results are presented comprehensively.
Keywords: K-Means clustering, Multi-Level Feed Forward Network, Probabilistic Neural Network, Data pre-processing.
I. INTRODUCTION
Every day, news of financial statement fraud is adversely affecting the economy worldwide. Considering the influence of the loss incurred due to fraud, effective measures and methods should be employed for prevention and detection of financial statement fraud. Data mining methods could possibly assist auditors in prevention and detection of fraud because data mining can use past cases of fraud to build models to identify and detect the risk of fraud and can design new techniques for preventing fraudulent financial reporting. Cost of financial statement fraud is very high both in terms of finance as well as the goodwill of the organization and related country. In order to curb the chances of fraud and to detect the fraudulent financial reporting, number of researchers had used various techniques from the field of statics, artificial intelligence and data mining.
A. Evolution of financial statement
Financial statement fraud in particular has cast rapidly increasing adverse impact not only on individual investors but the overall stability of global economies. Although there are minor variations in its definition, a financial statement fraud is defined by the Association of Certified Fraud Examiners as ―The intentional, deliberate, misstatement or omission of material facts, or accounting data which is misleading and, when considered with all the information made available, would cause the reader to change or alter his or her judgment or decision. Another motivation for management fraud is the need for continuing growth. Companies unable to achieve similar results to past performances may engage in fraudulent
activities to maintain previous trends. Companies who are growing rapidly may exceed the monitoring process ability to provide proper supervision. As a growth measure here the Sales Growth (SALGRTH) ratio is used, a number of accounts, which permit a subjective estimation, are more difficult to audit and thus are prone to fraudulent falsification. Accounts Receivable, inventory and sales fall into this category.
In practice, financial statement fraud might involve:- 1) Manipulation of financial records.
2) Intentional omission of events, transactions, accounts, or other significant information from which financial statements are prepared, or
3) Misapplication of accounting principles, policies, and procedures used to measure, recognize, report, and disclose business transactions.
This software is a tool for the auditor in detection of fraudulent financial statements. Traditionally, auditors are responsible for detecting financial statement fraud. With the appearance of an increasing number of companies that resort to these unfair practices, auditors have become overburdened with the task of detection of fraud. Various techniques of data mining are being used to lessen the workload of the auditors.
Despite the increased of time and effort that has been spent to detect the same, the number of detected frauds and the detection rate have largely decreased. When the executives who are involved in financial fraud are well aware of the fraud detection techniques and software, which are usually public information and are easy to
obtain, they are likely to adapt the methods in which they commit fraud and make it difficult to detect the same, especially by existing techniques. There exists an urgent need for new methods that is not only efficient but effective to catch up with these probable newly emerged or adaptive financial shenanigans. This paper provides an overview of existing financial shenanigans and their trend, and new framework to detect evolutionary financial statement fraud is suggested.
Paper is organised in sections as follows, firstly related work carried out by the researchers is discusses followed by design and implementation details then performance analysis of the system is discussed in detail the finally conclusion.
II. RELATEDWORK
Data mining has been applied in many aspects of financial analysis. Few areas where data mining techniques have already being used include: bankruptcy prediction, credit card approval, loan decision, money-laundering detection, stock analysis, etc. However, research related to the use of data mining for detection of financial statement fraud is limited. The main objective of this research is to predict the occurrence of financial statement fraud in companies as accurately as possible using intelligent techniques. There has been a limited use of data mining techniques for detection of financial statement fraud.
Neural Network based support systems was proposed by Koskivaara in 2004. He demonstrated that the main application areas of NN were detection of material errors, and management fraud. He also investigated the impact of various preprocessing models on the forecast capability of NN when auditing financial accounts [2].
Kirkos used three Data Mining classification methods namely Decision Trees, Neural Networks and Bayesian Belief Networks [8].
Sohl and Venkatachalam used back-propagation NN for the prediction of financial statement fraud [5].
Zhou & Kapoor in 2011 applied four data mining techniques namely regression, decision trees, neural network and Bayesian networks in order to examine the effectiveness and limitations of these techniques in detection of financial statement fraud. They explore a self adaptive framework based on a response surface model with domain knowledge to detect financial statement fraud [9].
Ravisankar applied six data mining techniques namely Multilayer Feed Forward Neural Network (MLFF), Support Vector Machines (SVM), Genetic Programming (GP), Group Method of Data Handling (GMDH), Logistic Regression (LR), and Probabilistic Neural Network (PNN) to identify companies that resort to financial statement fraud on a data set obtained from 202 Chinese companies. They found Probabilistic neural network as the best techniques without feature selection. Multilayer Feed Forward Neural Network and PNN outperformed others with feature selection and with marginally equal accuracies [1].
The review of the existing literature reveals that the research conducted till date is solely in the field of detection and identification of financial statement fraud and a very little or no work has been done in the field of prevention of fraudulent financial reporting.
III.DESIGNANDIMPLEMENTATION
A. System Design
Data Mining (DM) is an iterative process within which progress is defined by discovery, either through automatic or manual methods. DM is most useful in an exploratory analysis scenario in which there are no predetermined notions about what will constitute an ‗‗interesting‘‘ outcome. The application of Data Mining techniques for financial classification is a fertile research area. Many law enforcement and special investigative units, whose mission it is to identify fraudulent activities, have also used Data Mining successfully. However, as opposed to other well-examined fields like bankruptcy prediction or financial distress, research on the application of DM techniques for the purpose of management fraud detection has been rather minimal.
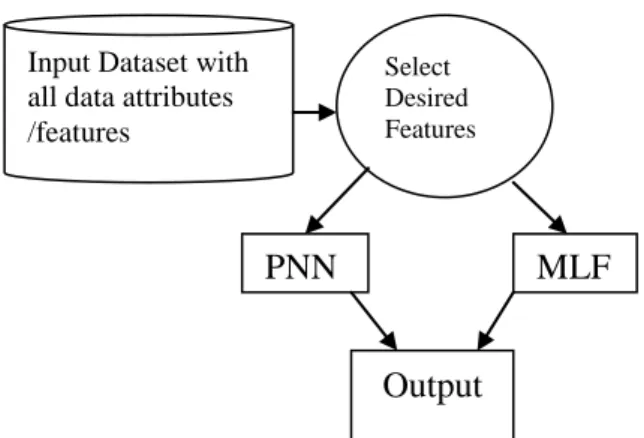
Figure 1 : System Architecture
At first, dataset comprising of financial statements of companies is obtained. This dataset is analysed and prominent features are selected which will be used by data mining algorithms to detect inconsistencies. Algorithms such as PNN and MLFF are implemented on the dataset using the selected features which provide results with varying accuracies. PNN and MLFF are examples of Neural Networks which provide accuracy and flexibility in analysing large amounts of data at a time. These implementations of parallel computing are found to be much more reliable and consistent in comparison with serial computing. An Analysis of Statistical and Machine Learning Algorithms, evaluates the utility of different classification algorithms and fraud predictors for predicting financial statement fraud. The results also show that out of some variables that have been found to be good predictors in prior fraud research, only few variables are selected by three or more classifiers: auditor turnover, total discretionary accruals, Big 4 auditor, accounts receivable,
Input Dataset with all data attributes /features Select Desired Features
MLF
F
PNN
Output
meeting or beating analyst forecasts, and unexpected employee productivity.
Identifying fraudulent financial statements can be regarded as a typical classification problem. Classification is a two-step procedure. In the first two-step, a model is trained by using a training sample. The sample is organized in tulles (rows) and attributes (columns). One of the attributes contains values indicating the predefined class to which each tuple belongs. This step is also known as supervised learning. In the second step, the model attempts to classify objects which do not belong to the training sample and form the validation sample.
B. System Implementation
This system uses manually pre-processed data in the form of financial ratios which is fed to the supervised and unsupervised neural network algorithms implemented in python language for detecting fraudulent financial statements. The output of the algorithms i.e., Multi-Level Feed Forward Network and K-Means Algorithm is classification of input data into companies which are fraud and non fraud. It explains the software perspective, functions and constraints.
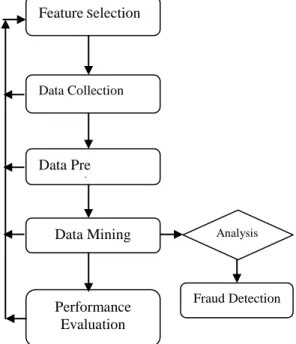
Figure 2: Work Flow Model
Cost of financial statement fraud is very high both in terms of finance as well as the goodwill of the organization and related country. In order to curb the chances of fraud and to detect the fraudulent financial reporting, number of researchers had used various techniques from the field of statics, artificial intelligence and data mining. It explains the functional and non-functional requirements of the software along with its architecture and system model. The variables considered as meaningful in the study provide useful information about the financial situations of the financial Institutions. The attained findings will be useful for the company management, auditors, tax authorities,
financial analysts and other related parties. The auditors will be able to collect more effective proofs with the help of these findings and perform an auditing plan. Besides, the auditors will be able to analyse the companies‘ financial statements by adding these results to the software they use and they will also be able to determine the risk factors denoted as red flags. In addition, a company‘s management and financial analysts, using the identified financial statements‘ indicators, assess a company‘s financial statements are whether include falsified risk factors. These results indicate that auditors need to devote extra. The three data mining methods used for detection of financial statement fraud are compared on the basis of two important evaluation criteria namely sensitivity and specificity. These techniques will detect the fraud in case of failure of prevention mechanism. Hence, the framework used in this research is able to prevent fraudulent financial reporting and detect it if management of the organization is capable of perpetrating financial statement fraud despite the presence of anti fraud environment.
System‘s Work flow is shown in Figure 2. First step of the framework is feature selection. Selected financial ratios/variables are features to be used as input vector in further analysis. These features represent behavioural characteristics along with measures of liquidity, safety, profitability and efficiency of the organisations under consideration. During the second step of Data Collection, all the financial ratios have been collected from financial statements namely balance sheet, income statement and cash flow statement for companies. In order to make dataset ready for mining, data need to be pre - processed. Data has been transformed in to an appropriate format for mining during the step of Data pre-processing. Dataset is cleaned further by replacing missing values with the mean of the variable. Each of the independent financial variables has been normalized by using range transformation (min = 0.0, max = 1.0). The step of data pre-processing is followed by selection of an appropriate data mining technique. The framework suggests the use of descriptive data mining technique for prevention and predictive methods for detection of financial statement fraud. Processed data is fed to the algorithms and output is obtained. Output of both the techniques is analysed and compared. Performance evaluation, the final step of the framework is used for measuring the performance and judging the efficacy of data mining methods. Sensitivity and specificity have been used as a metrics for performance evaluation of classification techniques in this work.
C. Multi-Layer Feed forward Network
MLFF neural networks, trained with a back-propagation learning algorithm, are the most popular neural networks. They are applied to a wide variety of chemistry related problems. A MLFF neural network consists of neurons that are ordered into layers. The first layer is called the input layer, the last layer is called the output layer, and the layers between are hidden layers.
Feature Selection Data Pre processing Data Collection Data Mining Performance Evaluation Fraud Detection Analysis
For the formal description of the neurons mapping function r is used, which assigns for each neuron i a subset T (i) subset of V which consists of all ancestors of the given neuron. A subset T (i) subset of V than consists of all predecessors of the given neuron i. Each neuron in a particular layer is connected with all neurons in the next layer. The connection between the ith and jth neuron is characterized by the weight coefficient wij and the ith
neuron by the threshold coefficient Ʋi. The weight
coefficient reflects the degree of importance of the given connection in the neural network. The output value (activity) of the ithneuron xi is determined by the following
equations.
The supervised adaptation process varies the threshold
coefficients fii and weight coefficients wij to minimize the sum of the squared differences between the computed and required output values.
Figure 3: Multi Level Feed Forward Network Training The MLFF neural network operates in two modes: training and prediction mode. For the training of the MLFF neural network and for the prediction using the MLFF neural network we need two data sets, the training set and the set that we want to predict. The training mode begins with arbitrary values of the weights they might be random numbers and proceeds iteratively. Each iteration of the complete training set is called an epoch. In each epoch the network adjusts the weights in the direction that reduces the error. As the iterative process of incremental adjustment continues, the weights gradually converge to the locally optimal set of values. Many epochs are usually required before training is completed. For a given training set, back-propagation learning may proceed in one of two basic ways: pattern mode and batch mode. In the pattern mode of back propagation learning, weight updating is performed after the presentation of each training pattern. In the batch mode of back-propagation learning, weight up dating is performed after the presentation of all the training examples. From an ‗on-line‘ point of view, the
pattern mode is preferred over the batch mode, because it requires less local storage for each synaptic connection. More-over, given that the patterns are presented to the network in a random manner, the use of pattern-by-pattern updating of weights makes the search in weight space stochastic, which makes it less likely for the back-propagation algorithm to be trapped in a local minimum. On the other hand, the use of batch mode of training provides a more accurate estimate of the gradient vector. Pattern mode is necessary to use for example in on-line process control, because there are not all of training patterns available in the given time. In the final analysis the relative effectiveness of the two training modes depends on the solved problem.
D. K-Means Clustering Algorithm
K- Means is one of the simplest unsupervised learning algorithms that solve the well known clustering problem. The procedure follows a simple and easy way to classify a given data set through a certain number of clusters (assume k clusters) fixed a priori. The main idea is to define k centroids, one for each cluster. These centroids should be placed in a cunning way because of different location causes different result. So, the better choice is to place them as much as possible far away from each other. The next step is to take each point belonging to a given data set and associate it to the nearest centroid. When no point is pending, the first step is completed and an early groupage is done. At this point it is needed to re-calculate ‗k‘ new centroids as barycentre of the clusters resulting from the previous step. After these k new centroids are obtained, a new binding has to be done between the same data set points and the nearest new centroid. A loop has been generated. As a result of this loop it may be noticed that the k centroids change their location step by step until no more changes are done. In other words centroids do not move any more. Finally, this algorithm aims at minimizing an objective function, in this case a squared error function. The objective function is
Where is a chosen distance measure between a data point and the cluster centre , is an indicator of the distance of the n data points from their respective cluster centres.
Feature learning
k-means clustering has been used as a feature learning (or dictionary learning) step, which can be used in the for (semi-)supervised learning or unsupervised learning. The basic approach is first to train a k-means clustering representation, using the input training data
(which need not be labelled). Then, to project any input datum into the new feature space, we have a choice of "encoding" functions, but we can use for example the threshold matrix-product of the datum with the centroid locations, the distance from the datum to each centroid, or simply an indicator function for the nearest centroid, or some smooth transformation of the distance. Alternatively, by transforming the sample-cluster distance through a Gaussian RBF, one effectively obtains the hidden layer of a radial basis function network.
This use of k-means has been successfully combined with simple, linear classifiers for semi-supervised learning in NLP (specifically for named entity recognition) and in computer vision.
E. Potential ratios used to determine financial statement fraud
• Current ratioCurrent assets/current liabilities • Acld-test ratioQuick assets/current liabilities • Receivables turnoverNet sales on account/average receivables
• Number of day‘s sales inReceivables end of Receivables year/average daily sales
• Inventory turnoverCost goods sold/average inventory • Number of days‘ sales inInventory end of year/average Inventory daily CGS liabilities
• Net fixed assets/long term
• Debt to equity Total debt/stockholders‘ equity • Rate earned on total assetsIncome + interest Expense/average total assets
• Rate earned on stockholdersIncome/total stockholders‘ Equity
• Return on assetsIncome/average total assets • Credit ratingprovided by a credit rating Agency • Bond rating1 = low, 10 = high
• Sales ratioSales/assets • Earnings/assets
• Equity/debt
• Cash flow/total debt • Cash flow/long-term debt • After-tax profit/total assets • Total liabilities/total assets • Net working capital/total assets • Net working capital/sales revenue • Net fixed assets/long term
• Earnings before interest and taxes (EBIT)/assets • Profit margin or efficiency ratio Income/sales
IV.PERFORMANCEANALYSIS
Performance of the system is measured against two distinct data sets of company data which consists of number of companies and their potential ratios in the form of numerical values which are fed as an input to the algorithm and graphs are plotted for various parameters such as sensitivity, accuracy and specificity against number of iterations and same three parameters are also plotted for learning rate.
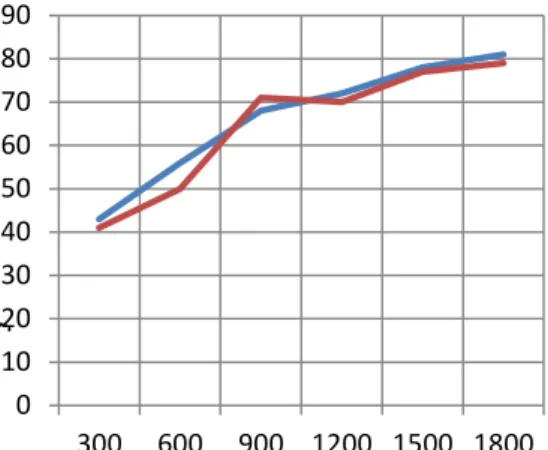
1. Sensitivity Vs no. of iterations
Figure 4: Sensitivity Analysis 2. Accuracy Vs no. of iterations
Figure 5: Accuracy Analysis 3. Specificity Vs No Of Iterations
Figure 6: Specificity Analysis
0 10 20 30 40 50 60 70 80 90 300 600 900 1200 1500 1800
Data Set 1 Data Set 2
No. of Iterations Sen sitiv it y 0 10 20 30 40 50 60 70 80 90 300 600 900 1200 1500 1800 Data Set 1No. of Iterations Data Set 2
Acc
yrac
y
0 10 20 30 40 50 60 70 80 90 300 600 900 1200 1500 1800Data Set 1 Data Set 2
No. of Iterations
Sp
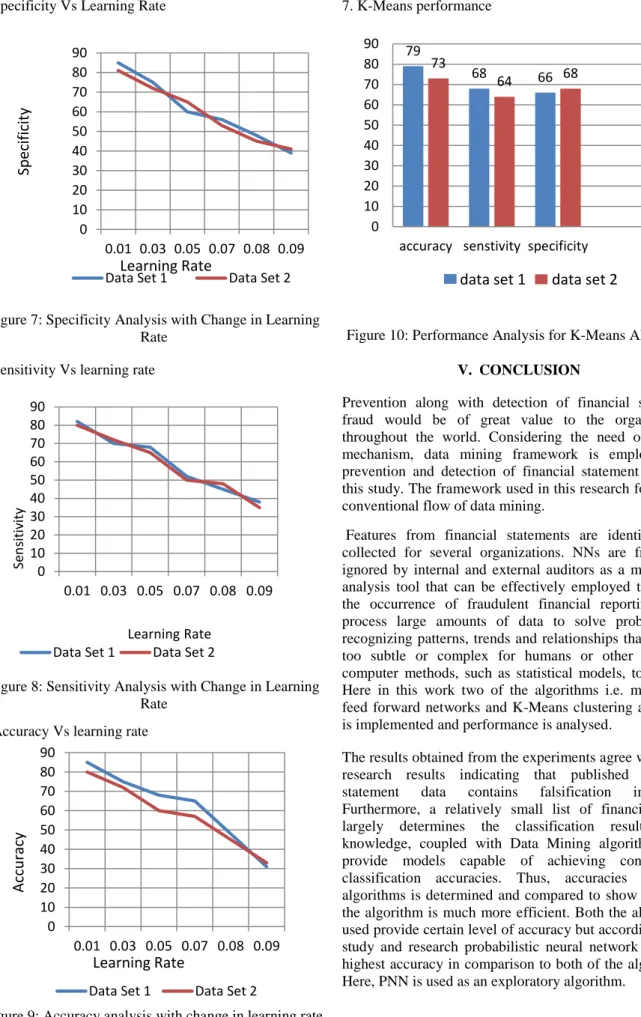
4. Specificity Vs Learning Rate
Figure 7: Specificity Analysis with Change in Learning Rate
5. Sensitivity Vs learning rate
Figure 8: Sensitivity Analysis with Change in Learning Rate
6. Accuracy Vs learning rate
Figure 9: Accuracy analysis with change in learning rate
7. K-Means performance
Figure 10: Performance Analysis for K-Means Algorithm
V. CONCLUSION
Prevention along with detection of financial statement fraud would be of great value to the organizations throughout the world. Considering the need of such a mechanism, data mining framework is employed for prevention and detection of financial statement fraud in this study. The framework used in this research follow the conventional flow of data mining.
Features from financial statements are identified and collected for several organizations. NNs are frequently ignored by internal and external auditors as a major data analysis tool that can be effectively employed to predict the occurrence of fraudulent financial reporting. NNs process large amounts of data to solve problems by recognizing patterns, trends and relationships that may be too subtle or complex for humans or other types of computer methods, such as statistical models, to discern. Here in this work two of the algorithms i.e. multi-level feed forward networks and K-Means clustering algorithm is implemented and performance is analysed.
The results obtained from the experiments agree with prior research results indicating that published financial statement data contains falsification indicators. Furthermore, a relatively small list of financial ratios largely determines the classification results. This knowledge, coupled with Data Mining algorithms, can provide models capable of achieving considerable classification accuracies. Thus, accuracies of both algorithms is determined and compared to show which of the algorithm is much more efficient. Both the algorithms used provide certain level of accuracy but according to the study and research probabilistic neural network provides highest accuracy in comparison to both of the algorithms. Here, PNN is used as an exploratory algorithm.
0 10 20 30 40 50 60 70 80 90 0.01 0.03 0.05 0.07 0.08 0.09 Data Set 1
Learning Rate
Data Set 2Sp
ecificity
0 10 20 30 40 50 60 70 80 90 0.01 0.03 0.05 0.07 0.08 0.09Data Set 1 Data Set 2
LearningRate Se n sitiv ity 0 10 20 30 40 50 60 70 80 90 0.01 0.03 0.05 0.07 0.08 0.09
Data Set 1 Data Set 2
Learning Rate
Accu
racy
79 68 66 73 64 68 0 10 20 30 40 50 60 70 80 90accuracy senstivity specificity
REFERENCES
[1] P. Ravisankar, V. Ravi, G. Raghava Rao, I. Bose, Decision Support Systems: Detection of financial statement fraud and feature selection using data mining techniques. Aug 2004,pp 309-324. [2] E. Koskivaara, Artificial neural networks in auditing: state of the art,
The ICFAI Journal of Audit Practice. International Auditing Practices Committee (IAPC) (2001). The auditor‘s responsibility to detect fraud and error in financial statements. International Statement on Auditing (ISA) 240. Nov 1998, pp 1734-1778. [3] Erol, M. 2008. The expectations from auditing against corruptions
(errors and tricks) in the enterprises. Suleyman Demirel University the Journal of Faculty of Economics and Administrative Sciences. Aug 2010, pp 409-424.
[5] J.E. Sohl, A.R. Venkatachalam, A neural network approach to forecasting model Selection , Information & Management Jan 2005,pp 297–303.
[6] Kantardzic, M. Data mining: concepts, models, methods, and algorithms‘. Wiley—IEEE Press. Feb 1993, pp 558-585.
[7] Kinney, W., & McDaniel, L. (1989). Characteristics of firms correcting previously reported quarterly earnings. Journal of Accounting and Economics, Dec 2007, pp 1145-1168.
[8] Kirkos, S., & Manolopoulos, Y. (2004). Data mining in finance and accounting: a review of current research trends. In Proceedings of the 1st international conference on enterprise systems and accounting Thessaloniki, Greece. Mar 2002, pp 669-693.
[9] Zhou, W. and Kapoor, G. (2011). Detecting evolutionary financial statement fraud. Decision Support Systems, v. 50, n. 3, p. 570-575. [10] Terzi, S., ―Prediction of Financial Distress using Financial Ratios:
An Empirical Research in the Food Sector‖, Çukurova University, the Journal of Faculty of Economics and Administrative Sciences. April 1994, pp 226-269.
[11] Yim, J. and H. Mitchell, ―A Comparison of Corporate Distress Prediction Models in Brazil: Hybrid Neural Networks, Logit Models and Discriminant Analysis‖, Journal Nova Economia. May 2006, pp 697-711.
[12] Han, J. and Kamber, M. Data Mining: Concepts and Techniques, 2000, pp 345-456.
[13] Al-Daoud, M. B., Venkateswarlu, N. B., and Roberts, S. A. Fast K-means clustering algorithms. Report 95.18, School of Computer Studies, University of Leeds, June 2004, pp 456-789.