Customer Perceptions of Online Banking Service Quality and Its Relationship
With Customer Satisfaction and Loyalty
Manilall Dhurup
1Jhalukpreya Surujlal
2*Ephraim Redda
31Vaal University of Technology, Faculty of Management Sciences, Vanderbijlpark, South Africa 2North-West University (Vaal Campus), Faculty of Economic Sciences and Information Technology, Vanderbijlpark, South Africa 3North-West University, School of Economic Sciences (Vaal Triangle Campus), Vanderbijlpark, South Africa
Doi:10.5901/mjss.2014.v5n8p72
Abstract
In today`s fast-paced business environment, rendering quality service to customers has become crucially important to any organisation and banks are no exception. The rapid advancement in technology-based systems, especially those related to the Internet, has led to fundamental changes in how banks interact with customers. This study provides insights on a framework for understanding customer perceptions of the quality of technology-based banking service and the relationship with customer satisfaction and loyalty in a developing country. A structured questionnaire containing 37 variables relating to online banking service quality was administered to two hundred Internet banking customers in Southern Gauteng in South Africa (SA). Using a factor analysis procedure seven factors that influence customer perception of online banking service quality were extracted. These factors were assurance, responsiveness, ease of use, accessibility, fulfilment, speed and accuracy, and contact. The relationship among the constructs of online banking service quality, customer satisfaction and loyalty was established by using correlations and regression analysis. The findings provide evidence that the seven dimensions of technology based service quality positively influence customer satisfaction and loyalty. The results show that periodic measurements of the levels of online banking service quality should become an integral part of any bank`s effort and strategy in improving service quality levels.
Keywords: Service quality, technology-based banking, customer perceptions, satisfaction, loyalty. 1. Introduction
A substantial body of research on service and service quality measurement has been conducted in the past twenty years on traditional forms of businesses (Han & Baek, 2004) with service quality measurements in various disciplines in businesses ranging from financial services to restaurants (Mehta, Lalwani & Han, 2000). Many of these studies utilised the service quality (SERVQUAL) instrument to measure service quality delivered through regular offline channels (Han & Baek, 2004) which were primarily based on the disconfirmation notion, whereby service quality is perceived through a comparison between expectations and experiences over a number of attributes of quality (Grönroos, 2007).
With globalisation, technological advancement, financial innovation, changing information systems and deregulation, a new avenue to conduct business transactions has opened up through online technologies. (Hamadi, 2010). In search of competitive advantage, banks, in particular, have focused on shifting their delivery towards self-service channels such as online banking self-services (Pikkarainen, Pikkarainen, Karjaluoto & Pahnila, 2004). Such developments have changed the way banks and consumers interact in conducting business. As banks compete in the market place with generally undifferentiated products, e-service quality has become a primary competitive means of differentiation (Kumar, Kee & Charles, 2010). The challenging business environment has also propelled the financial services market to develop and use alternative delivery channels with a view to attracting more customers, improving customers’ perceptions and instilling customer loyalty (Bauer, Hammerschmidt & Falk, 2005). The measurement of service quality in online banking, however, has received little attention. This is primarily because managers often disregarded its importance, and, secondly, because service quality in online technologies is so difficult to conceptualise and measure (Du Plessis & Rousseau, 2007).
technology-driven electronic offering of services. Electronic banking is a generic term used to describe the process by which a customer may perform banking transactions electronically without visiting a banking institution (Ombati, Mangatu, Nyamwange & Nyaoa, 2010). Online banking in the context of this study is defined as an Internet portal through which customers can use different kinds of banking services, ranging from bill payment to making investments (Pikkarainen et al., 2004). It involves the provision of services such as accessing accounts, transferring funds and buying financial products or services online. Therefore, websites of banks that offer only information on their pages without the possibility of making any transactions are excluded as online banking services for the purpose of this study.
2. Traditional Service Quality and Service Quality of Online Banking Services
Service quality is defined as an overall assessment of service by customers (Ganguli & Roy, 2010). Perceived service quality results from a comparison of customers’ prior expectations about a service and their perceptions after the actual experience of the service encounter (Parasuraman, Zeithaml & Berry, 1985). If expectations are greater than performance, then perceived quality is less than satisfactory and may result in customer dissatisfaction.
Various models have been developed and used in the past in the measurement of service quality. Grönroos (1984) developed a service quality model with three dimensions, namely, technical quality (what the consumer gets), functional quality (how the consumer gets it) and corporate image (how the consumer perceives the firm and its services). Similarly, Lehtinen and Lehtinen (1991) proposed another model with three dimensions of service quality: physical quality (the quality of the physical products), interactive quality (interaction between customers and the firm’s employees) and corporate quality (the corporate image of the firm as perceived by customers). The service quality scale (SERVQUAL) developed by Parasuraman et al. (1985), which has formed the cornerstone of the measuring of service quality, is one of the more widely used approaches for assessing service quality. The scale measures consumers’ perceptions and expectations of service quality, using the following dimensions: reliability, responsiveness, assurance, empathy and tangibles.
The concept of service quality from an e-service perspective is defined as the “consumers’ overall evaluation and judgement of excellence and quality of e-service offering in the virtual marketplace” (Santos, 2003). In contrast to their evaluation of traditional service offerings, customers are less likely to evaluate each sub-process in detail during a single visit to a website; rather, they are likely to perceive the service as an overall process and outcome.
There is growing evidence of variation in the outcomes of studies on the dimensions of e-service quality that have surfaced in an attempt to address the key attributes of service quality of online services, directly or indirectly, (Han & Baek, 2004; Parasuraman, Zeithaml & Malhotra, 2005). Barnes and Vidgen (2003) developed the Web Quality instrument (WebQual) with 24 items, specifically for online service quality measurement. Seven dimensions, namely reliability, competence, responsiveness, access, credibility, communication and understanding of the individual were established. The model developed by Parasuramanet al. (2005), referred to as the electronic service quality instrument (E-SQ) comprised seven dimensions, namely efficiency, fulfilment, system availability, privacy, responsiveness, compensation and contact. Various other researchers used modified versions of e-service quality dimensions (Santos, 2003; Yang & Fang, 2004; Jun & Cai, 2001) to measure these dimensions in different types of retail settings.
The theoretical relationship among the constructs of service quality, customer satisfaction and loyalty is addressed in the following section.
3. Service Quality, Satisfaction and Loyalty
In services marketing literature there has been considerable debate on the concept of satisfaction (Dong, 2003). Bloemer and De Ruyter (1998:501) define satisfaction as “the outcome of the subjective evaluation that the chosen alternative meets or exceeds expectations”. The basis of this definition stems from the disconfirmation paradigm as a post-purchase evaluation (Torres, Summers & Belleau, 2001). Satisfaction is also considered from a perspective of cumulative satisfaction and is defined as customers’ overall experience with the service provider after a series of service encounters (Johnson, Gustafsson & Andreassen, 2001). The majority of the past studies view satisfaction from a cumulative perspective, i.e. a global evaluation through a series of customer encounters (Gupta & Zeithaml, 2006; Ganguli & Roy, 2010) to measure the construct.
Loyalty is defined as ‘the consumer’s inclination to patronise a given firm or chain of firms over time’ (Knox & Denison, 2000:34). Previous studies found a direct relationship between service quality and loyalty in different service
of purchase of a specific brand, while attitudinal loyalty is measured by a psychological commitment to a firm (Dong, 2003). Where there is no commitment in the consumer’s repeat visit, the consumer becomes spuriously loyal (Dick & Basu, 1994). The afore-mentioned definitions suggest that consumers’ commitment is a necessary condition for loyalty to occur. In addition, previous studies (e.g. Bearden, 1977; Dong, 2003) suggest a direct link between satisfaction and loyalty. Newman (2001) posits that service quality positively influences customer satisfaction and is, in fact, a prerequisite for customer satisfaction. However, the exact relationship between the service quality dimensions of satisfaction and loyalty remains unclear.
Hoffman and Bateson (2006:333) offer an explanation on the relationships among the constructs of service quality, customer satisfaction and post-purchase intention. The authors indicate that most researchers agree that customer satisfaction is a short-term, transaction-specific measure, whereas service quality is an attitude formed by long-term, overall evaluation of performance. Customer satisfaction and service quality are without a doubt intertwined. However, their relationship is not a clear cut. Some believe that customer satisfaction leads to perceived service quality, while others believe that service quality leads to customer satisfaction. However, the authors assert that ample evidence exists that suggests that the provision of quality service delivers repeat purchases as well as new customers.
Carlson and O’Cass (2011:280) developed a framework for understanding e-service quality, its antecedents, consequences and mediators. The study examined several important issues related to the conceptualisation and measurement of service quality. The authors’ focused on the retail domain by addressing the conceptualisation of e-service quality, and the relationships between global e-e-service quality, satisfaction and behavioural intentions. The study demonstrated significant relationships among these constructs.
The conceptualisation and understanding of the relationship of service quality, customer satisfaction and loyalty remains crucial to a service firm, whether the service is provided over the counter or online.
4. Research Hypotheses
Research findings on the relationship between e-service quality and customer satisfaction are varied, as results indicate that not all quality dimensions are critical to customer satisfaction (Khan, Mahapatra & Sreekumar, 2009). Service quality was found to be a strong predictor of customer satisfaction (Dabholkar, Sheperd & Thorpe, 2000; Cronin, Brady & Hult, 2000). Within the banking industry in particular, where service quality dimensions were tested as predictors of customer satisfaction (Webb, Webster & Krepapa, 2000), it was established that not all dimensions are strong predictors of e-service quality. In addition, various researchers have established mixed relationships with e-service quality dimensions, satisfaction and loyalty (Ganguli & Roy, 2010). Against this background and keeping mind the primary purpose of the study, the following hypotheses were formulated:
- H1: Online banking service quality (SQ) positively influences customer satisfaction (CS) in the commercial
banking industry.
- H2: Online banking service quality (SQ) positively influences loyalty in the commercial banking industry. - H3: Customer satisfaction (CS) positively influences loyalty in the commercial banking industry. 5. Purpose Of The Study
The study examines the relationship between the dimensions of online banking service quality with customer satisfaction and loyalty in the South African banking industry.
6. Research Design
Given the nature of the research and taking into account the strength and suitability of both qualitative and quantitative approaches, a quantitative approach was used in addressing the research objectives and the hypotheses. Du Plessis and Rousseau (2007) view the quantitative approach as systematic and structured, aimed at obtaining information from respondents in a direct, open manner. Results obtained from such an approach are easily quantifiable and the instruments have a potentially high degree of accuracy, especially in testing specific hypotheses.
The following steps in the sampling design process, as elucidated by Martins, Loubser and Van Wyk (1999), were applied in the study.
6.1 Target population
Customers from the Gauteng province in South Africa who made use of online banking facilities from commercial banks constituted the target population for the study.
6.2 Sampling technique, sample frame and sample size
A non-probability sampling technique was employed to reach the target population. Since it was difficult to obtain a sample frame for the study, snowball sampling was used to generate an initial sample of online bank customers. These initial customers were requested to identify other potential respondents who were online bank customers to participate in the study. Consistent with sample sizes in similar studies conducted on online banking services using a non-probability sampling technique (Pikkarainen et al., 2004; Santos, 2003; Akinyele & Olorunleke, 2010; Ombati et al., 2010), the sample size for this study was set at 200 online commercial bank customers.
6.3 Measuring instrument and data collection
To date, a number of widely used instruments have been developed to measure online services, namely E-SQ, E-RecS-Qual, Web Qual (Parasuraman et al., 2005; Santos, 2003; Barnes & Vidgen, 2003) and e-banking portal quality (Bauer et al.,2005). Items from those instruments were used to develop an e-service scale to suit the South African context. The questionnaire comprised four sections. Section A – demographic data; Section B – consumer perceptions of online banking service quality; Section C – customer satisfaction and Section D – customer loyalty.
7. Analysis Of Results
7.1 Demographic profile of the sample
Of the 200 potential respondents who were approached to participate in the survey; 180 completed the questionnaire. In terms of gender there were 58.3% (n=105) male and 41.7 % (n=75) female respondents. Most of the respondents were married (40.6%; n= 73). The age group 30-39 years comprised the largest group (36.7%; n=66), followed by the age group 20-29 years (25.6%; n=46), age group 40-49 years (22.2%; n=40) and age group 50-59 years (13.9 %; n=25). A small percentage (1.7%; n=3) of those that used Internet banking was below the age of 20 years. Approximately 41% (n=73) of the respondents indicated that they accessed the Internet through their employers’` network and 33.3 % (n=60) accessed it at home through fixed line or wireless broadband. Approximately 24.4% (n=44) of the respondents still used dial-up access from their homes.
7.2 Service quality factors
Principal Component Analysis (PCA) using Varimax rotation was used to extract seven factors of service quality. Factor loadings > 0.50 were used as a threshold for the extraction of factors. The dimensions and operational descriptions are provided in Table 1.
Table 1: Factor Description
Factor Description
Assurance, trust
and appeal Refers to the degree to which customers find transacting online safe, and reliable and the appearance of the bank’s website physically and aesthetically appealing
Responsiveness Relates to effective handling of queries and problems whenever customers need the bank’s assistance
Ease of use Refers to the ease of accessing and using the bank’s website for searching, navigating and transacting
Accessibility Refers to the availability and loading of a bank’s website for performing transactions at any time
Fulfilment Refers to the extent to which the bank’s website promises about the functionality of online services are fulfilled
Speed and
accuracy Includes aspects such as how quickly and accurately customers can perform their banking transactions through the bank’s website Refers to whether the bank can be reached by a different medium of communication to help customers when they experience
7.3 Reliability
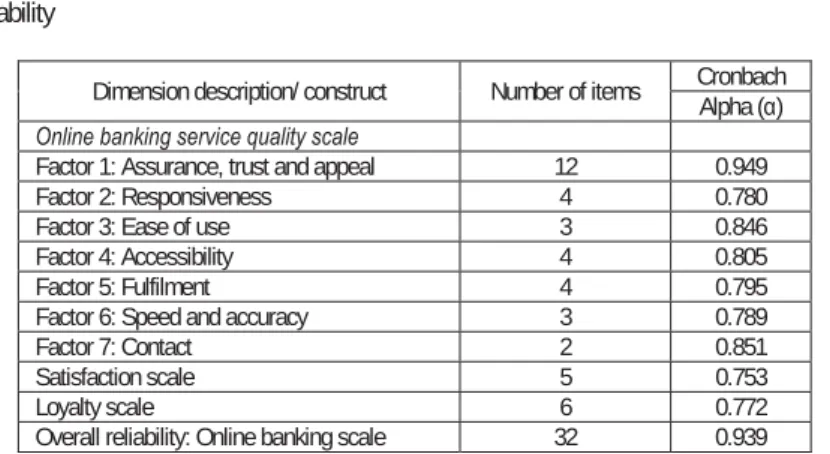
The internal consistency of the scale was ascertained by using the coefficient of Cronbach alpha (Leo et al., 2005). Coefficient Cronbach alpha values were computed for each construct and the overall reliability of the scale that was used in measuring online banking services. A reliability benchmark value of 0.70 and above was regarded as acceptable (Santos, 2003). The Cronbach alpha values are reported in Table 2. The overall Cronbach į value of the online banking scale was 0.939 implying high reliability. The reliabilities of the individual factors ranged from 0.780 to 0.949, which were considered satisfactory (Malhotra, 2004). The reliability for the customer satisfaction scale and for the loyalty scale was 0.753 and 0.772 respectively, which was also considered as satisfactory.
Table 2: Scale Reliability
Dimension description/ construct Number of items Cronbach
Alpha (Į)
Online banking service quality scale
Factor 1: Assurance, trust and appeal 12 0.949
Factor 2: Responsiveness 4 0.780
Factor 3: Ease of use 3 0.846
Factor 4: Accessibility 4 0.805
Factor 5: Fulfilment 4 0.795
Factor 6: Speed and accuracy 3 0.789
Factor 7: Contact 2 0.851
Satisfaction scale 5 0.753
Loyalty scale 6 0.772
Overall reliability: Online banking scale 32 0.939
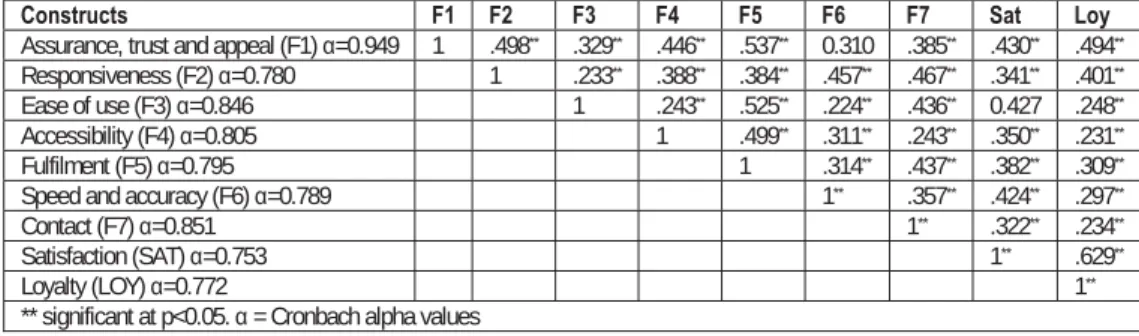
7.4 Correlations
In line with the purpose of the study, it was necessary to examine the relationship among customer perceptions of technology-based banking service quality and customer satisfaction and loyalty. Correlation analysis was conducted in order to establish the strength of the relationship. Spearman’s correlation coefficient (r) was used to analyse the bivariate relationship between the seven dimensions and satisfaction and loyalty. Table 2 summarises correlations between online banking service quality dimensions, satisfaction and loyalty. In assessing the size of the correlation coefficients, Cohen’s d-measure of effect sizes was used to measure the importance of an effect. The size of the effect, as suggested by Steyn (2000), is outlined follows: r = 0.10 to 0.29 (small effect), r = 0.30 to 0.49 (medium effect) and r 0.50 (large effect). The correlations among the seven factors were significant, ranging from r=0.224 to r= 0.537 at p<0.01 level of significance, indicating that a positive linear inter-factor association exists. The lowest correlation was recorded between responsiveness and ease of use (r=0.233). The correlation ranged from weak to strong. In terms of the importance of the effect sizes, Cohen’s d-statistics showed effect sizes ranging from small to large effects among the dimensions.
Table 2 illustrates that the correlations of the seven factors with satisfaction were significant, ranging from r=0.322 to r= 0.430 at p<0.01 level of significance, suggesting that there is a positive linear association between the seven dimensions of online banking service quality and satisfaction. Similarly, the correlations of the seven factors with loyalty were also significant, ranging from r=0.231 to r= 0.494 at p<0.01 level of significance, indicating a positive linear association between the seven dimensions of online banking service quality and loyalty. The correlations ranged from weak to moderate. In terms of the effect sizes, the correlations showed small to medium effect in terms of practical significance.
It is evident from Table 3 that the results of the Pearson correlation coefficients suggested a strong positive linear relationship, r=0.629 at p<0.01 level of significance, indicating that satisfaction with online banking services influences customer loyalty towards a bank. In terms of the effect sizes, Cohen’s measure of effect sizes showed a large practical significance. Based on the above results it is clear that there is evidence of convergence concerning the seven factors with satisfaction and loyalty.
Table 3: Correlations and reliability -E-service quality dimensions, satisfaction and loyalty
Constructs F1 F2 F3 F4 F5 F6 F7 Sat Loy
Assurance, trust and appeal (F1) Į=0.949 1 .498** .329** .446** .537** 0.310 .385** .430** .494**
Responsiveness (F2) Į=0.780 1 .233** .388** .384** .457** .467** .341** .401**
Ease of use (F3) Į=0.846 1 .243** .525** .224** .436** 0.427 .248**
Accessibility (F4) Į=0.805 1 .499** .311** .243** .350** .231**
Fulfilment (F5) Į=0.795 1 .314** .437** .382** .309**
Speed and accuracy (F6) Į=0.789 1** .357** .424** .297**
Contact (F7) Į=0.851 1** .322** .234**
Satisfaction (SAT) Į=0.753 1** .629**
Loyalty (LOY) Į=0.772 1**
** significant at p<0.05. Į = Cronbach alpha values
Since positive correlations were established among the dimensions of online banking service quality, satisfaction and loyalty, it was deemed necessary to examine the strength of the relationship further and establish any predictive relationship among the variables. In this regard, regression models were computed to further determine and validate the predictive relationship.
7.5 Regression analysis
Table 4 reflects the regression analysis between each of the seven dimensions of online banking service quality and satisfaction. The predictors that were held constant were the seven dimensions of online banking service quality (independent) and the dependent variable that was entered into the prediction model was satisfaction. On examination of the relationship between the individual dimensions and the overall satisfaction rating, the adjusted R2 = 0.36 suggests
that the online banking service quality dimensions explained 36% of the variance in the customers' overall satisfaction rating. The dimensions of factor 1 (assurance, trust and appeal), factor 3 (ease of use) and factor 6 (speed and accuracy) were statistically significant at p<0.05. Factor 2 (responsiveness), factor 4 (accessibility), and factor 7 (contact) showed no predictive relationship with overall online banking satisfaction. However, factor 5 (fulfilment), showed a negative relation to overall satisfaction. Satisfaction was primarily predicted and contributed to by factor 3 (ease of use; ȕ = 0.279), factor 6 (speed and accuracy; ȕ = 0.261) and factor 1 (assurance, trust and appeal; ȕ = 0.211). The relationship was strongest between factor 3 (ease of use) and customer satisfaction, followed by the relationship between factor 6 (speed and accuracy) and customer satisfaction.
Table 4: Regression: dimensions of online banking service quality and satisfaction
Independent variables B Beta (ȕ) T p-level
Assurance, trust and appeal 0.171 0.211 2.65 0.009*
Responsiveness 0.013 0.016 0.198 0.843
Ease of use 0.228 0.279 3.721 0.000*
Accessibility 0.082 0.112 1.507 0.134
Fulfilment -0.017 -0.022 -0.256 0.798
Speed and accuracy 0.196 0.261 3.677 0.000*
Contact 0.001 0.001 0.019 0.985
R = 0.597 R2= 0.357 Adjusted R2= 0.331 F = 13.643 *p<0.05. Dependent variable: satisfaction
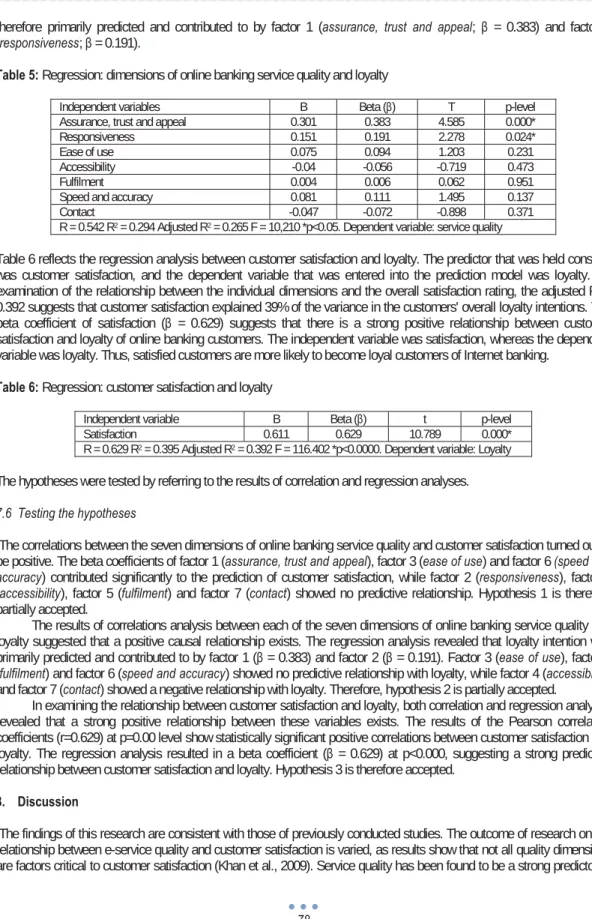
Table 5 outlines the regression analysis between the individual dimensions of online banking service quality and loyalty. The predictors that were held constant were the seven dimensions of online banking service quality (independent) and the dependent variable that was entered into the prediction model was loyalty. On examination of the relationship between the individual dimensions and the overall loyalty rating, the adjusted R2 = 0.27 suggests that banking service
quality dimensions explained 27% of the variance in the customers' overall loyalty intentions. The results show that Factor 1 (assurance, trust and appeal) and factor 2 (responsiveness) were statistically significant at p<0.05. Factor 3 (ease of use), factor 5 (fulfilment) and factor 6 (speed and accuracy) showed no predictive relationship with loyalty. On
therefore primarily predicted and contributed to by factor 1 (assurance, trust and appeal; ȕ = 0.383) and factor 2 (responsiveness; ȕ = 0.191).
Table 5: Regression: dimensions of online banking service quality and loyalty
Independent variables B Beta (ȕ) T p-level
Assurance, trust and appeal 0.301 0.383 4.585 0.000*
Responsiveness 0.151 0.191 2.278 0.024*
Ease of use 0.075 0.094 1.203 0.231
Accessibility -0.04 -0.056 -0.719 0.473
Fulfilment 0.004 0.006 0.062 0.951
Speed and accuracy 0.081 0.111 1.495 0.137
Contact -0.047 -0.072 -0.898 0.371
R = 0.542 R2 = 0.294 Adjusted R2= 0.265 F = 10,210 *p<0.05. Dependent variable: service quality
Table 6 reflects the regression analysis between customer satisfaction and loyalty. The predictor that was held constant was customer satisfaction, and the dependent variable that was entered into the prediction model was loyalty. On examination of the relationship between the individual dimensions and the overall satisfaction rating, the adjusted R2 =
0.392 suggests that customer satisfaction explained 39% of the variance in the customers' overall loyalty intentions. The beta coefficient of satisfaction (ȕ = 0.629) suggests that there is a strong positive relationship between customer satisfaction and loyalty of online banking customers. The independent variable was satisfaction, whereas the dependent variable was loyalty. Thus, satisfied customers are more likely to become loyal customers of Internet banking.
Table 6: Regression: customer satisfaction and loyalty
Independent variable B Beta (ȕ) t p-level
Satisfaction 0.611 0.629 10.789 0.000*
R = 0.629 R2= 0.395 Adjusted R2= 0.392 F = 116.402 *p<0.0000. Dependent variable: Loyalty
The hypotheses were tested by referring to the results of correlation and regression analyses.
7.6 Testing the hypotheses
The correlations between the seven dimensions of online banking service quality and customer satisfaction turned out to be positive. The beta coefficients of factor 1 (assurance, trust and appeal), factor 3 (ease of use) and factor 6 (speed and accuracy) contributed significantly to the prediction of customer satisfaction, while factor 2 (responsiveness), factor 4 (accessibility), factor 5 (fulfilment) and factor 7 (contact) showed no predictive relationship. Hypothesis 1 is therefore partially accepted.
The results of correlations analysis between each of the seven dimensions of online banking service quality and loyalty suggested that a positive causal relationship exists. The regression analysis revealed that loyalty intention was primarily predicted and contributed to by factor 1 (ȕ = 0.383) and factor 2 (ȕ = 0.191). Factor 3 (ease of use), factor 5 (fulfilment) and factor 6 (speed and accuracy) showed no predictive relationship with loyalty, while factor 4 (accessibility) and factor 7 (contact) showed a negative relationship with loyalty. Therefore, hypothesis 2 is partially accepted.
In examining the relationship between customer satisfaction and loyalty, both correlation and regression analyses revealed that a strong positive relationship between these variables exists. The results of the Pearson correlation coefficients (r=0.629) at p=0.00 level show statistically significant positive correlations between customer satisfaction and loyalty. The regression analysis resulted in a beta coefficient (ȕ = 0.629) at p<0.000, suggesting a strong predictive relationship between customer satisfaction and loyalty. Hypothesis 3 is therefore accepted.
8. Discussion
The findings of this research are consistent with those of previously conducted studies. The outcome of research on the relationship between e-service quality and customer satisfaction is varied, as results show that not all quality dimensions are factors critical to customer satisfaction (Khan et al., 2009). Service quality has been found to be a strong predictor of
customer satisfaction (Dabholkar et al., 2000; Cronin et al., 2000). However, within the banking industry, service quality dimensions were tested as predictors of customer satisfaction (Webb et al., 2000; Ganguli & Roy, 2010) where it was established that not all dimensions are strong predictors of e-service quality.
The fact that certain factors showed little predictive relationship or did not make a large impact on satisfaction and loyalty does not make the dimension unimportant, as perception of service quality and behaviour is rather a complex phenomenon and it is quite unrealistic to assume that all variables can account for a substantial proportion of variability (Schiffman, Dash & Dillon, 1977). Theory supports such relationships, which is evident in the basic needs dimensions (‘must-be’ needs) of Kano’s quality model (Zhang & Von Dran, 2002). Basic needs are the minimum attributes acceptable to a given customer (Shen, Tan & Xie, 2000) and encompass attributes customers take for granted. Their presence goes unnoticed, but their absence will generate complaints and dissatisfaction (Dhurup & Oosthuyzen, 2010). Customer satisfaction does not rise with a high performance of the service as these services are naturally expected and customers normally do not verbalise these requirements or explicitly demand them (Matzler & Hinterhuber, 1998).
The primary purpose of this research was to ascertain the nature of the relationship among the dimensions of service quality, customer satisfaction and loyalty. To this end correlation and regression analyses were performed to further validate the theoretical background of the relationship that exists among these constructs. As elaborated earlier the results show significant linear association of these constructs.
9. Limitations and Implications for Further Research
Since it was difficult to obtain a sample frame for the study, snowball sampling was used to generate an initial sample of online bank customers. While the sampling technique and sample size are consistent with similar studies conducted on online banking services, generalising the result of this study over the entire population should be approached with caution. In order to add value to the evaluation of online service quality, it is strongly advocated that future research include a larger sample size in order to test the robustness of the scale.
Customers from Southern Gauteng who made use of online banking facilities of commercial banks constituted the population for the study. While the dimensions that were extracted in this study were in congruence with other studies undertaken in other parts of the world, taking into account that South Africa is comprised of different sub-markets, each with distinct characteristics, it would be unrealistic to generalise the findings revealed in the study to other regions of the country.
Future research could contribute to analysis of consumer behaviour by adding other perception variables that may influence online banking service quality. A quantitative research design was employed in this research. Future research may consider both a qualitative and quantitative analysis using triangulation methodology. The study was not specific. For more practical purposes, future endeavours could be focused in organisation/bank-specific studies.
10. Conclusion
The absence of interpersonal contact and the replacement of human-to-human interaction with human-to-machine interaction have serious implications for what dimensions to consider when evaluating online banking service quality for purposes of customer satisfaction and loyalty.
The study contributes to the body of knowledge of an understanding of online banking service quality, its measurement within e-banking environments and its relationship with satisfaction and loyalty in a developing country. Whilst the findings of this research are congruent with existing literature on the subject, extant literatures suggest that the level of customer satisfaction derived from quality service impact on post-purchase intentions of customers. Thus satisfied customers are more likely to do business repeatedly with the same organisation and less likely to engage in switching behaviours. Achieving loyal customers who patronize and associate themselves with online banking is of particular significance for banks to grow potential markets and succeed in turbulent and competitive e-banking environments.
References
Bauer, H., Hammerschmidt, M. & Falk, T. (2005). Measuring the quality of E-banking portals. International Journal of Bank Marketing, 23(2), 153-175.
Bearden, W.O. (1977). Determinant attributes of store patronage: Downtown versus outlying shopping centres. Journal of Retailing, 53(2), 15-22.
Bloemer, J. & De Ruyter, K. (1998). On the relationship between store image, store satisfaction, and store loyalty. European Journal of Marketing, 32,
499-513.
Carlson, J. & O`cass, A. 2011. Developing a framework for understanding e-service quality, its antecedents, consequences, and mediators. Managing
Service Quality, 21(3):264-285.
Cronin, J.J. (Jr)., Brady, M.K. & Hult, G.T.M. (2000). Assessing the effects of quality, value, and customer satisfaction on consumer behavioral intentions in
service environments. Journal of Retailing, 76(2), 193-218.
Dabholkar, P.A., Shepherd, C.D. & Thorpe, D.I. (2000). A comprehensive framework for service quality: an investigation of critical conceptual and
measurement issues through a longitudinal study. Journal of Retailing, 76(2), 139-173.
Dhurup, M. & Oosthuyzen, A. (2010). Salient store image attributes in consumer store selection decisions and the relationship with store satisfaction and
loyalty. Journal of Contemporary Management, 7, 380-401.
Dick, A. & Basu, K. (1994). Customer loyalty, toward an integrated conceptual framework. Journal of the Academy of Marketing Science, 22, 99-113.
Dong, M.K. (2003). Inter-relationships among store image, store satisfaction, and store loyalty among Korea discount retail patrons. Asia Pacific Journal of
Marketing and Logistics, 15(4), 42-71.
Du Plessis, F. & Rousseau, G.G. (2007). Buyer Behaviour: Understanding Consumer Psychology and Marketing. Oxford University Press Southern Africa:
Cape Town.
Ganguli, S. & Roy, S.K. (2010). Generic terminology-based service quality dimensions in banking: Impact on customer satisfaction and loyalty. International
Journal of Bank Marketing, 29(2), 276-291.
Grönroos, C. (1984). A service quality model and its marketing implications. European Journal of Marketing, 18(4), 36-44.
Grönroos, C. (2007). Service Management and Marketing: Customer Management in Service Competition. John Wiley & Sons Ltd: England.
Gupta, S. & Zeithaml, V. (2006). Customer metrics and their impact on financial performance. Marketing Science, 25(6), 718-739.
Hamadi, C. (2010). The impact of quality of online banking on consumer commitment. Communications of the IBIMA 2. Retrieved from http://www.ibimapublishing.com/journals/CIBIMA/cibima.html.
Han, S. & Baek, S. (2004). Antecedents and consequences of service quality in online banking: An application of the SERVQUAL instrument. Advances in
Consumer Research, 31, 208-214.
Hoffman, K.D. & Bateson, J.E.G. 2006. Service Marketing: Concepts, Strategies & Cases. New York: Thompson South Western.
Johnson, M.D., Gustafsson, A. & Andreassen, T.W. (2001). The evolution and future of national customer satisfaction index models. Journal of Economic
Psychology, 22, 217-245.
Jun, M. & Cai, S. (2001). The key determinants of internet banking service quality: a content analysis. International Journal of Bank Marketing, 19(7),
276-291.
Khan, M.S., Mahapatra, S.S. & Sreekumar, S. (2009). Service quality evaluation in internet banking: An empirical study in India. International Journal of
Indian Culture and Business Management, 2(1), 30-46.
Knox, S. & Denison, T. (2000). Store loyalty: its impact on retail revenue. An empirical study of purchasing behaviour in the UK. Journal of Retailing and
Consumer Services, 7, 34-45.
Kumar, M., Kee, F.T. & Charles, V. (2010). Comparative evaluation of critical factors in delivering service quality of banks: An application of dominance
analysis in modified SERVQUAL model. International Journal of Quality & Reliability Management, 27(3), 351-377.
Lehtinen, U. & Lehtinen, J.R. (1991). Two approaches to service quality dimensions. The Service Industries Journal, 11(3), 287-303.
Malhotra, N.K. (2004). Marketing Research: An Applied Orientation. 4th ed. Upper Saddle River, New Jersey: Pearson Education Prentice Hall.
Martins, J.H., Loubser, M. & Van Wyk, H.D.J. (1999). Marketing Research: A South African Approach. 2nd ed. Pretoria: University of South Africa Press.
Matzler, K. & Hinterhuber, H.H. (1998). How to make product development projects more successful by integrating Kano’s model of customer satisfaction
into quality function deployment. Technovation, 18(1), 25-38.
Mehta, C., Lalwani, A.K. & Han, L.S. (2000). Service quality in retailing: relative efficiency of alternative measurement scales for different product-service
environments. International Journal of Retail & Distribution Management, 28(2), 62-72.
Newman, K. (2001). Interrogating SERVQUAL: a critical assessment of service quality measurement in a High Street retail. International Journal of Bank
Marketing, 3(19), 126-139.
Ombati, T.O., Mangatu, P.O., Nyamwange, S.O. & Nyaoa, R.B. (2010). Technology and service quality in the banking industry. African Journal of Business
and Management (AJBUMA), 1, 151-164.
Parasuraman, A., Zeithaml, V. & Malhotra, A. (2005). E-S-QUAL: A multiple-item scale for assessing electronic service quality. Journal of Service Research,
7(3), 213-233.
Parasuraman, A., Zeithaml, V. & Berry, L. (1985). A conceptual model of service quality and its implications for future research. Journal of Marketing, 49,
41-50.
Pikkarainen, T., Pikkarainen, K., Karjaluoto, H. & Pahnila, S. (2004). Consumer acceptance of online banking: an extension of technology acceptance
model. Internet Research, 14(3), 224-235.
Santos, F. (2003). E-service quality: S model of virtual service quality dimensions. Managing Service Quality, 13(3), 233-246.
Schiffman, L.G., Dash, J.F. & Dillon, W.R. (1977). The contribution of store-image characteristics to store-type choice. Journal of Retailing, 53(2), 3-14.
Shen, X.X., Tan, K.C. & Xie, M. (2000). An integrated approach to innovative product development using Kano’s model of QFD. European Journal of
Innovative Management, 3(2), 91-99.
Steyn, H.S. (Jr). (2000). Practical significance of the difference in means. Journal of Industrial Psychology, 26(3), 1-3.
Torres, M., Summers, T. & Belleau, D. (2001). Men’s shopping satisfaction and store references. Journal of Retailing and Consumer Services, 8, 205-212.
Webb, D., Webster, C. & Krepapa, A. (2000). An exploration of the meaning and outcomes of a customer-defined market orientation. Journal of Business
Research, 48,101-112.
Yang, Z. & Fang, X. (2004). Online service quality dimensions and their relationships satisfaction; A content analysis of customer reviews of securities
brokerage services. International Journal of Service Industry Management, 15(3), 302- 325.
Zhang, P. & Von Dran, G.M. (2002). User expectations and ranking of quality factors in different web site domains. International Journal of Electronic