Processing optimisation, mechanical properties and microstructural evolution during selective laser melting of Cu-15Sn high-tin bronze
Abstract
Selective laser melting (SLM), as a novel additive manufacturing technique, has attracted increasing attention in copper alloys. In this research, to investigate forming processing and attendant mechanical properties of high-tin bronze in SLM, a statistical relationship between processing parameters (laser power, scanning speed and hatch space) and density of Cu-15Sn bronze in SLM was established using an experimental approach with response surface method and analysis of variance. As such, nearly fully-dense SLM Cu-15Sn bronze specimens were firstly manufactured whose reasonable microstructural evolution and mechanical properties were investigated before and after annealing and compared with QSn15-1-1 (GB/T 5231-2012) drawing specimens. It is found that the SLM Cu-15Sn specimens present the significantly fine grain microstructures that consist of cellular and dendritic structures. The ultimate tensile strength varies from ~661 MPa to ~545 MPa, the elongation at break from ~7.4% to >20% and the Vickers hardness ranges from ~212 HV 0.3 to ~168 HV 0.3 for SLM Cu-15Sn specimens after annealing, which are generally superior to those of QSn15-1-1 specimens. In addition, it has been proposed that the dominated strengthening mechanism of SLM Cu-15Sn parts has transformed from fine-grain to solid solution strengthening after annealing.
Keywords: Selective laser melting, copper alloys, microstructure, crystal growth, mechanical properties
1. Introduction
Tin-bronze, mainly including Cu and Sn elements, is one of the oldest traditional alloys known to people. The diversities in properties of tin bronze are owing to the different tin content, resulting in a wide range of applications [1]. In general, tin bronze with low level Sn (less than 5 wt.%) intended for plastic working is widely used in electrical and electronic industries such as sensitive elements of pressure gauges and electrical connectors as well as high-precision springs [2, 3]. With the increase of the content of tin, the mechanical properties of tin bronze can be strengthened [4]. When tin content is greater than 10 wt.%, high-tin bronze exhibits excellent mechanical properties and wear resistance as well as corrosion resistance, and therefore obtains applications in navigationand machinery industries such as marine components and bearings [5, 6]. For the high-tin bronze, it has a difficulty in plastic deforming due to the generation of brittle δ phase, thus its primarily manufacturing technique is casting [1]. What’s more, the high-tin bronze parts produced by conventional cashigh-ting possess abundant defects such as low densification, shrinkage-cavity and micro-crack, and serious segregation [7]. Therefore, a series of methods of improving mechanical properties and reducing defects for bronze were developed with an aim to broaden its industrial applied range. These methods mainly include advanced casting technologies (e.g. centrifugal casting technique [8]), adding second-phase particles into bronze alloys [6, 9], liquid phase sintering (LPS) [10], direct metal laser sintering (DMLS) [11, 12] and its combination.
As an addictive manufacturing (AM) technique, Selective laser melting (SLM) has been widely concerned [13] whose characteristic of rapid solidification in micro-sized molten pool gives rise to the occurrence of various non-equilibrium phenomena, thus leading to the formation of characteristic microstructures and the improvement of mechanical properties [14]. The complete melting/solidification mechanism of SLM is responsible for producing fully dense parts with mechanical properties comparable to those fabricated by conventional wrought process [15]. As such, the SLM is a suitable candidate for acquiring excellent mechanical properties with minor aforementioned defects of the high-tin bronze. Thanks to the versatility in the light of both complicated shapes and opening design freedoms, a series of materials in SLM were developed and mainly focusing on the steel and iron-based alloys, titanium and its alloys, Inconel and nickel-based alloys [15]. Unfortunately, the researches of copper alloys in SLM are still limited in virtue of the copper’s low absorptivity at laser and high thermal conductivity [16] as well as poor liquid fluidity caused by the paste solidification mechanism. Although increasing the energy density has offered a feasibility to produce high-density copper alloy parts in SLM [2, 16-20], there are still no interrelated researches systematically elaborating the optimisation process of the processing parameters and the relationships between mechanical properties and microstructural evolution of high-tin bronze in SLM.
In this research, an experimental approach, including response surface method (RSM) design and analysis of variance (ANOVA) technique, has been adopted to establish a statistical relationship between the density and the processing parameters (laser power, scanning speed and hatch space) with an aim to fabricate Cu-15Sn bronze parts with the optimal density. This approach has been demonstrated to be an effective method of process optimisation in SLM [21, 22]. Then, these almost fully-dense SLM Cu-15Sn specimens were used to elaborate the evolutionary mechanisms of microstructures and mechanical properties before and after different annealing treatment, so that an in-depth comprehension would be formed about the relationship between microstructures and mechanical properties.
2. Experimental procedures
2.1 Experimental material and equipment
The raw material for this study is gas-atomized prealloyed Cu-15Sn tin bronze powder supplied by SNDVARY (Wuxi SNDVARY New Powder Materials Technology co., Ltd) and its normal chemical compositions are listed in Table 1. Fig. 1(a) shows a scanning electron microscope (SEM) image of the powders. These powders with some small satellite particles are mostly spherical shapes, which is responsible for a reasonable flowability and a higher apparent density [23]. Fig. 1(b) presents the particle size distribution (23-53 μm) with an average size of 33 μm. The used SLM system is the commercial SLM machine EOSINT M280 (EOS GmbH, Krailling, Germany), which mainly consists of a single-mode continuous wave ytterbium fiber laser YLR-200 (IPG Photonics, Oxford, MA, USA) with a maximum effective output power of 195 W and a laser spot size of 100 μm, an automatic powder feeding system, an inert gas recycle system and a computer system for process control.
Table 1
Chemical composition of the raw Cu-15Sn bronze powder
Elements Cu Sn Impurities
Content (wt. %) Balance 14.55 Less than 0.2
Fig. 1. (a) SEM morphology and (b) particle size distribution of the starting Cu-15Sn powder. 2.2 Experimental methods
During processing parameter optimisation for density, all specimens in this investigation were fabricated as the dimensions of 5 mm × 5 mm × 5 mm under a nitrogen atmosphere environment. The varied processing parameters including laser power (LP), scanning speed (SS) and hatch space (HS) were mainly concerned. A standard raster scanning strategy with a 67° rotation between two consecutive layers was employed. The layer thickness was kept constant at 40 μm and the preheating temperature was fixed at 40 °C. The RSM design and the ANOVA technique were used in this experiment. For the RSM, a narrow value range of factors is significant to obtain the optimised response value. Therefore, through a series of preliminary experiments, a narrower processing parameter window was chosen, as listed in Table 2. The parameters follow the rule of central composite design (CCD), which is in favor of statistically analyzing the effects of these processing parameters on densification level using Minitab software. Based on these measured density values caused by various parameter sets, the ANOVA was carried out to predict the optimal parameter set and the resultant density. Subsequently, this optimal parameter set was validated by comparing the resultant density with that of all above specimens.
Table 2
The value ranges of the processing parameters in the optimisation experiment for density.
Parameter Units Values
-1.682 -1 0 1 1.682
LP W 185 187 190 193 195
SS mm/s 170 176 185 194 200
HS μm 120 140 160 180 200
The validated processing parameter set were chosen to manufacture Cu-15Sn specimens for the further investigation of its corresponding phase compositions, microstructures and mechanical properties. Among these specimens, the cube samples
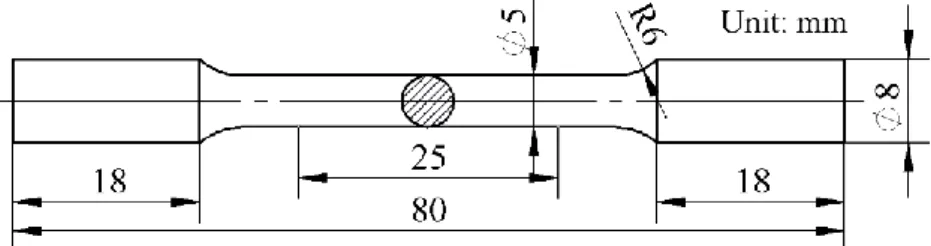
with the size of 5 mm × 5 mm × 8 mm were used for phase identification, microstructural observation and Vickers hardness measurement, and the tensile bars with the configuration (as shown in Fig. 2) followed the Chinese GB/T228.1-2010 standard were used to conduct room-temperature mechanical tests. Prior to above tests, a part of Cu-15Sn SLM specimens were chosen to conduct heat treatment at different annealing temperatures of 500 °C, 600 °C and 700 °C for 4 h both with air cooling.
Fig. 2. The configuration of the tensile bars. 2.3 Specimens characterization
The particle size distribution of the powder was measured using a laser particle size analyzer Mastersizer 2000 (Malvern Instruments Ltd., Malvern, UK). The densities of as-built SLM specimens were measured at least 10 times using an electronic balance BSM-220.4 (Zhuojing, Shanghai, China) with the Archimedes method and these values were averaged for reducing measurement errors. The samples with the optimal density for microstructural examination were prepared through a standard metallography methodology and etched with 5g FeCl3, 10 ml HCl and 100 ml distilled H2O mixed solution. The microstructures and tensile fracture surfaces were characterized by a field emission scanning electron microscope (FE-SEM; JEOL JSM-7800F) and a VEGA 3 scanning electron microscope (TESCAN, Brno, Czech Republic). Phase identification was carried out using Empyrean X-Ray Diffraction (PANalytical, Almelo, Netherlands) with Cu-Kα radiation at 40 kV and 40 mA. The electron transparent specimens were prepared from the SLM sample, and transmission electron microscope (TEM; FEI Tecnai G2 F30) characterization was carried out for giving evidences of these phases. The crystallographic texture was measured by scanning electron microscope (Hitachi S-3400N) equipped with an Electron backscattered diffraction (EBSD) module. Room temperature mechanical tests were performed using a CMT5105 electronic universal tester (MTS, Eden Prairie, MN, USA) in compliance withthe Chinese GB/T228.1-2010 standard and a strain rate of 0.04/min. Vickers hardness was measured on polished cross-sections of each sample using a NH-5L hardness tester (Shanghai EVERONE Precision Instruments Co., Ltd., Shanghai, China) with a 300 g load for 10 s.
3. Results and discussion 3.1 Process optimisation
Table 3 clearly shows the varied densities and attendant relative densities of the specimens resulted from different processing parameter sets. All the relative densities of the samples in RSM are beyond 98%, which means that this processing parameters window is of predictive capability to find an optimal processing parameter set. Based on these measured densities, ANOVA was carried out using a general second-order density model in terms of processing parameters. This model can be expressed as follows[22, 24]:
Density= β0+β1X1 +β2X2+β3X3+β11X12+β22X22 +β33X32+β12X1X2+ β13X1X3
+β23X2X3+ε (1)
Where X1,X2 and X3 are the laser power, scanning speed and hatch space, respectively,
while β1, β2, β3, β11, β22, β33, β12, β13, β23 are constant coefficients of this model and 𝜀 is the random error.
The results of ANOVA have been presented in Table 4, and the obtained density model versus LP, SS and HS is given below as equation (2)
Density= - 20.52 + 0.2768 LP + 0.0226 SS + 16.27 HS - 0.000935 LP2- 0.000233 SS2
- 16.18 HS2 + 0.000394 LP*SS + 0.0007 LP*HS - 0.0583 SS*HS (2) In ANOVA, the F-value is used to make a test of the null hypothesis that the means of all the treatments are equal. Then, the F-value is computed and compared with the standard value [24]. The P-value represents the probability of calculated F-value larger than standard value, which indicates the significance level of impact factor. There is a stipulation in tradition that P-values less than 0.05 mean statistically significant, and those less than 0.01 mean highly statistically significant. From Table 4, it generally exerts the highly significant for all the impact factors including linear, square and 2-way interaction other than the interaction of laser power and hatch space (LP*HS). Furthermore, the lack of fit with the P-value of 0.121 shows an insignificant effect on the resulted density, demonstrating the model has a good fit with these measured densities. In addition, among these impact factors, it is noted that scanning speed is the most significant impact factor with the greatest F-value, which can be ascribed to influences of scanning speed on both energy density and solidification rate.
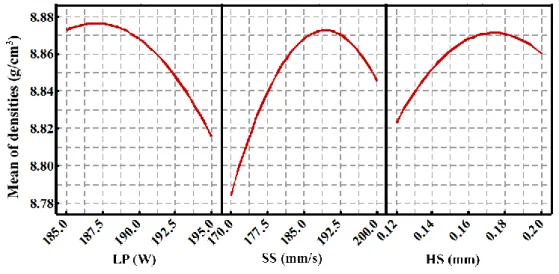
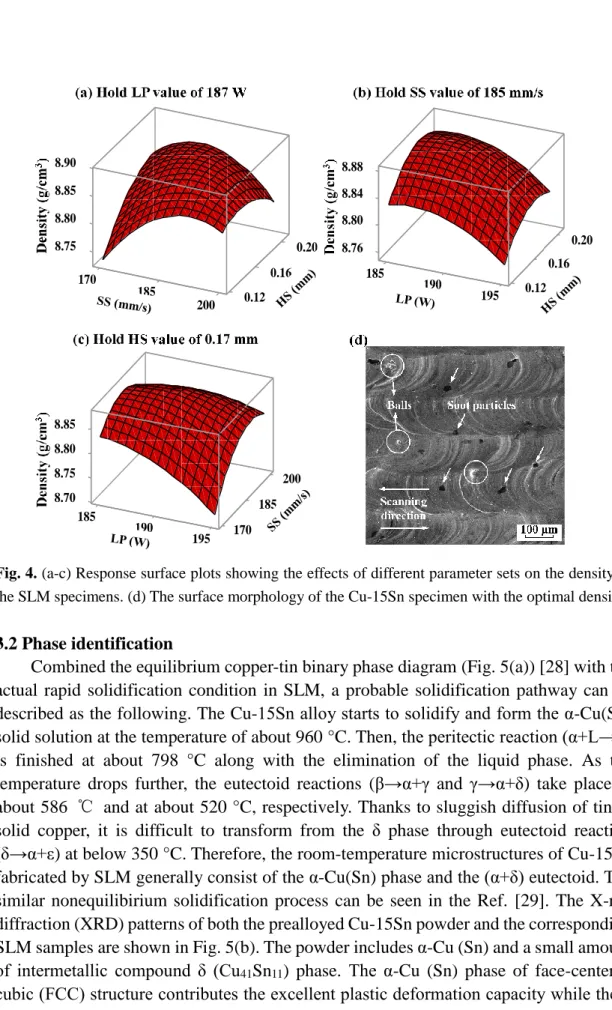
Fig. 3 shows the main effects of the LP, SS and HS on the density. It can be found that the density have the maximum value versus all the processing parameters in the chosen processing window. Therefore, it can be concluded that the optimal density can be obtained using an optimised processing parameter set. According to the ANOVA and the density model equation (2) with the objective of maximum value, the optimal density has been predicted as the value of 8.8794 g/cm3 and the attendant processing parameter set with the LP of 187 W, the SS of 185 mm/s and HS of 0.17 mm. Under the condition of holding the one of these optimal processing parameters respectively, the response surfaces for the density model with respect to the remaining two parameters have been presented in Fig. 4(a-c) and clearly show the peak value of the density. Then, for validation purpose, five specimens were fabricated using the above optimised parameter set, and their densities were measured and compared with those of specimens in Table 3. The average measured density is 8.886 g/cm3 and larger than that of the maximum value in Table 3. The surface morphology of the validated specimen has been shown in Fig. 4(d). A common scaly feature in SLM can be observed. It is concluded that the clear and homogeneous molten pool morphology and smooth surface contribute the optimal density in this research. The similar observations have been reported in SLM of a novel titanium
alloy [25]. Simultaneously, some small-sized balls and black soot particles can be detected on the surface, which has a negative influence on the density. This balling phenomenon has been reported and explained as the instability of molten pool by Gu et al.[26, 27], while the soot particles were caused by the oxidation of these small-sized liquid droplets splashed from the molten pool. In term of the optimised parameter set, phase identification, microstructural evolution and mechanical properties have been investigated and discussed in the following.
Table 3
Experiment design matrix and measured densities of Cn-15Sn specimens in SLM.
Standard order
Run order
Processing parameters Response LP (W) SS (mm/s) HS (mm) Density (g/cm3) Relative density (%) 1 15 187 176 0.14 8.816 98.83 2 11 193 176 0.14 8.756 98.16 3 13 187 194 0.14 8.861 99.34 4 7 193 194 0.14 8.841 99.11 5 1 187 176 0.18 8.868 99.42 6 12 193 176 0.18 8.807 98.73 7 19 187 194 0.18 8.862 99.35 8 3 193 194 0.18 8.844 99.15 9 5 185 185 0.16 8.865 99.38 10 10 195 185 0.16 8.824 98.92 11 16 190 170 0.16 8.790 98.54 12 14 190 200 0.16 8.841 99.11 13 20 190 185 0.12 8.830 98.99 14 17 190 185 0.20 8.854 99.26 15 18 190 185 0.16 8.873 99.47 16 6 190 185 0.16 8.858 99.30 17 2 190 185 0.16 8.869 99.43 18 4 190 185 0.16 8.870 99.44 19 9 190 185 0.16 8.869 99.43 20 8 190 185 0.16 8.868 99.42 Table 4
The results of the ANOVA for the effects of linear, square and 2-way interaction of the processing parameters on the density.
Source Degree of freedom
Adjusted sum of squares
Adjusted mean
of square F-Value P-Value Model 9 0.018139 0.002015 37.72 0.000 Linear 3 0.009833 0.003278 61.34 0.000 LP (W) 1 0.003785 0.003785 70.84 0.000 SS(mm/s) 1 0.004456 0.004456 83.39 0.000
HS (μm) 1 0.001592 0.001592 29.79 0.000 Square 3 0.006209 0.002070 38.74 0.000 LP2 1 0.000985 0.000985 18.43 0.002 SS2 1 0.004943 0.004943 92.51 0.000 HS2 1 0.001207 0.001207 22.59 0.001 2-Way interaction 3 0.002096 0.000699 13.08 0.001 LP*SS 1 0.000873 0.000873 16.34 0.002 LP*HS 1 0.000000 0.000000 0.00 0.984 SS*HS 1 0.001223 0.001223 22.89 0.001 Error 10 0.000534 0.000053 Lack of Fit 5 0.000404 0.000081 3.08 0.121 Pure Error 5 0.000131 0.000026 Total 19 0.018673
Fig. 4. (a-c) Response surface plots showing the effects of different parameter sets on the density of the SLM specimens. (d) The surface morphology of the Cu-15Sn specimen with the optimal density. 3.2 Phase identification
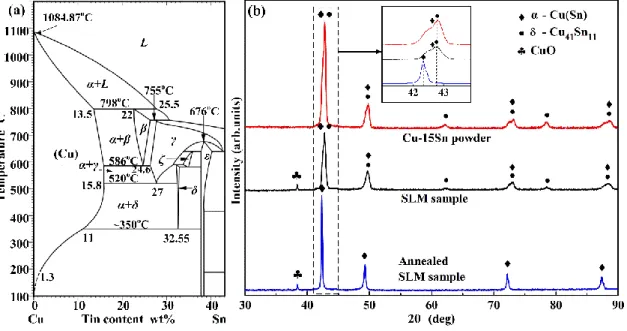
Combined the equilibrium copper-tin binary phase diagram (Fig. 5(a)) [28] with the actual rapid solidification condition in SLM, a probable solidification pathway can be described as the following. The Cu-15Sn alloy starts to solidify and form the α-Cu(Sn) solid solution at the temperature of about 960 °C. Then, the peritectic reaction (α+L→β) is finished at about 798 °C along with the elimination of the liquid phase. As the temperature drops further, the eutectoid reactions (β→α+γ and γ→α+δ) take place at about 586 ℃ and at about 520 °C, respectively. Thanks to sluggish diffusion of tin in solid copper, it is difficult to transform from the δ phase through eutectoid reaction (δ→α+ε) at below 350 °C. Therefore, the room-temperature microstructures of Cu-15Sn fabricated by SLM generally consist of the α-Cu(Sn) phase and the (α+δ) eutectoid. The similar nonequilibirium solidification process can be seen in the Ref. [29]. The X-ray diffraction (XRD) patterns of both the prealloyed Cu-15Sn powder and the corresponding SLM samples are shown in Fig. 5(b). The powder includes α-Cu (Sn) and a small amount of intermetallic compound δ (Cu41Sn11) phase. The α-Cu (Sn) phase of face-centered cubic (FCC) structure contributes the excellent plastic deformation capacity while the δ (Cu41Sn11) phase belonging to the hard brittle phase is in favor of the improvement of tensile strength and hardness but has a limitation on deformation [1, 7]. After laser melting, the phase constituents of the sample fabricated by SLM is almost consistent with
5 8 1 . 57 8 .8 8 0 0 7 1 5 8 1 0.12 0 2 0 0 2 . 0 6 1 . 0 8 5.8 . 8 90 ens D ity(g/cm3) 与 HS(mm), SS(mm/s) 的曲面图 190 6 7 . 8 8.80 8.84 185 190 0.12 9 1 5 0.12 0.20 0.16 2 8.84 8 8 . 8 0 7 . 8 8.75 0 . 8 8 5 8 1 0 9 1 170 5 9 195 170 1 0 2 0 8 1 5 8 . 5 8 )
that of the powder. However, it is noteworthy that the diffraction peaks of the α-Cu (Sn) decreased and slightly shifted from 42.81° to 42.75°,indicating the increase of lattice parameters (a = 0.367 nm) and the higher solidification rate in SLM. Furthermore, the SLM sample shows a minor diffraction peak at about 2θ = 38.3° suggesting the formation of a new phase, seeming to the CuO. This can be attributed to the interaction between Cu-matrix and oxygen under the condition of strongly irradiated laser energy though the low oxygen content in SLM. In addition, compared with the standard diffraction peaks of Cu (JCPDS reference pattern 04-0836, a = 0.361 nm), the relative intensities of the detected α-Cu (Sn) (111) peaks of SLM sample are much stronger, inferring that the crystal face (111) is the preferred orientations of α-Cu (Sn). After the annealing at 600 °C for 4 h, the δ (Cu41Sn11) phase cannot be detected in the measured XRD pattern. Meanwhile, the major shift from 42.75° to 42.33° in the diffraction peaksof the α-Cu (Sn) demonstrates the great increase of solid solubility of Sn in alloy due to the enough diffusion of Sn atoms and the substitutional replacement of more Cu atoms (radii of 0.128 nm) with Sn atoms (radii of 0.158 nm) [30] during annealing, leading to the further increase of lattice parameters (a = 0.369 nm). Through comparing the annealed SLM sample with the SLM sample in Fig. 5, the diffraction peaks for α-Cu (Sn) become considerably narrower, which implies the remarkable growth of grains.
Fig. 5. (a) Equilibrium copper-tin phase diagram; (b) XRD patterns for the Cu-15Sn prealloyed powder and the SLM samples before and after annealing at 600 °C for 4 h.
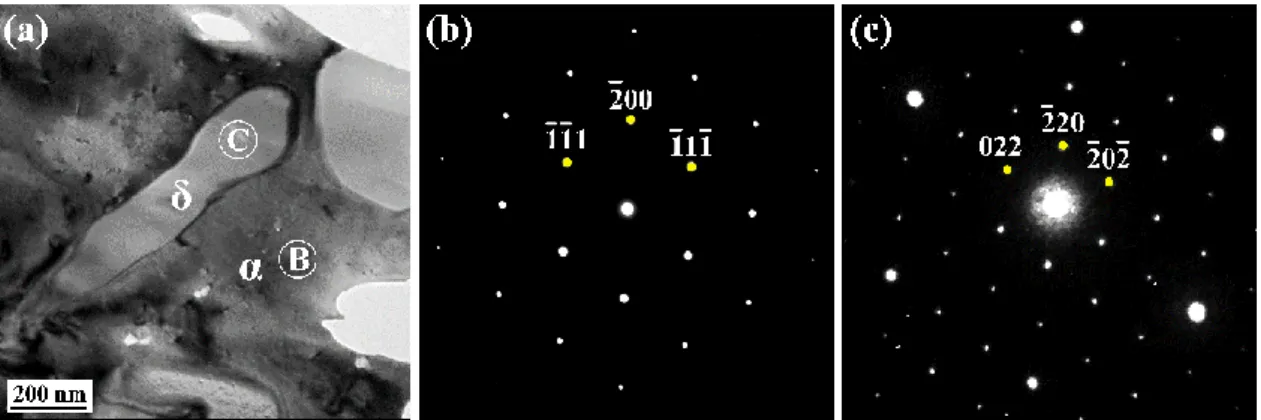
Given the diffraction peaks of the δ phase next to those of the α phase, the XRD data cannot give the sufficient proof of the δ phase. A bright field TEM image and the diffraction patterns have been present in Fig. 6. The diffraction pattern (Fig. 6(b)) from the B region in Fig. 6(a) can be indexed as [011] zone axis pattern of the α phase. According to the δ phase data (Cu41Sn11, F43𝑚, a=1.798 nm [31]), the pattern (Fig. 6(c)) from the C region in Fig. 6(a) can be indexed as [111] zone axis pattern of the δ phase. Furthermore, it can be seen in Fig. 6(a) that the δ phase in the form of lamella is embedded in the α phase. This morphology effect on the mechanical properties can be explained by
Hall-Petch-type mechanism, where the dislocation movement is confined between these lamellae, resulting in strengthening of the material.
Fig. 6. (a) A bright field TEM image showing the α phase and the δ phase, and the corresponding diffraction patterns (b) and (c) from B region and C region in (a), respectively.
3.3 Microstructure and evolutional mechanism
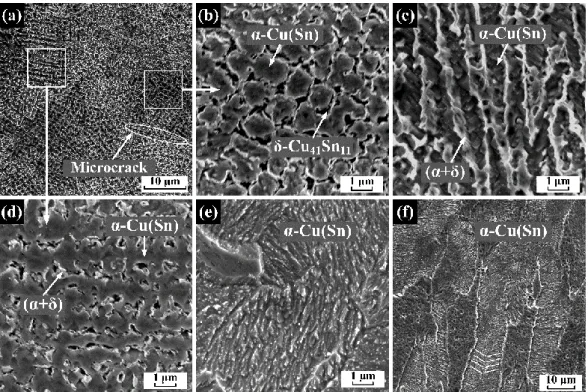
The microstructures of the SLM Cu-15Sn specimens before and after annealing are shown in Fig. 7. It is clearly shown in Fig. 7(a) that the microstructures consist of significantly fine grains with the size smaller than 2 μm, which can be attributed to the high cooling rate in SLM. Thanks to the effect of the scanning strategy on the temperature field, the microstructures in the top view (Fig. 7(a)) are not uniform and consist of two kinds of crystal structures with cellular and dendritic structures. Similar microstructures have been observed in Al-Cu-Mg samples fabricated by SLM [32]. Through observation at small magnification, the cellular structures are located in the overlapping area between adjacent tracks while dendritic structures are located in the area irradiated by laser only once. A closer observation to the cellular structures at high magnification (Fig. 7(b)) depicts the micro-segregation phenomenon with bright rings ((α+δ)-eutectoid) and inner grey matrix (α-Cu (Sn) phase) as well as tin-rich black area. Fig. 7(d) shows the dendritic microstructures at high magnification with the dendrite arm spacing of 1.2±0.2 μm and the primary dendritic arm of 700±150 nm. At the same time, the shrinkage-cavities and micro-cracks are also observed in the microstructures, which can be explained by the paste solidification mechanism and resultant inner thermal stress of the Cu-15Sn bronze. Furthermore, it seems to a common phenomenon in SLM that the microstructures in the side view (Fig. 7(c)) present the epitaxial growth along the building direction and reach to several layers thickness [14, 16, 17, 32, 33]. A part of elongated grains titled away from the building direction can be ascribed to the non-uniform temperature field caused by scanning strategy. The microstructures of the SLM sample after annealing at 600 °C for 4 h, as shown in Fig. 7(e, f), have become much coarser. The elongated grains on the side of annealed sample are still observed in Fig. 7(f) along the building direction. In addition, dense twin crystals in (111) also can be viewed due to the occurrence of partial recrystallizations.
Fig. 7. SEM images of the SLM Cu-15Sn samples (a-d) before and (e, f) after annealing at 600 °C for 4 h.
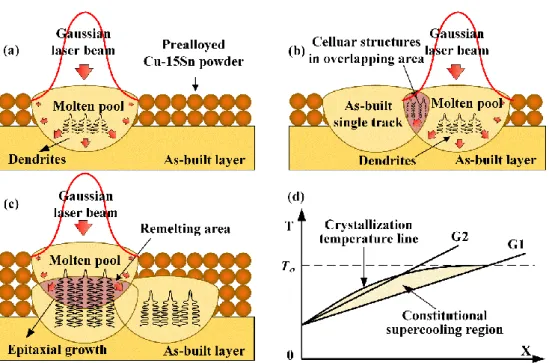
Fig. 8 schematically depicts the evolutionary mechanism of the above crystal structures of Cu-15Sn during SLM. In Fig. 8(a), under the irradiation of the Gaussian laser beam, the molten pool was formed. Here, the heat within molten pool mainly dissipated through the previously as-built layer (or the basement) since the thermal diffusion coefficient of powder was much lower than corresponding solid materials, bringing about a main temperature gradient in the building direction. Combined with the effect of constitutional supercooling on the crystal growth, the dendritic microstructures rapidly grew along the temperature gradient direction. Fig. 8(b) shows an overlapping area between two adjacent tracks. In this overlapping area, it has the higher temperature gradient than that of the area in the middle of molten pool because of the influence of as-built single track, leading to the formation of a smaller undercooling degree (as shown in Fig. 8(d)) in the solid-liquid interface front based on the constitutional supercooling theory [34]. Therefore, the cellular structures were formed in this smaller supercooling environment where the secondary dendrites were inhibited by the worse solute diffusion conditions. When the laser irradiated the next powder layer, the remelting areas (as shown in Fig. 8(c)) were formed in the previous layer where a part of dendrites was remelted. Owing to the fact that the remaining dendrites possessed similar constituents and crystal structures to that of the present molten pool, the grain growth had a preferred orientation on the previous dendrites contributing the characteristic of epitaxial growth. These characteristic microstructures will significantly affect the mechanical properties, as discussed in the following.
Fig. 8. Schematic describing the forming mechanism of Cu-15Sn in SLM: (a) the first single track, (b) the next single track and (c) the next layer. (d) The influence of temperature gradient on constitutional supercooling.
3.4 Crystallographic texture
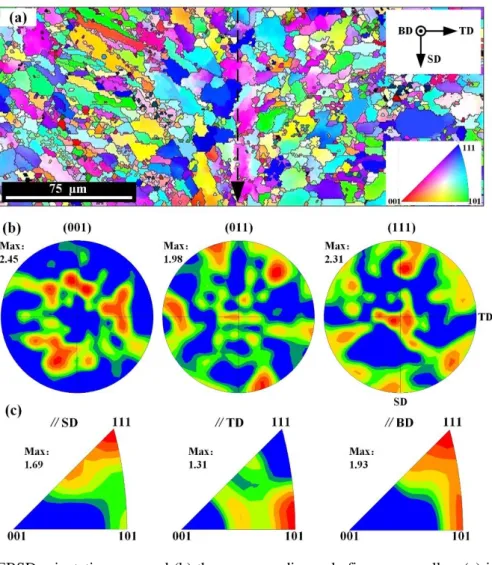
Given the characteristic of epitaxial growth in the microstructure of the SLM sample (Fig. 7(c)), it is possible that anisotropy in mechanical properties would be formed in the light of some probable texture in the building direction. Fig. 9 shows the EBSD orientation map and the corresponding pole figures (PF) as well as inverse pole figures (IPF) from the top view of the SLM sample. Besides the building direction, the temperature gradient is also produced between border and center of melt pool [35], causing a growth trend of the grains toward the center during solidification. Therefore, the scanning track of the laser can be clearly distinguished, as shown by the dotted arrow in Fig. 9(a). As with the casting process, the equiaxed grains have been formed in the center of melt pool in SLM and the similar microstructure has also been reported in the EBSD orientation map from an AlSi10Mg SLM part [36]. For orientations of grains, the top view from the SLM sample generally presents random orientations. Based on the PF (Fig. 9(b)), the maximum value of texture intensity is only 2.3, suggesting that there is only a weak texture in the SLM Cu-15Sn sample. This result is consistent with the texture research of CoCrMo alloy [35] while divergent from those of the Tantalum [37] and AlSi10Mg [36] as well as NiTi alloy [38] in SLM, which can be attributed to the effects of both scanning strategy and material properties on the temperature field. This raster scanning strategy with a 67° rotation between two consecutive layers is more inclined to obtain an isotropic part in SLM. In addition, combined the above XRD data with the IPF (Fig. 9(c)), it can be concluded that the grains only have a slight <111> preferred orientation along the building direction. Therefore, in view of the above texture results, the diversities of mechanical properties in the different direction will not be discussed in the following section.
Fig. 9. (a) EBSD orientation map and (b) the corresponding pole figures as well as (c) inverse pole figures from the top view of the SLM sample.
3.5 Mechanical properties
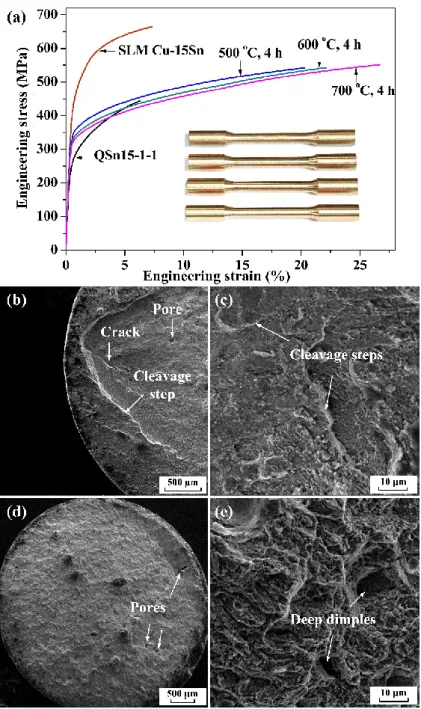
Table 5 elaborates the mechanical properties of both the QSn15-1-1 bar (GB/T 5231-2012) and the SLM Cu-15Sn samples before and after different annealing treatment. The corresponding stress-strain curves and tensile fracture morphologies have been shown in Fig. 10. For the SLM samples, the achieved ultimate tensile strengths (UTS) of ~661 MPa are nearly 50 percent higher than that of the traditional QSn15-1-1 sample (~444 MPa), which can be ascribed to the fine-grain strengthening mechanism. This material strengthening is accompanied by the improvement of ductility with an increase from ~ 6.4 to ~7.4%. Furthermore, the SLM samples demonstrate superior hardness property of ~212 HV 0.3 compared with the traditional QSn15-1-1 bar with a Vickers hardness of ~151 HV 0.3, which has been explained by the grain refinement and residual stresses [27]. It is great interest that there are different hardness properties with a Vickers hardness of about 204 HV 0.3 in cellular crystal region (Fig. 7(b)) from dendrite crystal region (Fig. 7(d)) with a Vickers hardness of about 215 HV 0.3. The corresponding tensile fracture surfaces of the SLM samples (Fig. 10(b, c)) clearly present the cleavage steps, indicating that the fracture mechanisms of the SLM samples are mainly dependent on the brittle fracture. For the annealed SLM samples, it is obvious that the elongations beyond 20
percent are generally much greater than that of SLM samples and increase as the increase of annealing temperature. However, the attendant UTS (~545 MPa) and Vickers hardness (~168 HV 0.3) of the annealed samples are lower than that of SLM samples while still higher than that of QSn15-1-1 bar. These changes in properties can be attributed to the grain coarsening and the decomposition of the intermetallic compound phase as well as the inner stress relieving. The strengthening mechanism have changed from fine-grain strengthening to solution strengthening. The corresponding tensile fracture surfaces of annealed sample at 600 °C for 4 h, as illustrated in Fig. 10(d), exhibit rough surfaces without obvious cleavage steps. A closer observation from Fig. 10(e) displays a large number of shallow dimples like features and partial deep dimples, proving that the ductile fracture mechanism dominates the fracture of the annealed samples. Some inner pores and cracks also can be observed in Fig. 10(b, d) and these defects, as possible crack initiation, affected the ductility during tensile, especially for the SLM sample without any heat treatment.
Table 5
Mechanical properties of both the QSn15-1-1 bar and the SLM Cu-15Sn samples before and after different annealing treatment: ultimate tensile strength (UTS), the yield strength σ0.2, elastic modulus (E), elongation at break (EL) and Vickers hardness (HV 0.3)
Sample UTS
(MPa) σ0.2 (MPa) E (GPa) EL (%) HV 0.3
QSn15-1-1 444±1 256±1 75.6±0.7 6.4±0.1 151±6
SLM Cu-15Sn 661±3 436±3 90.9±2.2 7.4±0.6 212±9
500 °C + 4 h 544±4 328±4 89.1±3.3 20.0±1 173±6
600 °C + 4 h 545±4 328±5 87.8±4.3 21.2±0.8 168±5
Fig. 10. (a) Engineering stress-strain curves of both QSn15-1-1(GB/T 5231-2012) and SLM samples before and after different annealing temperature of 500, 600 and 700 °C for 4 h. SEM images of the tensile fracture surfaces of SLM Cu-15Sn samples (b, c) before and (d, e) after annealing at 600 °C for 4 h.
4. Conclusions
This paper mainly involves the optimisation of processing parameters (laser power, scanning speed and hath space) for high-tin bronze (Cu-15Sn) in SLM using an experimental approach, the investigation of the corresponding microstructures and mechanical properties before and after annealing at different temperature. The following conclusions can be drawn:
(1) Resorting to the RSM design and the ANOVA technique, the statistical relationship between the density and processing parameters has been established and an optimal
processing parameter set of 187 W laser power, 185 mm/s scanning speed and 0.17 mm hatch space has been achieved in SLM for Cu-15Sn bronze. The nearly fully-dense SLM Cu-15Sn samples of 8.886 g/cm3 (~99.6%) have been manufactured for the first time.
(2) During the SLM process of prealloyed Cu-15Sn powder, the rapid cooling gave rise to the significant refinement of the microstructure. The characteristic microstructures with two kinds of different refined grain structures containing dendrite and cellular structures were formed due to the particular scanning strategy in SLM, causing the different hardness property with the Vickers hardness of ~215 and 204 HV 0.3, respectively.
(3) The preferred growth of the grains in the remelting areas contributes the characteristic of epitaxial growth along the building direction. Furthermore, this feature is still observed after annealing though the microstructures and the grains have become more homogeneous and coarser.
(4) Thanks to the characteristic fine-grain microstructures, the mechanical properties of SLM samples such as the UTS of ~661 MPa and the yield strength of ~436 MPa had a significantly improvement compared with the traditional QSn15-1-1 samples. The annealing processing could significantly increase the elongation of the SLM sample to >20% while decreasing the UTS to ~545 Mpa that was still higher than that of QSn15-1-1 samples, which means that the strengthening mechanism of Cu-15Sn bronze has transformed from the refine grain strengthening to the solid solution strengthening.
Acknowledgements
The authors acknowledge the National High-tech Research and Development Program of China (863 Program: 2015AA042501) for financial support of this work.
References
[1] J.S. Park, C.W. Park, K.J. Lee, Implication of peritectic composition in historical high-tin bronze metallurgy Mater. Charact. 60 (2009) 1268-1275.
[2] S. Scudino, C. Unterdörfer, K.G. Prashanth, H. Attar, N. Ellendt, V. Uhlenwinkel, J. Eckert, Additive manufacturing of Cu–10Sn bronze Mater. Lett. 156 (2015) 202-204.
[3] F.C. Walsh, C.T.J. Low, A review of developments in the electrodeposition of tin-copper alloys Surf. Coat. Technol. 304 (2016) 246-262.
[4] G.M. Ingo, T. de Caro, C. Riccucci, E. Angelini, S. Grassini, S. Balbi, P. Bernardini, D. Salvi, L. Bousselmi, A. Çilingiroglu, M. Gener, V.K. Gouda, O. Al Jarrah, S. Khosroff, Z. Mahdjoub, Z. Al Saad, W. El-Saddik, P. Vassiliou, Large scale investigation of chemical composition, structure and corrosion mechanism of bronze archeological artefacts from Mediterranean basin Appl. Phys. A 83 (2006) 513-520. [5] C. Chiavari, A. Colledan, A. Frignani, G. Brunoro, Corrosion evaluation of traditional and new bronzes for artistic castings Mater. Chem. Phys. 95 (2006) 252-259.
[6] A. Tavakoli, R. Liu, X.J. Wu, Improved mechanical and tribological properties of tin–bronze journal bearing materials with newly developed tribaloy alloy additive Mater. Sci. Eng., A 489 (2008) 389-402. [7] X. Chen, Z. Wang, D. Ding, H. Tang, L. Qiu, X. Luo, G. Shi, Strengthening and toughening strategies for tin bronze alloy through fabricating in-situ nanostructured grains Mater. Des. 66 (2015) 60-66. [8] S. Alam, R.I. Marshall, S. Sasaki, Metallurgical and tribological investigations of aluminium bronze
bushes made by a novel centrifugal casting technique Tribol. Int. 29 (1996) 487-492.
[9] K. Chen, X. Chen, D. Ding, Z. Wang, Effect of in-situ nanoparticle wall on inhibiting segregation of tin bronze alloy Mater. Lett. 175 (2016) 148-151.
[10] A. Sabahi Namini, M. Azadbeh, A. Mohammadzadeh, S. Shadpour, Liquid Phase Sintering of Leaded Tin Bronze Alloyed Powder T. Indian, I, Metals 69 (2015) 1377-1388.
[11] D. Gu, Y. Shen, X. Wu, Formation of a novel W-rim/Cu-core structure during direct laser sintering of W–Cu composite system Mater. Lett. 62 (2008) 1765-1768.
[12] D. Gu, Y. Shen, Z. Lu, Microstructural characteristics and formation mechanism of direct laser-sintered Cu-based alloys reinforced with Ni particles Mater. Des. 30 (2009) 2099-2107.
[13] D.D. Gu, W. Meiners, K. Wissenbach, R. Poprawe, Laser additive manufacturing of metallic components: materials, processes and mechanisms Int. Mater. Rev. 57 (2013) 133-164.
[14] L. Thijs, F. Verhaeghe, T. Craeghs, J. Van Humbeeck, J.P. Kruth, A study of the micro structural evolution during selective laser melting of Ti-6Al-4V Acta Mater. 58 (2010) 3303-3312.
[15] C.Y. Yap, C.K. Chua, Z.L. Dong, Z.H. Liu, D.Q. Zhang, L.E. Loh, S.L. Sing, Review of selective laser melting: Materials and applications Appl. Phys. Rev 2 (2015).
[16] A. Popovich, V. Sufiiarov, I. Polozov, E. Borisov, D. Masaylo, A. Orlov, Microstructure and mechanical properties of additive manufactured copper alloy Mater. Lett. 179 (2016) 38-41.
[17] A.P. Ventura, C.A. Wade, G. Pawlikowski, M. Bayes, M. Watanabe, W.Z. Misiolek, Mechanical Properties and Microstructural Characterization of Cu-4.3 Pct Sn Fabricated by Selective Laser Melting Metallurgical and Materials Transactions A 48 (2016) 178-187.
[18] Z. Mao, D. Zhang, P. Wei, K. Zhang, Manufacturing Feasibility and Forming Properties of Cu-4Sn in Selective Laser Melting Materials 10 (2017) 333.
[19] R. Li, Y. Shi, J. Liu, Z. Xie, Z. Wang, Selective laser melting W–10 wt.% Cu composite powders Int. J. Adv. Manuf. Technol. 48 (2009) 597-605.
[20] A. Yan, Z. Wang, T. Yang, Y. Wang, Z. Ma, Microstructure, thermal physical property and surface morphology of W-Cu composite fabricated via selective laser melting Mater. Des. 109 (2016) 79-87. [21] N. Read, W. Wang, K. Essa, M.M. Attallah, Selective laser melting of AlSi10Mg alloy: Process optimisation and mechanical properties development Mater. Des. 65 (2015) 417–424.
[22] P.B. Bacchewar, S.K. Singhal, P.M. Pandey, Statistical modelling and optimisation of surface roughness in the selective laser sintering process Proceedings of the Institution of Mechanical Engineers, Part B: Journal of Engineering Manufacture 221 (2007) 35-52.
[23] I. Yadroitsev, I. Yadroitsava, P. Bertrand, I. Smurov, Factor analysis of selective laser melting process parameters and geometrical characteristics of synthesized single tracks Rapid Prototyping Journal 18 (2012) 201-208.
[24] G.W. Oehlert, A first course in design and analysis of experiments, Kluwer Academic Publishers, New York, 2010.
[25] Y. Zhou, S.F. Wen, B. Song, X. Zhou, Q. Teng, Q.S. Wei, Y.S. Shi, A novel titanium alloy manufactured by selective laser melting: Microstructure, high temperature oxidation resistance Mater. Des. 89 (2016) 1199-1204.
[26] D. Gu, Y. Shen, Balling phenomena in direct laser sintering of stainless steel powder: Metallurgical mechanisms and control methods Mater. Des. 30 (2009) 2903-2910.
[27] D.D. Gu, Y.C. Hagedorn, W. Meiners, G.B. Meng, R.J.S. Batista, K. Wissenbach, R. Poprawe, Densification behavior, microstructure evolution, and wear performance of selective laser melting
processed commercially pure titanium Acta Mater. 60 (2012) 3849-3860.
[28] N. Saunders, A.P. Miodownik, The Cu-Sn (Copper-Tin) system Bulletin of Alloy Phase Diagrams 11 (1990) 278-287.
[29] A. Paulin, S. Spaić, A. Zalar, N. Orel-Trampuž, Metallographic analysis of 3000-year-old Kanalski Vrh hoard pendant Mater. Charact. 51 (2003) 205-218.
[30] D.D. Gu, Y.F. Shen, Development and characterisation of direct laser sintering multicomponent Cu based metal powder Powder Metall. 49 (2013) 258-264.
[31] Z.-J. Wang, K.J. Toyohiko, C.-L. Ma, Comparative TEM investigation on the precipitation behaviors in Cu–15wt%Sn alloy Rare Metals 32 (2013) 139-143.
[32] H. Zhang, H. Zhu, T. Qi, Z. Hu, X. Zeng, Selective laser melting of high strength Al–Cu–Mg alloys: Processing, microstructure and mechanical properties Mater. Sci. Eng., A 656 (2016) 47-54.
[33] B. Vrancken, L. Thijs, J.P. Kruth, J. Van Humbeeck, Microstructure and mechanical properties of a novel beta titanium metallic composite by selective laser melting Acta Mater. 68 (2014) 150-158.
[34] M.E. Glicksman, Constitutional Supercooling, in: M.E. Glicksman (Ed.) Principles of Solidification, Springer, New York, NY, 2011, pp. 213-235.
[35] X. Zhou, K.L. Li, D.D. Zhang, X.H. Liu, J. Ma, W. Liu, Z.J. Shen, Textures formed in a CoCrMo alloy by selective laser melting J. Alloys Compd. 631 (2015) 153-164.
[36] L. Thijs, K. Kempen, J.P. Kruth, J. Van Humbeeck, Fine-structured aluminium products with controllable texture by selective laser melting of pre-alloyed AlSi10Mg powder Acta Mater. 61 (2013) 1809-1819.
[37] L. Thijs, M.L. Montero Sistiaga, R. Wauthle, Q. Xie, J.-P. Kruth, J. Van Humbeeck, Strong morphological and crystallographic texture and resulting yield strength anisotropy in selective laser melted tantalum Acta Mater. 61 (2013) 4657-4668.
[38] S. Dadbakhsh, B. Vrancken, J.P. Kruth, J. Luyten, J. Van Humbeeck, Texture and anisotropy in selective laser melting of NiTi alloy Mater. Sci. Eng., A 650 (2016) 225-232.