Genetic Programming for
Biomarker Detection in
Classification of Mass
Spectrometry Data
bySoha Ahmed
A thesissubmitted to the Victoria University of Wellington in fulfilment of the
requirements for the degree of Doctor of Philosophy in Computer Science.
Victoria University of Wellington 2015
Abstract
Mass spectrometry (MS) is currently the most commonly used technology in biochemical research for proteomic analysis. The primary goal of pro-teomic profiling using mass spectrometry is the classification of samples from different experimental states. To classify the MS samples, the iden-tification of protein or peptides (biomarker detection) that are expressed differently between the classes, is required.
However, due to the high dimensionality of the data and the small number of samples, classification of MS data is extremely challenging. Another important aspect of biomarker detection is the verification of the detected biomarker that acts as an intermediate step before passing these biomarkers to the experimental validation stage.
Biomarker detection aims at altering the input space of the learning algorithm for improving classification of proteomic or metabolomic data. This task is performed through feature manipulation.
Feature manipulation consists of three aspects: feature ranking, fea-ture selection, and feafea-ture construction. Genetic programming (GP) is an evolutionary computation algorithm that has the intrinsic capability for the three aspects of feature manipulation. The ability of GP for feature manipulation in proteomic biomarker discovery has not been fully inves-tigated. This thesis, therefore, proposes an embedded methodology for these three aspects of feature manipulation in high dimensional MS data using GP. The thesis also presents a method for biomarker verification, us-ing GP. The thesis investigates the use of GP for both sus-ingle-objective and multi-objective feature selection and construction.
In feature ranking, the thesis proposes a GP-based method for ranking subsets of features by using GP as an ensemble approach. The proposed
ture ranking metrics and evolve a new ranking scheme for the subset of the features selected from the top ranked features. The capability of GP as a classifier is also investigated by this method. The results show that GP can select a smaller number of features and provide a better ranking of the selected features, which can improve the classification performance of five classifiers.
In feature construction, this thesis proposes a novel multiple feature construction method, which uses a single GP tree to generate a new set of high-level features from the original set of selected features. The results show that the proposed new algorithm outperforms two feature selection algorithms.
In feature selection, the thesis introduces the first GP multi-objective method for biomarker detection, which simultaneously increase the clas-sification accuracy and reduce the number of detected features. The pro-posed multi-objective method can obtain better subsets of features than the single-objective algorithm and two traditional multi-objective approaches for feature selection. This thesis also develops the first multi-objective multiple feature construction algorithm for MS data. The proposed method aims at both maximising the classification performance and minimizing the cardinality of the constructed new high-level features. The results show that GP can dis- cover the complex relationships between the fea-tures and can significantly improve classification performance and reduce the cardinality.
For biomarker verification, the thesis proposes the first GP biomarker verification method through measuring the peptide detectability. The method solves the imbalance problem in the data and shows improvement over the benchmark algorithms. Also, the algorithm outperforms a well-known peptide detection method. The thesis also introduces a new GP method for alignment of MS data as a preprocessing stage, which will further help in improving the biomarker detection process.
Dedication
To my source of inspiration, the greatest and most important love in my life, Hamza, my beloved son.
Acknowledgment
I would like to acknowledge and express my gratitude to everyone who gave me assistance and support during my PhD study.
First of all, my deep thanks and gratitude to my supervisors, Prof.Mengjie Zhang and Dr. Lifeng Peng. Prof. Mengjie Zhang has dedicated his efforts and time to improve my research skills and writing, providing me with his precious feedback on every detail in my work. Dr. Lifeng Peng provided a lot of support and helped improve my biological background through the interesting discussions we had in the Mass Spectrometry lab. I am also grateful to her for helping me improve my research writing skills. I must also thank and acknowledge my colleague and dear friend Dr. Bing Xue, who helped me a lot by providing feedback on my research papers and thesis.
I als o want to acknowledge the Victoria Doctoral Scholarship, the Mars-den Fund of New Zealand (VUW0806), as well as the School of Engineer-ing and Computer Science and Faculty of EngineerEngineer-ing at Victoria Univer-sity of Wellington for their financial support over the past three years. I wish to thank my friends in the Evolutionary Computation Research Group (ECRG), who made a creative and cooperative research environ-ment. Last but not least, I wish to thank my family especially, my husband, my parents and sister for their love, encouragement and support.
A List of Publications
1. Soha Ahmed, Mengjie Zhang, Lifeng Peng: Improving feature rank-ing for biomarker discovery in proteomics mass spectrometry data using genetic programming. Connect. Sci. 26(3): 215-243, 2014
2. Soha Ahmed, Mengjie Zhang, Lifeng Peng: Measuring Peptide De-tectability in LC-MS Data using Genetic Programming. Submitted to Natural Computing. Under review.
3. Soha Ahmed, Mengjie Zhang, Lifeng Peng, Bing Xue: Multiple fea-ture construction for effective biomarker identification and classi-fication using genetic programming. Proceedings of the 23rd Ge-netic and Evolutionary Computation Conference (GECCO), Vancou-ver, BC, Canada, 2014: 249-256.
4. Soha Ahmed, Mengjie Zhang, Lifeng Peng: Prediction of detectable peptides in MS data using genetic programming. Proceedings of the 23rd Genetic and Evolutionary Computation Conference (GECCO Companion) , Vancouver, BC, Canada, 2014: 37-38.
5. Soha Ahmed, Mengjie Zhang, Lifeng Peng: A New GP-based Wrap-per Feature Construction Approach to Classification and Biomarker Identification. Proceedings of IEEE Congress on Evolutionary Com-putation 2014, Beijin, China, 2756-2763
6. Soha Ahmed, Mengjie Zhang, Lifeng Peng: A Genetic Programming Based Approach to Multiple Alignment of Liquid
Mass Spectrometry.Proceedings of the 12th European Conference on Evolutionary Computation, Machine Learning and Data Mining in Computational Biology, EvoApplications (EvoBIO), Lecture Notes in Computer Science. Granada, Spain, 2014: 915-927
7. Soha Ahmed, Mengjie Zhang, Lifeng Peng, Bing Xue: Genetic Pro-gramming for Measuring Peptide Detectability. SEAL 2014: 593-604
8. Soha Ahmed, Mengjie Zhang, Lifeng Peng: Enhanced feature selec-tion for biomarker discovery in LC-MS data using GP. Proceeding of the IEEE Congress on Evolutionary Computation, Cancun, Maxico, 2013: 584-591.
9. Soha Ahmed, Mengjie Zhang, Lifeng Peng: Feature Selection and Classification of High Dimensional Mass Spectrometry Data: A Ge-netic Programming Approach. Proceedings of the 11th European Conference on Evolutionary Computation, Machine Learning and Data Mining in Computational Biology (EvoBIO2013), Vienna, Aus-tria, Lecture Notes in Computer Science: 43-55.
10. Soha Ahmed, Mengjie Zhang, Lifeng Peng: Genetic Programming for Biomarker Detection in Mass Spectrometry Data. Proceedings of the 25th Australasian Conference on Artificial Intelligence, Sydney, Australia 2012: 266-278.
Contents
List of Tables 18 List of Figures 20 1 Introduction 1 1.1 Problem Statement . . . 1 1.2 Motivations . . . 5 1.2.1 Why GP . . . 51.2.2 Limitations of Existing Approaches . . . 6
1.3 Goals . . . 6
1.4 Major Contributions of the Thesis . . . 9
1.5 Organisation of the Thesis . . . 13
1.6 Benchmark Datasets for Evaluation . . . 15
2 Literature Review 19 2.1 Mass Spectrometry . . . 19
2.1.1 Proteins and Peptide . . . 21
2.1.2 Metabolome and Metabolite . . . 22
2.1.3 Mass Spectrometry-Based Proteomics . . . 22
2.1.4 Mass Spectrometry-Based Metabolomics . . . 23
2.1.5 MS Research Directions . . . 23
2.1.6 Biomarkers . . . 25
2.1.7 Mass Spectrometer . . . 26
ionisation techniques . . . 27
Mass analysers . . . 28
Detectors . . . 29
2.1.8 MS Data Analysis . . . 29
2.2 Machine Learning . . . 31
2.2.1 Classification algorithms . . . 32
Tree-based Classification algorithms . . . 32
Non-tree-based Classification algorithms . . . 32
2.2.2 Feature Manipulation . . . 33 Wrapper Approach . . . 33 Filter Approach . . . 34 Embedded Approach . . . 34 2.3 Evolutionary Computation . . . 35 2.3.1 Genetic Algorithms . . . 36
2.3.2 Particle Swarm Optimisation . . . 36
2.3.3 Ant Colony Optimisation . . . 36
2.3.4 Genetic Programming (GP) . . . 37
Program Representation . . . 37
Initialisation of the Population . . . 38
Evaluation of Individuals . . . 39
Selection of Individuals . . . 39
Genetic Operators . . . 40
2.4 Multi-objective Optimisation . . . 41
2.4.1 Common Multi-objective Optimisation Techniques . 42 2.5 Related Work . . . 44
2.5.1 Statistics and Machine Learning for Biomarker De-tection on MS data . . . 45
2.5.2 GP for Biomarker Detection using Feature Selection . 47 2.5.3 GP for Feature Construction . . . 48
2.5.4 Other Evolutionary Algorithms for Biomarker De-tection . . . 49
CONTENTS 11
2.5.6 Peptide Detection for Biomarker Verification . . . 51
2.6 Chapter Summary . . . 52
3 Ensemble Feature Ranking 55 3.1 Introduction . . . 55
3.1.1 Chapter Goals . . . 55
3.2 Ensemble Feature Ranking GP Algorithm . . . 56
3.2.1 Overall Process . . . 57
3.2.2 Feature Selection Metrics . . . 60
3.2.3 Fitness Measure . . . 61
3.2.4 Description of the Algorithm . . . 62
3.3 Experiments Design and Setup . . . 64
3.3.1 GP Settings . . . 64
3.4 Datasets and Preprocessing . . . 65
3.4.1 Datasets . . . 65
3.4.2 Data Preprocessing . . . 68
3.5 Results and Discussions . . . 73
3.5.1 GP Feature Selection and Classification Performance 74 3.5.2 Using GP Features With Other Classifiers . . . 77
3.5.3 Biomarker Detection . . . 79
3.6 Further Discussions . . . 81
3.6.1 The 20 top ranked features from the proposed GP method, IG and RF using GP classifier . . . 81
3.6.2 The 20 top ranked features from the proposed GP method, IG and RF, using other classifiers . . . 82
3.6.3 The proposed GP method compared to GA . . . 85
3.6.4 Overlap between top-ranked features . . . 87
3.7 Chapter Summary . . . 88
4 Multiple Feature Construction 91 4.1 Introduction . . . 91
4.2 GP for Construction of Multiple Features . . . 93
4.2.1 Algorithm Description . . . 93
4.2.2 New Fitness Function . . . 96
4.3 Experiment Setup . . . 97
4.3.1 Datasets and Preprocessing . . . 97
4.3.2 GP Settings . . . 100
4.3.3 Benchmark Classification Algorithms . . . 101
4.3.4 Comparison Methods . . . 102
4.4 Results and Discussions . . . 103
4.4.1 Comparison of the Constructed Features with All the Original Features . . . 103
4.4.2 Comparison of the New Constructed Features with the Low-Level Selected Features . . . 105
4.4.3 Biomarker Identification . . . 107
4.5 Chapter Summary . . . 109
5 Multi-Objective Feature Manipulation 111 5.1 Introduction . . . 111
5.1.1 Chapter Goals . . . 112
5.2 The GP Multi-objective Feature Selection Approach . . . 113
5.2.1 Pareto Fitness Schemes in N S-GP M OF S and SP -GP M OF S . . . 114
5.2.2 Crowding Distance Measure . . . 114
5.2.3 N S-GP M OF SandSP-GP M OF S Algorithms . . . 115
5.3 The GP Multi-objective Feature Construction Approach . . . 117
5.3.1 SP-GP M OF C andN S-GP M OF C Algorithm . . . . 117
5.4 Overview of the Two Systems . . . 117
5.4.1 Fitness Function . . . 119
5.5 Experiments Design and Settings . . . 120
5.5.1 MS Datasets . . . 120
CONTENTS 13
5.5.3 Genetic Operators and Parameters . . . 122
5.5.4 Benchmark Algorithms . . . 124
5.6 Results and Discussions . . . 125
5.6.1 Performance ofGP M OF S . . . 125
5.6.2 Comparison ofGP M OF SandGP M OF C . . . 126
5.6.3 Comparison ofGP M OF Cto single objective GP, SPEA2 and NSGAII approaches . . . 131
5.6.4 GP M OF C vs single objective GP for feature con-struction . . . 132 5.6.5 Biomarker Detection . . . 132 5.7 Chapter Summary . . . 133 6 Biomarker Verification 135 6.1 Introduction . . . 135 6.1.1 Chapter Goals . . . 136
6.2 GP for Measuring Peptide Detectability . . . 137
6.2.1 Method Overview . . . 137
6.2.2 Feature Vectors . . . 139
6.2.3 Fitness Measure for Unbalanced Peptide Data . . . . 139
6.2.4 Evolving Peptide Detectability Models . . . 141
6.2.5 Selecting Important Properties . . . 142
6.2.6 Summary of the Algorithm . . . 142
6.3 Design of Experiments . . . 143
6.3.1 Peptide Datasets . . . 146
Dataset 1 (DS1) . . . 146
Sample Collection and Preparation . . . 146
Peptide and protein identification . . . 146
Dataset 2 (DS2) and Dataset 3 (DS3) . . . 147
6.3.2 Program Representation . . . 148
6.3.3 GP Parameters . . . 149
6.3.5 Methods for Comparison . . . 150
Classifier learning Methods . . . 151
Feature Selection Methods . . . 152
6.4 Results and Discussions . . . 153
6.4.1 Classification Results . . . 153
6.4.2 Feature Selection Results . . . 154
GP-selected features vs. all features . . . 157
6.5 Further Discussions . . . 158
6.5.1 Comparison after Data Resampling . . . 158
6.5.2 Comparison to ESP-Predictor . . . 160
Complexity of the Evolved Models . . . 161
6.5.3 Important Properties for Detectability . . . 163
6.6 Biomarker Verification Steps . . . 164
6.7 Chapter Summary . . . 165
7 GP for Multiple Alignment of MS data 167 7.1 Introduction . . . 167
7.1.1 Chapter goals . . . 167
7.2 Background . . . 168
7.3 The new GP Alignment algorithm . . . 170
7.3.1 Peak Matching . . . 171
7.3.2 GP Multi-Branch Regression for Multiple Alignment 173 7.3.3 Terminal and Function Sets . . . 174
7.3.4 Fitness Function . . . 175
7.4 Experiments Design . . . 175
7.4.1 Datasets . . . 175
7.4.2 Genetic Operators and Parameters . . . 177
7.4.3 Benchmark Algorithms . . . 177
7.4.4 Performance Evaluation . . . 179
7.5 Results and Discussions . . . 179
CONTENTS 15
7.5.2 Efficiency Performance . . . 182
7.5.3 Interpretation of the Evolved Regression Models . . . 182
7.6 Chapter Summary . . . 184
8 Conclusions 187 8.1 Introduction . . . 187
8.2 Achieved Objectives . . . 188
8.3 Main Conclusions . . . 191
8.3.1 Ensemble and Ranking of Features Mechanisms in GP 191 Ensemble feature selection mechanism in the GP em-bedded approach . . . 192
Ranking mechanism in GP . . . 192
Generality of embedded approach . . . 193
8.3.2 Single objective Multiple Feature Construction . . . . 193
8.3.3 Multi-objective Feature Manipulation . . . 193
Multi-objective Feature Selection . . . 194
Multi-objective Feature Construction . . . 194
8.3.4 Biomarker Verification . . . 194
8.4 Future Directions . . . 195
8.4.1 Single Objective GP for Feature Construction . . . 195
8.4.2 Building a multi-class GP classification system for MS data . . . 195
8.4.3 GP for Quantification of Proteins and Peptides . . . . 195
8.4.4 GP for discovering the Pathways of the Diseased Metabo-lites . . . 196
8.4.5 GP for Alignment and Peak Extraction in MS data . . 196
8.4.6 GP for Feature Selection in Unbalanced data . . . 196
8.4.7 Further Selection from Multiple Solutions . . . 197
8.4.8 Verification and Experimental Validation of the De-tected Biomarkers . . . 197
List of Tables
1.1 limitations of the Existing Approaches . . . 7
1.2 Benchmark MS Datasets . . . 17
3.1 GP settings . . . 65
3.2 Experimental Results . . . 75
3.3 Classification performance for the tasks using NB, J48, Ran-dom Forest and SVMs classifiers . . . 78
3.4 The performance of top 20 features selected by the GP method compared to the top 20 features by IG and RF with GP clas-sifier. . . 83
3.5 Classification performance of 20 features using NB and J48, random forest, and SVMs classifiers. . . 84
3.6 Comparison between IGRF-GP and GA . . . 86
3.7 Percentage of overlap of the top 100 features of IG and RF. . 87
3.8 Percentage of overlap of the top 20 features across the 30 runs. 87 4.1 Datasets characteristics . . . 98
4.2 GP settings . . . 100
4.3 Results of using the constructed, selected and original set of features with seven classifiers. . . 104
4.4 Identified spike-in biomarkers by the proposed GP method and Method1 for the Apple datasets. The biomarkers are identified using their m/z values. . . 108
5.1 Summary of the Datasets . . . 120
5.2 Preprocessing running parameters . . . 123
5.3 GP running parameters . . . 124
5.4 Identified spike-in biomarkers bySP-GP M OF S,N S-GP M OF S, SP EA2andN SGAII . . . 133
6.1 Datasets . . . 148
6.2 Function Set . . . 149
6.3 GP evolutionary parameters . . . 150
6.4 Classification results ofP EP-GP and other classifiers. . . . 155
6.5 Feature Selection Results . . . 156
6.6 Classification results of P EP-GP and other classifiers after resampling of the data. . . 159
6.7 Important properties for peptide detectability . . . 164
7.1 Datasets used in the approach . . . 176
7.2 GP parameters . . . 178
7.3 Proteomics datasetP1alignment results . . . 181
7.4 Metabolomics datasetsM1 andM2alignment results . . . 181
7.5 Comparison of run time of GPMS with other approaches (in seconds) . . . 182
7.6 (a) An evolved model for fraction (00) with some examples of inputs and outputs of the model. (b) An evolved model for fraction (100). . . 183
List of Figures
1.1 Stages of the biomarker identification process . . . 3
1.2 Overview of the major contributions . . . 14
2.1 Mass Spectrum example [95] . . . 20
2.2 General schema showing the relationships starting from Genome to Metabolome. Image published under free document li-cense in the Wikipedia (http://www.wikipedia.com). . . 23
2.3 Mass spectrometer structure [167]. . . 26
2.4 Electrospray ionisation (ESI) schematics [58]. . . 27
2.5 A GP Example that represents the program (A*B)+C. . . 37
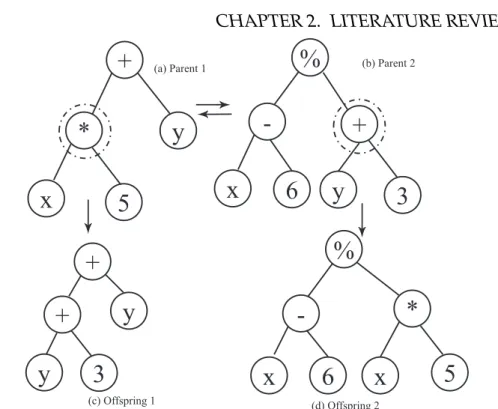
2.6 Subtree Crossover. (a) and (b) are the parents where the highlighted node is the randomly selected node and the subtree rooted from it is switched with the other subtree to form the two offspring in (c) and (d). . . 40
2.7 Subtree Mutation. . . 40
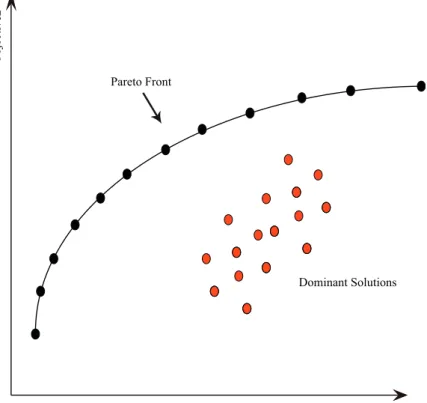
2.8 Pareto dominance example . . . 43
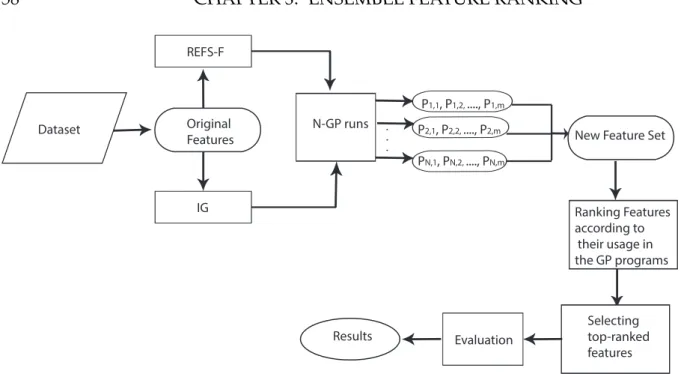
3.1 Overview of the GP-based approach. . . 58
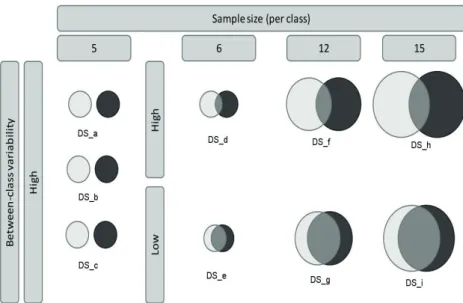
3.2 Properties of the LC-MS datasets used in the experiments. . 68
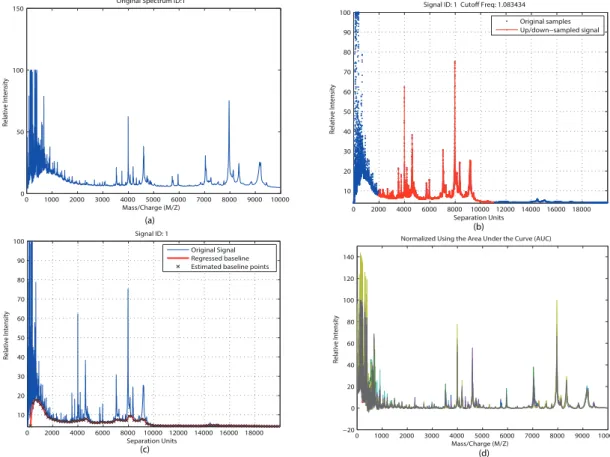
3.3 Preprocessing steps of the low-resolution ovarian cancer dataset. (a) the original spectrum. (b) the baseline adjustment of the first signal. (c) resampling of this signal. (d) normalisation of the samples using AUC. . . 69
3.4 An example of the alignment of 10 spectra of the low-resolution
ovarian cancer dataset. . . 70
3.5 Preprocessing of the raw data spectrum ofDSadataset. (a)
The original raw spectrum. (b) Peak extraction step. (c)
Alignment step (d) Filtering step. . . 72
3.6 Biomarker detection of the proposed method in comparison
with IG and RF. . . 80
4.1 Overview of the GP-multiple feature construction system. . 95
4.2 Example of how the features are constructed. . . 96
4.3 Biomarker detection approach. . . 107
5.1 General overview of the multi-objective approaches . . . 119
5.2 Figure 5.2: Experimental Results forGP M OF S . . . 128
5.4 Figure 5.3: Experimental Results forGP M OF C . . . 130
6.1 Data generation . . . 138
6.2 The GP peptide detection system . . . 140
6.3 Comparison ofP EP-GP with ESP-Predictor . . . 161
6.4 Average complexity per generation ofP EP-GP vs.
Baseline-GP . . . 162
7.1 Overview of the alignment approach. . . 172
Chapter 1
Introduction
This chapter introduces the thesis and includes the problem statement, the motivations, the research goals, the major contributions, and, finally, the organisation of the thesis.
1.1
Problem Statement
Nowadays, mass spectrometry (MS) has become the most dominant tech-nique for high-throughput analysis of proteomes and metabolomes [169]. The main task of MS data analysis is the classification of samples from different classes.
Classification of MS data from control and treated biological samples can lead to the identification of features (biomarkers), which can predict a specific experimental status. The set of detected features provide informa-tion about the effect of therapy or lead to describe new molecular targets for therapeutics [47]. To detect the biomarkers, the obtained MS profile must be analysed through several computational methods.
The mass spectrometer produces spectra datasets, where each spec-trum consists of tens of thousands of features, which create a large feature space for classification [173]. Another issue is the small number of sam-ples generated by the mass spectrometer due to cost and time constraints.
These factors make biomarker detection in MS data (identification of fea-tures for classification) extremely challenging [182].
The spectrum is also interrupted by different kinds of noises during the stages of analysis in the mass spectrometer, which results in reduc-ing the quality of the data. Due to the noise introduced to the MS data spectra, a preprocessing framework must take place. The selection of the preprocessing steps and parameters can also affect the biomarker detec-tion process [142]. In addidetec-tion to the previously mendetec-tioned challenges in MS data, the biomarkers sometimes appear at a low abundance that intro-duces another difficulty in the selection of the correct proteins that can be defined as the biomarkers.
After the biomarker detection, the biomarkers pass through two other stages which are shown in Figure 1.1. The detection stage produces the possible list of biomarkers, which then pass to verification through mea-suring their detection probability in the mass spectrometer. Finally, the verified biomarkers pass to the experimental validation that involves test-ing these biomarkers laboratory. The first two stages of biomarker iden-tification (feature manipulation and biomarker verification) are tackled in this thesis. However, the experimental validation is beyond of the scope of this research.
Underlying computational problems: The compuational problems here are firstly the large number of features. This introduces the problem of curse of dimensionality which represents a major obstacle for classifica-tion. Generally, in feature manipulation, the search space increases
expo-nentially according to the number of features(2n subsets of features if the
number of features is n) [110]. In case of thousands of features, it is
im-possible to exhaustively search all subsets of features which form the can-didate solutions. Secondly, the small number of training examples which makes the search for the relevant features more difficult [178]. Thirdly, for verification, the class imbalance problem of the data which makes the
1.1. PROBLEM STATEMENT 3
Detection
Verification
(Prediction of detectable peptides) (Feature Manipulation)Experimental
Validation
Figure 1.1: Stages of the biomarker identification process
performance more the bias to the majority class, and hence, the features selected or constructed will also be biased to the majority class [70].
Meanwhile, most of biomarker detection methods produce a long list of biomarkers, and it is impractical to send all of them for experimental validation. Intermediate verification of biomarkers can reduce the num-ber of biomarkers for experimental validation, and thus reduce the cost. Biomarker verification of proteomics MS data can be performed through the prediction of their detectability in the mass spectrometer, which can be done through linking the peptide detectability to their physiochemical properties. However, peptide detection is not an easy task either because of the imbalance problem of the data (i.e. the number of detected peptides in the observed class is very small compared to the number of peptides in the non-observed class). The imbalance problem makes building a predic-tive model for peptide detection a challenging problem.
Feature manipulation can help to solve the biomarker detection prob-lem [8]. It provides a means to transform the representation of the in-put to a classification algorithm to improve its performance [106]. Feature
manipulation consists of feature selection and feature construction. Feature
manipulationis particularly useful in solving the problem ofthe curse of di-mensionality, which causes the degradation of the performance of the
clas-sification algorithm.Feature ranking, which is a branch of feature selection,
involves weighing individual features according to their relevance to the
classification task [18]. Feature selection directly eliminates non-relevant
and redundant features of the problem [117]. Neither feature ranking nor
high-level features as functions of the original features to enhance the quality of representation [63].
Feature manipulation can be performed as filter, wrapper or embedded approaches [117]. In filter approaches, information based evaluation is typically used to measure the goodness of the features [106]. In wrapper approaches, a classification algorithm is wrapped to the system to evaluate the features. In the embedded approaches, the classification algorithm is itself the feature selection method, i.e. the feature manipulation and the classifier training process are combined into a single process [123].
Feature manipulation of the high dimensional MS data is a hard task due to the large search space and the small number of samples. Many ma-chine learning approaches have been proposed to solve feature selection and ranking in MS data [148, 156]. However, most of these approaches depend on the univariant feature selection measure, such as formal statis-tical tests (t-test) or independent feature ranking. The individual ranking or selection of features obviously neglects the relationships between the features [31, 104, 162, 188].
Also, very few works on biomarker detection consider feature con-struction to improve the performance of classification. Furthermore, ver-ification of the detected biomarkers, using their peptide detectability, has not been considered to date.
Genetic programming (GP) is an evolutionary algorithm [92] which can build programs and functions dynamically. The programs built by GP range from mathematical expressions to classification models, and, GP can therefore be flexible in searching the complex solution space. GP has the potential to deal effectively with the challenges in MS data. However, there has been little work using GP for MS biomarker detection.
1.2. MOTIVATIONS 5
1.2
Motivations
The MS technology effectively performs the analysis and characterization of alterations in proteins and metabolites. It offers the possibility of discov-ering novel biomarkers through the use of machine learning approaches to analyse the data [120].
Biomarker detection is a difficult problem, especially when the num-ber of features is large, thus increasing the search space exponentially [25]. Most of the benchmark biomarker detection paradigms depend on the in-dividual feature evaluation (single feature ranking). The inin-dividual evalu-ation introduces a set of redundant features which, when they are working together, often degrade the classification performance.
The filter approach for feature selection might introduce redundancy to the features. Despite the better performance of the wrapper approaches, they require high computational cost and can lack generalisability to clas-sifiers other than the wrapped classifier used for evaluation. The embed-ded approach has the potential to avoid the disadvantages of a filter and wrapper approaches as it is not computationally intensive like the wrper approach, and also can provide better wrperformance than the filter ap-proach [106].
1.2.1
Why GP
GP is an effective evolutionary global search algorithm [85]. The most common form of GP is a tree-based representation that offers great po-tential for biomarker detection through feature manipulation. The major reasons are presented as follows.
• GP has an automatic and intrinsic feature manipulation capability as
a part of the evolutionary process for building a classification model. Therefore, it acts as an embedded approach [178].
– For feature selection, the individuals of GP consist of functions, variable terminals and constant terminals. The variable termi-nals correspond to the features of the dataset. These individuals vary in size and not all the features appear in the individuals, which make the selection of features intrinsically in GP [92].
– For feature ranking, in the variable-length individuals, some
features appear more than once, which gives a weighing factor to the more frequent features.
– For feature construction, the features can be combined through
the mathematical operators by means of individual codification, which constructs a high-level feature automatically [124].
• GP as an evolutionary technique has the potential to search huge
spaces for optimal or near optimal solutions, unlike some existing techniques that are often trapped in local optima (e.g. Hill climbing) [92].
1.2.2
Limitations of Existing Approaches
The limitations of the existing approaches for MS biomarker detection are summarised in Table 1.1.
1.3
Goals
The overall goal of this thesis is to develop a new embedded GP approach to biomarker detection and verification in the classification of MS data. To achieve this goal, we investigate the following research objectives.
1. Develop a new GP ensemble approach to feature ranking. The exist-ing approaches depend mostly on an invariant measure to evaluate each feature independently which can result in redundant or irrel-evant features. The proposed algorithm is expected to combine
ad-1.3. GOALS 7
Table 1.1: limitations of the Existing Approaches
using individual feature ranking, which ignores relationships be-tween features [188],
The potential of GP for feature selection or ranking has seldom been investigated for biomarker detection in MS data.
using wrapper approaches which
are computationally
expen-sive, especially with the high-dimensionality of MS data [133],
Using GP in classification problems, as either a filter or wrapper approach for feature ranking, selection and construction, has shown promis-ing performance. However, the use of the em-bedded capability of GP, which can combine both filter and wrapper approaches’ advan-tages, has not been seriously investigated. using principle component
analy-sis or wavelet transformation to transform the data for classifica-tion, which require certain assump-tions and constraints and are lim-ited to specific kinds of tasks [144].
The potential of GP in biomarker detection, particularly in feature construction has not been investigated before.
There is gap between biomarker detection and biomarker verifica-tion
the use of GP for biomarker verification has not been explored before, especially to solve the problem of imbalance in the datasets.
Most previously approaches are single objective
Biomarker detection is a multi-objective prob-lem. The objectives are maximising classifica-tion performance and minimising the number of features used for classification, considering that the detected features must pass an experi-mental validation stage. Experiexperi-mental valida-tion is costly and, careful selecvalida-tion is needed to decide which biomarker will pass through it. However, GP based multi-objective optimi-sation has never been used for MS biomarker detection.
vantages of several feature ranking metrics, select a smaller number of top ranked features, and evolve a better ranking of the features. This objective will be discussed in Chapter 3.
2. Develop a new GP approach to multiple feature construction. Most of the previous GP feature construction approaches are taking a wrap-per approach to constructing a single feature which is insufficient to improve the classification or take a filter approach and use multiple GP trees to develop multiple features equal to the number of classes and this will increase the computational cost. Our approach will con-struct new high-level features by taking an embedded approach, and will use a single GP tree to construct multiple features automatically through the use of the output of different branches of the tree. The proposed approach is expected to discover complex relationships be-tween original features, reduce the number of selected features, and enhance the classification performance. This objective will be dis-cussed in Chapter 4.
3. Develop a new GP embedded approach to feature selection in MS data using multi-objective optimisation. The existing approaches did not consider multiobjective optimisation for MS biomarker de-tection and hence, it is worth investigation. The proposed approach is expected to select subsets of the original features that enhance the classification performance using the intrinsic capability of GP to se-lect features automatically while building the classification model. Meanwhile, the multi-objective method is expected to keep the trade-off between the classification accuracy and the number of features without the prior assumption of the importance of each objective. The set of non-dominated feature subsets is expected to be better than or similar to the SPEA2 [192] and NSGAII [27] approaches for feature selection and the single objective approach. This objective will be discussed in Chapter 5.
1.4. MAJOR CONTRIBUTIONS OF THE THESIS 9 The single objective method feature construction approach proposed in Chapter 4 will be extended to a multi-objective method in that Chapter. The new GP multi-objective algorithm is expected to keep the trade-off between the classification performance and the num-ber of new features. The proposed GP method is evolving a set of Pareto-front non-dominated constructed features which can improve the performance of the classification algorithm.
4. Develop a GP biomarker verification method that will be trained on both yeasts and human serum datasets using the peptides physico-chemical properties as features. This method is intended to bridge the gap between the biomarker detection and the experimental val-idation stages which has not been considered before. The capability of GP to perform unbalanced classification will be used to build the prediction model of the peptide detection problem. The detected biomarkers can be provided as examples in the test set to the system to verify their detectability in the mass spectrometer. This objective will be discussed in Chapter 6.
5. Further investigation on the MS data preprocessing will be performed by developing a new GP approach for multiple alignment of the LC-MS data. The proposed method will help in correcting the distortion in the data and thereby, improve the biomarker detection process. This method is presented in Chapter 7.
1.4
Major Contributions of the Thesis
The thesis makes the following contributions that are summarised in Fig-ure 1.2.
1. The thesis proposes a new embedded-based ensemble feature rank-ing approach by combinrank-ing two feature rankrank-ing metrics. The new
approach considers both the classification performance and the num-ber of features. The proposed method successfully improves the per-formance over using each metric independently by eliminating the redundant features and selecting the most relevant ones. The system also acts as a classifier and proves the capability of GP to outper-form state-of-the-art classifiers. Testing the proposed approach on MS datasets with predefined biomarkers shows that the top ranked features contain most of the predefined biomarkers.
Parts of this contribution have been published in:
Soha Ahmed, Mengjie Zhang, Lifeng Peng: Improving feature rank-ing for biomarker discovery in proteomics mass spectrometry data using genetic programming. Connect. Sci. 26(3): 215-243, 2014. Soha Ahmed, Mengjie Zhang, Lifeng Peng: Feature Selection and Classification of High Dimensional Mass Spectrometry Data: A Ge-netic Programming Approach. Proceedings of the 11th European Conference on Evolutionary Computation, Machine Learning and Data Mining in Computational Biology (EvoBIO2013), Vienna, Aus-tria, Lecture Notes in Computer Science: 43-55, 2013.
Soha Ahmed, Mengjie Zhang, Lifeng Peng: Enhanced feature selec-tion for biomarker discovery in LC-MS data using GP. Proceedings of the IEEE Congress on Evolutionary Computation (CEC2013), Can-cun, Mexico, 584-591 2013.
Soha Ahmed, Mengjie Zhang, Lifeng Peng: Genetic Programming for Biomarker Detection in Mass Spectrometry Data. Proceedings of the 25th Australasian Conference on Artificial Intelligence (AAI2012), Sydney, Australia 2012: 266-278.
2. The thesis proposes a novel multiple feature construction GP sys-tem. The existing feature construction methods can construct ei-ther a single feature or multiple features from multiple independent runs/programs depending on the number of classes. However, the
1.4. MAJOR CONTRIBUTIONS OF THE THESIS 11 proposed algorithm automatically combines original features using the mathematical operations and constructs new multiple high-level features from a single evolved program. The results on several bench-mark datasets show that the proposed algorithm has the potential to create new features, which improve the performance of common classifiers. More investigation of the features selected from the con-struction stage shows that most of the selected features in the GP individuals are the biomarkers predefined by the domain experts. Parts of this contribution are published in:
Soha Ahmed, Mengjie Zhang, Lifeng Peng, Bing Xue: Multiple fea-ture construction for effective biomarker identification and classi-fication using genetic programming. Proceedings of the 23rd Ge-netic and Evolutionary Computation Conference (GECCO), Vancou-ver, BC, Canada, 2014: 249-256.
Soha Ahmed, Mengjie Zhang, Lifeng Peng: A New GP-based Wrap-per Feature Construction Approach to Classification and Biomarker Identification. Proceedings of IEEE Congress on Evolutionary Com-putation 2014, Beijing, China, 2756-2763, 2014.
3. The thesis proposes a new GP-based multi-objective embedded fea-ture selection method for biomarker detection. The system uses GP to find complex relationships between features and classes, and then selects subsets of features based on their discrimination power be-tween different classes. The results show that GP finds more and better relationships between the features more than the conventional methods. The GP multi-objective algorithm uses the ideas of Non-dominated Sorting Genetic Algorithm (NSGA II) [27] and Strength Pareto Evolutionary Algorithm (SPEA2) [192] to maximise the clas-sification accuracy and minimise the cardinality of features. The re-sults show that the embedded approach outperforms the traditional multi-objective methods and the single objective GP approach. This
thesis also proposes the first multi-objective GP feature construction approach for biomarker detection. The system aims at maximising the classification performance and minimising the number of the constructed features simultaneously. The proposed algorithms pro-duce lower number of high-level features that improve the classifi-cation performance on the used benchmark MS problems.
4. This thesis uses GP as a peptide detection method to verify the de-tected biomarkers. The proposed method solves the class imbalance problem in the data and avoids the bias to the majority class by giv-ing equal weights to both classes when buildgiv-ing the classification model. The GP method is trained on three different datasets using the peptides physicochemical properties as feature vectors. The pro-posed algorithm improves the classification accuracy of the minority class which contains the biomarkers peptides thus helping to verify of these biomarkers.
Parts of this contribution have been published in:
Soha Ahmed, Mengjie Zhang, Lifeng Peng: Genetic Programming for Measuring Peptide Detectability. Proceedings of the 10th Simu-lated Evolution And Learning (SEAL2014), Dunedin, New Zealand, 2014, 593-604.
Soha Ahmed, Mengjie Zhang, Lifeng Peng: Prediction of detectable peptides in MS data using genetic programming. Proceedings of the 23rd Genetic and Evolutionary Computation Conference (GECCO Companion2014), Vancouver, BC, Canada, 2014: 37-38.
5. The thesis presents preliminary results of a new GP method for mul-tiple alignment of LC-MC. The proposed method aims at correct-ing the distortion that will assist in improvcorrect-ing the detectcorrect-ing of the biomarker candidates.
1.5. ORGANISATION OF THE THESIS 13 Soha Ahmed, Mengjie Zhang, Lifeng Peng: A Genetic Programming Based Approach to Multiple Alignment of Liquid Chromatography-Mass Spectrometry. Proceedings of the 12th European Conference on Evolutionary Computation, Machine Learning and Data Mining in Computational Biology, EvoApplications (EvoBIO), Lecture Notes in Computer Science. Granada, Spain, 2014: 915-927.
1.5
Organisation of the Thesis
The rest of the thesis is organised as follows.
Chapter 2 presents a review of the literature on biomarker detection of MS data, feature manipulation using GP, and other Evolution Computa-tional(EC) algorithms. The major contributions of the thesis are presented in Chapters 3-6. Each chapter addresses one of the research objectives of the thesis required to fulfill the overall goal. The contributions chapters are shown in Figure 1.2. Chapter 7 presents some investigations on the use of GP for alignment of LC-MS data. Chapter 8 concludes the thesis.
Chapter 2 explains the background for MS data generation, details the nature of the data and the preprocessing steps. The basic background for machine learning, classification, feature manipulation, evolutionary com-putation, particularly GP, and multi-objective optimisation are presented in this chapter. It reviews related work on MS data biomarker detection, feature manipulation using EC techniques, particularly using GP. It also discusses the open questions and challenges that form the thesis motiva-tions.
Chapter 3 proposes a novel GP-based method for ensemble feature ranking in MS data. It includes two feature ranking metrics, selects the best features from both metrics and measures the goodness of the selected features, depending on their frequency of occurrence in the evolved pro-grams. The scores are then used for further ranking of features. A variety
Multi-objective Feature selection and Construction Ch.5 Multiple Feature Construction Ch.4 Ensemble Feature Ranking Ch.3
Single-objective objective
Multi-Biomarker Verification Ch.6 Multiple Alignment of MS Data Ch.7 Biomarker Detection
Figure 1.2: Overview of the major contributions
of classification algorithms, including GP, are used to test the top ranked features from several benchmark MS problems.
Chapter 4 develops a new multiple feature construction GP approach. The proposed method automatically constructs multiple new high-level features from a single evolved model. The single objective method uses a new fitness function that maximises linear discriminant analysis and min-imises the p-value of the constructed features. The proposed approach with the constructed features is examined and compared with the meth-ods using the original selected features.
1.6. BENCHMARK DATASETS FOR EVALUATION 15 Chapter 5 proposes multi-objective GP-subset feature selection meth-ods using embedded fitness evaluation. The multi-objective method aims to maximise the classification accuracy and minimise the number of biomark-ers. The method is tested and compared with the single objective method and two benchmark multi-objective methods. The empirical results on several benchmark problems are presented and discussed. The chapter also discusses some advanced topics on feature construction by using multi-objective GP for maximising the classification performance and minimis-ing the number of high-level features. The method is mainly based on GP with ideas from NSGAII and SPEA2 for measuring the Pareto fitness. These algorithms are all embedded approaches that use the capability of GP for feature manipulation during the process of evolving a classification model.
Chapter 6 proposes the use of GP for measuring the peptide detectabil-ity through building a classifier that uses the peptides’ physiochemical properties to predict whether the peptides will be detected in the mass spectrometer. The detection of peptides indicates whether they can be verified as biomarkers or not. Since the detectable peptides are very small compared to the non-detectable, the problem is tackled as an unbalanced classification problem.
Chapter 7 discusses and examines a GP alignment method that is de-veloped in our work.
Chapter 8 summarises the thesis work and highlights the research goals and overall conclusions. It also indicates some possible future work and research directions.
1.6
Benchmark Datasets for Evaluation
Some benchmark MS datasets with varying difficulty and properties are used to test the performance of the proposed GP approaches. Evaluating the methods also involved testing them on a range of classifiers to test
their generalisability in regards to many classifiers and they are not biased to a specific classier.
MS datasets are typically continuous data. The datasets are obtained from several sources (available online or obtained from various MS labs, including VUW school of Biological Sciences proteomics lab). The datasets are carefully chosen to have a different number of features (365– 45200), as well as different number of instances (10– 253). We also used some datasets with predefined biomarkers to test the biomarker detection rate of the proposed approaches.
Mostly, MS datasets are binary classification problems (case/ control). In some cases, datasets involve three classes (case/ control/ treated) or four classes (case stage 1/ case stage 2/ treated/ control).
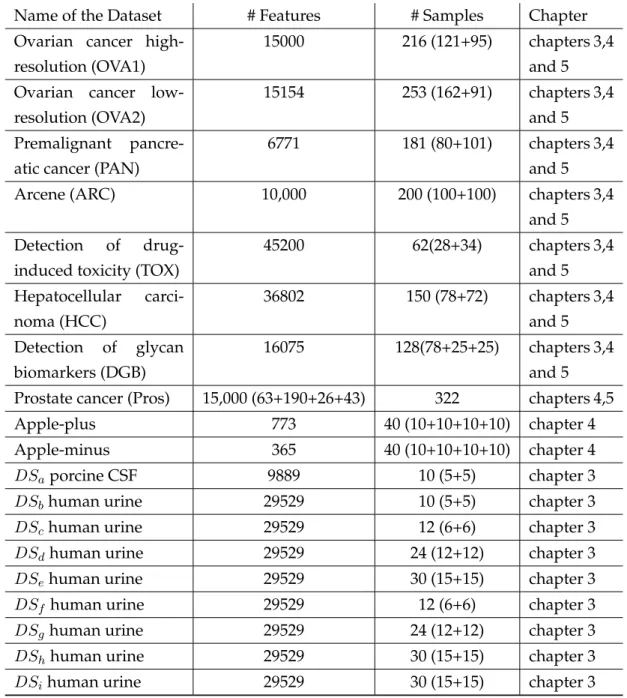
Table 1.1 summarises the datasets that are used as representative sam-ples of the MS classification problems that the proposed approaches can solve with the explanation of the thesis chapters that used the dataset. In the table, the number of samples is shown in the third column, and the number of examples in each class is given between brackets. The last eleven datasets contain some predefined biomarkers that are spiked into the datasets during the preparation process. More details about the datasets acquisition are explained in the following chapters.
1.6. BENCHMARK DATASETS FOR EVALUATION 17
Table 1.2: Benchmark MS Datasets
Name of the Dataset # Features # Samples Chapter
Ovarian cancer high-resolution (OVA1)
15000 216 (121+95) chapters 3,4
and 5 Ovarian cancer
low-resolution (OVA2)
15154 253 (162+91) chapters 3,4
and 5
Premalignant
pancre-atic cancer (PAN)
6771 181 (80+101) chapters 3,4
and 5
Arcene (ARC) 10,000 200 (100+100) chapters 3,4
and 5
Detection of
drug-induced toxicity (TOX)
45200 62(28+34) chapters 3,4 and 5 Hepatocellular carci-noma (HCC) 36802 150 (78+72) chapters 3,4 and 5 Detection of glycan biomarkers (DGB) 16075 128(78+25+25) chapters 3,4 and 5
Prostate cancer (Pros) 15,000 (63+190+26+43) 322 chapters 4,5
Apple-plus 773 40 (10+10+10+10) chapter 4
Apple-minus 365 40 (10+10+10+10) chapter 4
DSaporcine CSF 9889 10 (5+5) chapter 3
DSbhuman urine 29529 10 (5+5) chapter 3
DSchuman urine 29529 12 (6+6) chapter 3
DSdhuman urine 29529 24 (12+12) chapter 3
DSehuman urine 29529 30 (15+15) chapter 3
DSf human urine 29529 12 (6+6) chapter 3
DSghuman urine 29529 24 (12+12) chapter 3
DShhuman urine 29529 30 (15+15) chapter 3
Chapter 2
Literature Review
This chapter is divided into five main parts. The first part explains the basic background of mass spectrometry technology, while the second part describes the background of machine learning, feature manipulation and classification algorithms used throughout the thesis. The third part gives a description of evolutionary computation (EC) algorithms including ge-netic programming and other common EC algorithms. The fourth part of the chapter includes a description of multi-objective optimisation and its most common algorithms. The fifth part of the chapter discusses the pre-vious work on biomarker detection of mass spectrometry data and points out the main limitations of previous approaches. The fifth part also ex-plains the related work of feature selection and construction done using different algorithms specifically genetic programming. The chapter ends with a summary.
2.1
Mass Spectrometry
Mass spectrometry (MS) offers high throughput analysis of the biolog-ical samples by determining the elemental compositions of these sam-ples [169, 177]. The mass spectrometer measures the molecular masses of proteins or peptides, and these masses can be used for identification of the
compounds [103]. It is composed of three parts, which are the ionisation source, the mass analyser and the detector. Firstly, the proteins or peptides are ionised in the ionisation source. Secondly, these ionised molecules are analysed by the mass analyser, which measures their mass to charge ratios (m/z). The third part is the detector, which counts the ions for each m/z value and produces the spectrum.
There are two working modes for the mass spectrometer. The first is the full mode, which measures the m/z values of the parent ions. The product spectrum is called MS spectrum. This spectrum is composed of the m/z ratios of the ions and their corresponding relative intensities. An example of the MS spectrum is shown in Figure 2.1. The second is the tandem mode, which fragments the parent ions and measures the m/z ratios of the fragment ions. The produced spectrum from the tandem mode is called MS/MS spectrum [103].
Figure 2.1: Mass Spectrum example [95]
To make the spectrum less complex, a separation procedure is often performed on the samples prior to the mass spectrometer. This separating method can be a liquid or gas chromatography (LC or GC). The
result-2.1. MASS SPECTROMETRY 21 ing spectrum is called the LC-MS or GC-MS spectrum that contains the retention times, the m/z ratios and their corresponding intensities [169].
The MS technique is the dominant technique used nowadays for the identification and quantification of the molecules in biological samples, leading to the elucidation of their chemical structures and the discovery of biomarkers in biomedical research due to its high sensitivity, high accu-racy and high-throughput capability [20].
MS can be applied to proteomic or metabolomic research areas. In pro-teomics, the first objective is to quantify the proteomes that offers better understanding of cellular and the structural [11, 167] mechanisms. The second objective is to identify the quantified protein. The third objective is the biomarker discovery, where biomarkers are the molecules that indicate specific biological states linked to pathogenic processes, or pharmacologi-cal responses to a therapeutic intervention. In the metabolic research area, the role of MS can be extended to the biochemical reactions and biomarker discovery characterizing physiologically important metabolites.
However, running MS is a time-consuming process, and it is not prac-tical to produce a large number of samples. Also, each sample typically has a huge number of features (as many millions of features) [20].
2.1.1
Proteins and Peptide
A protein is a molecular compound that consists of a chain of amino acids. When two amino acids of the proteins are linked together through the peptide bond, they form a dipeptide. More amino acids linked together are called polypeptide. Very large polypeptide chains form the proteins [125].
Proteins are the governors or the controllers of the cells which have a variety of cellular functions. Some proteins (e.g. enzymes) are responsible for determining which reactions take place. Others have their role in sig-naling and transport. Structural proteins form some elements that make
the cells maintain its shape and size [149]. Also, motor proteins gener-ate mechanically forces. Furthermore, the presence or absence of proteins are not only important to the state of a cell, but also changes in the abun-dance of these proteins can make the discrimination between healthy and diseased cells.
2.1.2
Metabolome and Metabolite
A metabolite is any substance involved in metabolism or the metabolic process, i.e. the process including a set of chemical reactions that changes a molecule into another either for storage or for use in another reaction or as a by-product [179]. The metabolome encompasses a large variety of com-ponents including lipids, amino acids, organic acids, nucleotides, steroids, vitamins, sugars, etc. Metabolome is the complete set of Small-Molecule metabolites. Figure 2.2 shows the relationships between genome, pro-teome and metabolome.
2.1.3
Mass Spectrometry-Based Proteomics
Proteomics is the process of exploring the whole proteome that is the en-tirety of the proteins and its modifications [167]. Unlike the genome of the organism, the proteome constantly changes over time. For example, the proteomes of healthy and patient people are different. Proteomics aims at an analysis of the changes of the different states of the proteome. This analysis will help biologists gain more knowledge about the functions of the protein and will also help medical scientists develop agents and meth-ods to cure diseases.
MS is a key technology for high-throughput protein analysis. MS has achieved great progress toward the identification, quantification, and char-acterization of the proteins that constitute a proteome [20].
2.1. MASS SPECTROMETRY 23
Figure 2.2: General schema showing the relationships starting from Genome to Metabolome. Image published under free document license in the Wikipedia (http://www.wikipedia.com).
2.1.4
Mass Spectrometry-Based Metabolomics
Metabolomics is the set of chemical reactions that occur in cells that are or-ganised in the metabolic pathways where the chemical is transformed into another chemical through a series of steps according to this pathway or map [37]. Mass spectrometry provides a powerful tool for metabolomics analysis which can guide researchers to the metabolic states and provide vital information in the decision-making step for target identification and validation in drug research.
2.1.5
MS Research Directions
MS research has four main directions:
• Proteins and peptide identification: the first method of
the peptides to search a database of predicted theoretical masses that would have been produced from digestion of known proteins [191]. The second method is the De-novo (peptide) sequencing that is performed without prior knowledge of the amino acid sequence [69,105,166]. This process works by assigning amino acids from pep-tide fragment masses of a protein [163].
• Proteins and peptide quantification: determining the quantity of a
specific protein in the sample is another area arising for MS. Protein quantification through MS can be done in two methods chemical la-beling or label-free methods [185].
Using the labeling methods [19], a mixture of proteins are labeled with an isotope that is used to compare the peaks directly from dif-ferent samples. The labeling methods include SILAC (Stable Isotope Labeling with Amino acids in Cell culture) [127] and ICAT (Isotope Coded Affinity Tags) [65]. These methods provide accurate protein quantification but are considered expensive as they require addi-tional processing steps and high-cost labeling agents. The label-free methods depend on the signal intensities (detected peaks for each peptide) to measure the abundance of the peptide. Label-free quan-tification has two possibilities, either extracting the ions from the spectra or the spectral count, i.e. the number of MS spectra in which peptides of an analysed protein can be found.
• Biomarker detection and classification algorithms: biomarker
detec-tion and classificadetec-tion algorithms are related to the process of find-ing the peaks or the feature patterns (biomarkers) that can be used to classify samples and discriminate different classes, e.g., from differ-ent cell states or from healthy and control classes. Biomarker discov-ery usually starts with feature selection to overcome the high dimen-sionality problem. The selected features are passed to a classifier to
2.1. MASS SPECTROMETRY 25 assess the classification accuracy of the selected features. The set of features that provide better classification are the biomarkers.
• Peptide detection for biomarker verification and protein
quantifica-tion: after biomarker detection, the detected biomarkers pass through two other stages, verification and experimental validation. Peptide detection, which is the probability that a the certain peptide can be observed in a mass spectrometer, can be used as a verification method of candidate biomarkers. The process of peptide detection can also be used for absolute quantification of peptides and proteins. The task of peptide detection can be performed using machine learning techniques by training a model using a peptide sequence’s proper-ties. The peptides of the observed class are classified as the verified biomarkers. Peptide detection is the middle stage between biomarker detection and experimental validation.
2.1.6
Biomarkers
The term ”biomarker” can be defined as a biological marker or a medical sign that acts as an indicator of a specific medical state. Biomarker refers to the indications of a specific illness or non-illness of a patient. In the literature, there are more precise definition of biomarker for example, the National Institutes of Health Biomarkers [59] Definitions Working Group defined a biomarker as ”a characteristic that is objectively measured and evaluated as an indicator of normal biological processes, pathogenic pro-cesses, or pharmacologic responses to a therapeutic intervention.” The World Health Organization (WHO), and in coordination with the United Nations and the International Labour Organization, has defined a biomarker as ”any substance, structure, or process that can be measured in the body or its products and influence or predict the incidence of outcome or dis-ease” [158].
Biomarker can also indicate the effect of therapies and drugs that can be extended to discoveries of new drugs and prognosis of diseases. A biomarker is a protein, peptide or a metabolite which occur in a biological sample.
From a machine learning point of view, a biomarker is an important feature that has a higher capability to discriminate between the different classes. Hence, the set of features that provide better classification are the biomarkers. In MS spectrum, each instance is composed of a number of features where each feature refers to a certain peptide or metabolite. The feature is composed of the feature identity which is the m/z value, and a feature value which is the intensity value. The intensity values are used in the feature manipulation algorithm to determine the biomarker candi-dates. This process is referred to as the biomarker detection process. The m/z value of each biomarker is used afterwards to identify what protein or matabolite this biomarker is.
2.1.7
Mass Spectrometer
The general setup of a simple mass spectrometer is composed of three
parts: The first part is ion source in which the mixture of molecules is
ionised to facilitate the separation process of these ions according to their
mass to charge (m/z) ratio measured using the second part which ismass
analyser. The third part is the detectorwhich counts the resulting ions for each mass [167]. The structure of the mass spectrometer in shown in Fig-ure 2.2. There are different techniques of ionisation and mass analysis.
2.1. MASS SPECTROMETRY 27
ionisation techniques
ionisation techniques include matrix-assisted laser desorption ionisation (MALDI), surface-enhanced laser desorption/ionisation (SELDI) and elec-trospray ionisation (ESI) [165].
For MALDI, the analyte has to be mixed with a matrix substance. The mixture is dried out and crystallized then it is hit with a laser in the vac-uum. At a specific time, the matrix absorbs the energy and blows up pro-ducing the ionised molecules in the process [12, 168]. Most of the MALDI ions are only singly charged, which makes MALDI spectra easy to inter-pret and analyse. SELDI is a variation of MALDI that uses a target modi-fied to achieve biochemical affinity with the analyte compound [50].
The second method of ionisation is the electrospray ionisation (ESI) [112], where the analyte is mixed with a liquid. ESI is usually coupled with LC to separate the mixture and make the spectra even simpler before the MS analysis. The analyte solution passes through an electrospray needle to release the ions. Figure 2.4 shows ESI schematics.
Mass analysers
The mass analyser helps in determining the mass range, sensitivity and ac-curacy of the instrument [167]. There are different types of mass analysers, the most common including [186]:
• Sector field mass analyser: uses electric or magnetic fields for flections, where the lighter, more charged, faster ions are more de-flected [54].
• Time-of-flight (TOF): TOF accelerate the ion produced by the static electric field and then measure the time they need to reach the detec-tor [167]. Lighter ions reach the detecdetec-tor first.
• Linear quadrupole ion trap:This mass analyser uses electrical fields to stabilise or destabilise ions passing through a radio frequency quadrupole field. Using this approach, certain ions are trapped in a two-dimensional electrical field and can be selectively discarded from the trap by their m/z value [186].
• Fourier Transform Ion Cyclotron Resonance (FT-ICR) mass anal-yser: This analyser makes ions move circularly with a homogeneous magnetic field. The frequency of rotation depends on the m/z of the ion. To measure ions with different masses the alternating field is changed, and the signals for different masses retrieved via Fourier transform (FT) [186].
• Orbitrap: This is perhaps the most recent mass analyser [186]. Or-bitrap takes up a circular motion (orbit) through electrostatic attrac-tion. At the same time, it oscillates along the axis of the central elec-trode. This oscillation generates signals in the detectors that can be mapped to mass-to-charge ratios by FT. In contrast to the FT-ICR, an orbitrap uses an electrostatic rather than a magnetic field. Therefore, no cooling is necessary. The resolution is nearly as good as that of an FT-ICR [54].
2.1. MASS SPECTROMETRY 29
Detectors
The mass analyser destroys the ions during analysing, so the detector de-tects a particle and then multiplies the effect of this particle as the number of detected ions is often very small [36]. Possible detectors are a photo-multiplier, secondary ion photo-multiplier, ion-to-photon detector, Faraday cup, channel electron multiplier, or Daly detector [36].
2.1.8
MS Data Analysis
The pipeline of the MS data analysis consists of the following steps [97]:
• peak signal filtering and baseline subtraction: remove noise and
base-line artifacts that have resulted from instrumental, chemical or bio-logical errors.
• peak extraction: detects and extracts the accurate positions, heights
and total ion counts of all the peaks.
• identification of the compounds (qualitative MS): identify the
com-pounds in a sample given peak information. For protein identifi-cation, the MS takes the peptide mix as an input and produces a list of masses which are used as indexes of the corresponding pro-teins in a database of known propro-teins. The list of the masses is called the peptide mass fingerprint (PMF). During the search the match-ing proteins, the modified or unmodified peptides and their masses together with scores per peptide and protein, and the sequence cov-erage are given as results. This approach can work with a certain complexity, but if there are many proteins in a sample, this approach is no longer appropriate. Therefore mechanisms for fragmentation of peptide are applied (tandem MS/MS) that allow prediction [191] and de-novo sequencing [69, 105, 166] from fragmentation spectra, making the identification of proteins in very complex samples possi-ble.
• quantification (quantitative MS): determines the quantity of each com-pound in the samples. It is insufficient to know which proteins in the cell, it is also important to know how abundant these proteins are to be able to differentiate between normal and abnormal cells. MS en-ables high-throughput ability to identify and quantify proteins from the same sample. However, it is not easy to make it work quanti-tatively because the measuring sensitivity differs between different types of molecules [97, 167].
• intensity normalisation: normalise the ion counts of the compounds.
• multiple map alignment: correct the distortion and the fluctuation
of the retention time and m/z dimension of multiple raw or feature maps in case of tandem MS. In case of MS, correct the fluctuation in m/z values.
• classification and biomarker discovery: find the feature patterns
(dif-ferentially expressed peaks) that can be used to classify samples [97, 167]. A biomarker is the indication of a change in expression or state of a protein or a metabolite that correlates with a risk of disease pro-gression. Biomarker discovery will lead to drug discovery and de-velopment, indicate drug efficiency, reduce cost and duration of ex-perimental trials and finally, can help in the cure of diseases.
The use of MS technique for the identification and quantification of the molecules in biological samples will lead to the elucidation of their chemical structures and the discovery of biomarkers in biomed-ical research due to its high sensitivity, high accuracy and high-throughput capability [97].
Depending on the underlying type of mass spectrometer, a raw MS spectrum or LC-MS/MS map, can vary from several hundreds of megabytes up to several gigabytes, whereas only a small fraction of data contains the signal of interest. This accentuates the need for fast
2.2. MACHINE LEARNING 31 and effective machine learning algorithms for each of the analysis steps mentioned above. This will allow for high throughput, fast proteomics and metabolic approaches.
2.2
Machine Learning
Machine learning is the research field dealing with algorithms for automa-tion of knowledge from data [8, 18].
Two main approaches to machine learning are supervised and unsu-pervised learning [8].
In supervised learning, the learning algorithm learns to produce the correct outputs from given inputs. A typical example application of su-pervised learning is classification in which a classifier takes, as input, the description and properties of several examples of an object and produces, as an output, a class label for that object [119]. The classification process consists of two phases, training and testing where, in the training phase, the classifier has been trained by or learned from examples from the prob-lem called instances accompanied by the class labels, where the whole set of instances is called the training set [119]. In the testing phase, the in-stances that are unseen by the classifier are used to test the performance of the classifier. The collection of instances used during the testing phase is called the test set [119]. Another example of the supervised learning is regression, i.e. the estimation of a function or modelling the problem solution with equations [8].
In unsupervised learning the examples are unlabelled, which means that during the training process the learning algorithm cannot use class la-bels. An example of unsupervised learning is clustering. A main challeng-ing problem of clusterchalleng-ing is the evaluation of the clusterchalleng-ing algorithm [8].

![Figure 2.1: Mass Spectrum example [95]](https://thumb-us.123doks.com/thumbv2/123dok_us/9957945.2488313/42.892.190.679.576.916/figure-mass-spectrum-example.webp)

![Figure 2.4: Electrospray ionisation (ESI) schematics [58].](https://thumb-us.123doks.com/thumbv2/123dok_us/9957945.2488313/49.892.196.726.674.955/figure-electrospray-ionisation-esi-schematics.webp)