http://www.sciencepublishinggroup.com/j/jfa doi: 10.11648/j.jfa.20190706.13
ISSN: 2330-7331 (Print); ISSN: 2330-7323 (Online)
Factor Analysis Comparison of Factor Differences Between
Old and New Calculation Methods
Meihua Chen, Liu Yun, Guifen Ma, Yonghong Yao
*Hua Shang Accounting College, Guangdong University of Finance and Economics, Guangzho, China
Email address:
*
Corresponding author
To cite this article:
Meihua Chen, Liu Yun, Guifen Ma, Yonghong Yao. Factor Analysis Comparison of Factor Differences Between Old and New Calculation Methods. Journal of Finance and Accounting. Vol. 7, No. 6, 2019, pp. 200-209. doi: 10.11648/j.jfa.20190706.13
Received: October 12, 2019; Accepted: November 7, 2019; Published: November 25, 2019
Abstract:
In this paper, following the previous: factor analysis, cost difference analysis of the status quo and existing problems; The allocation problem of the total difference caused by the factor interaction of factor analysis, and the application of a new factor analysis method: exponential logarithmic proportion method, make the factor analysis and difference analysis have a correct solution. This paper is mainly based on the above factor analysis of the "exponential logarithmic ratio" method, and the current American management accounting (Srikant m. atar et al.), cost and management accounting (Charles t. orngren et al.), and management accounting (Ray h. arrison et al.). China's current "applied statistics" and "financial analysis" (national excellent course); "Financial cost management" certified public accountant examination book "cost management accounting"; Countries "twelfth five-year" plan of undergraduate course of common higher education teaching materials "management accounting" as an example, through comparing traditional balance of substitution factor analysis method and index of logarithmic ratio method, two kinds of calculation method for the calculation results of difference comparison and draw the conclusion: the new method of factor analysis can correctly allocate factor interactions that main factors differences between factor can be decomposed into the sum of factor analysis the index of logarithmic ratio method can solve the problem of interaction between factors cannot be separated; It has solved the unsolvable problems that have troubled the factor analysis and difference analysis in economic management for many years, which not only has the function of theoretical perfection, but also has the guiding significance in practical activities.Keywords:
Factor Analysis, Exponential Logarithmic Proportional Method, Traditional Calculation Method, Interaction Allocation1. First, There Is No Need to Assume the
Sequence of Factor Replacement
The knowledge points of factor analysis involve many professional courses and are widely used in practice. This paper tries to compare the results of two kinds of calculation methods to find out the scientificity and correctness of the two different methods. Considering the relevance of factor analysis cases, this paper tries to cite influential and authoritative teaching materials at home and abroad as examples, and use the old and new methods of factor analysis to solve problems, so as to establish the scientificity and correctness of the new method. And it can correct the traditional factor analysis method.
In the current application of factor analysis, a lot of conditions and assumptions have been set, among which, the "order" of factors cannot be changed, and the "quantity before quality" hypothesis is adopted in the implementation of analysis.
be considered as a whole to meet the normative requirements. Example 1. Financial Accounting by Roman l. eil, Katherine Schipper and Jennifer Francis. Translated by zhu Dan and qu tenglong. 1st edition p 175-176, China machinery industry press, September 2015 [1].
R0E=ROA* financial leverage
Table 1. Analysis of roe difference.
ROE R0A FL
2012’ 21.7 7.7 2.82
2011’ 20.7 7 2.95
To analyze the change difference of the return on equity of the main factor from 2012 to 2011, the basic theoretical formula of the analysis is: return on equity = net interest rate on sales * return on total assets.
Table 2. Results of traditional analysis (first return on total assets).
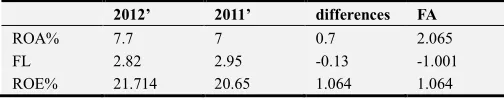
2012’ 2011’ differences FA
ROA% 7.7 7 0.7 2.065
FL 2.82 2.95 -0.13 -1.001
ROE% 21.714 20.65 1.064 1.064
Table 3. Results of traditional analysis (financial leverage ratio).
2012’ 2011’ differences FA
FL 2.82 2.95 -0.13 -0.91
ROA% 7.7 7 0.7 1.974
ROE% 21.714 20.65 1.064 1.064
The two answers are completely different, because the interaction between the two factors is occupied by the replaced factor. Therefore, factors have different influences on major factors.
Table 4. Factor analysis by exponential logarithm method is as follows.
2012’ 2011’ d IOL FA
ROA% 7.7 7 0.7 0.09531 2.0184
FL 2.82 2.95 -0.13 -0.04507 -0.9544
ROE% 21.714 20.65 1.064 0.050242 1.064
The original book did not consider the factor structure of the factors and did not make detailed analysis of the factors. Instead, it directly calculated the difference between the return on equity of the main factors of the two years as 21.7-20.7=1, and did not specifically analyze the difference of the influence of the factors. Since it is the formula structure of multiplication, the factor analysis of factors cannot conclude that the sum of the influence difference between the two factors is 0.7+ (-0.13) ≠1.064. Only according to the factor analysis method, it can be concluded that the total difference is equal to the sum of the differences of the factors, 2.065+ (-1.001) =1.064. It is not clear what method the authors would use if the proposition were to refine the analysis of factors affecting the total.
The results calculated by the traditional method (taking the return on total assets as the first step) are compared with those calculated by the exponential logarithmic ratio
Table 5. Method as follows.
2012’ 2011’ d TM ELR Md
ROA% 7.700 7.00 0.70 2.065 2.018 0.047
FL 2.820 2.95 -0.13 -1.001 -0.954 -0.047
ROE% 21.714 20.65 1.064 1.064 1.064 0.000
In the traditional method, the impact of total return on assets on the return on equity is overcalculated by 0.047%, and the impact of financial leverage on the return on equity is overcalculated by -0.047%.
The influence amount of factors calculated by the exponential logarithmic ratio method is the same regardless of the order of factors, because this method has fairly distributed the interaction difference of the two factors' influence on the main factors.
Example 2. Basic analysis formula of turnover rate of accounts receivable: turnover rate of accounts receivable = sales revenue/average accounts receivable (same as above P 179).
When calculating and analyzing accounts receivable turnover rate = sales revenue * average accounts receivable^(-1), or accounts receivable turnover rate = average accounts receivable^(-1)* sales revenue, the influence amount of factors on the main factors is completely different.
Table 6. Basic information.
2012’ 2011’ d
SR 49694.00 45015.00 4679.00
AAR 1944.00 1397.98 546.02
ART 25.60 32.20 -6.60
DART 14.30 9.80
Table 7. Sales revenue in front.
2012’ 2011’ d FA
SR 49694 45015 4679 3.346969
AAR 1944 1397.981 546.0186 0
ART 0.000514 0.000715 -0.0002 -9.98421
DART 25.6 32.2 -6.6 -6.63724
Table 8. The average accounts receivable is at the top.
2012’ 2011’ d FA
AAR^-1 0.000514 0.000715 -0.0002 -9.04414
SR 49694 45015 4679 2.406893
AAR 1944 1397.981 546.0186 0
ART 25.6 32.2 -6.6 -6.63724
For the two order of factors, the results of the factors' influence on the population calculated by traditional factor analysis are completely different. Once again, because of the interaction of factors, it is assumed by one of the factors.
Table 9. Exponential logarithmic ratio method.
2012’ 2011’ d IOL FA
AAR^-1 0.000514 0.000715 -0.0002 -0.32972 -9.4873
SR 49694 45015 4679 0.098888 2.845411
AAR 1944 1397.98 546.02 0
The exponential logarithmic ratio method gives the same result no matter how the order of the factors is changed, because this method fairly allocates the interaction between the two factors.
The original book answer is: 2012 accounts receivable turnover ratio decreased 6.6 compared with 2011. The overall difference is made directly: 25.6-32.2=-6.6. Without the use of factor analysis method, the specific influence amount of the sub-factors "sales revenue" and "average accounts receivable" that affect the main factor "accounts receivable turnover rate" is further decomposed, avoiding the problem of apportionment of the interaction of factors in the product structure. It is not possible to analyze the specific difference of sales revenue and average accounts receivable in affecting the turnover rate of accounts receivable (-6.6), so as to figure out the influence degree of specific factors and the power and responsibility relationship that the corresponding responsible subject should bear.
2. Interaction is Not the Quantity of
Breeding Factors
The current factor analysis results in many factors other than the main factors, such as "structure", "rank" and "efficiency". Some are complex variables, some are variables other than factors, it is really confusing, some seem to cover up the interaction between factors, is derived from the factors of variables, such as: structure, actually derived from the amount and amount; Grade is the factor derived from the price of mixed portfolio; Efficiency is derived from unit hours and product costs.
In the author's opinion, these derived factors actually play a role in explaining the unexplainable interaction, thus
leading to the regret that the whitewashing method has defects.
Example 3. In kanter, M, Dartmouth's (Srikant m. atar) Madhav, V, rajan (Madhav V. R ajan) [M]. "management accounting" (Wang Liyan, ChenJia seats, renmin university of China press, on April 1, 2015,) of chapter 13 "flexible budget, differences and management control"[2] p 461-463 price difference and efficiency difference (the original book answers), the differences between "efficiency" of "efficiency" factor is the growth factor.
Price difference = (actual price of input - budget price of input) × actual input quantity
Table 10. Original financial information.
DDC (TAP-TBP) ×AI=Pd
DM (28-30) ×22200= 44400$ F
DM (22-20) ×9000=18000 $ U
The efficiency difference
Efficiency difference = (actual input quantity - budget input quantity under actual output) × the budget price of input
Table 11. Original difference analysis.
DCC (AI-BI) ×BP=Ted
DM (22200-20000) ×30=66000($) U
DL (9000-8000) ×20= 20000 ($) U
Total negative impact: -44400+18000+66000+20000 = 59600 (usd)
The main factor is cost. The object of factor analysis is the difference between actual cost and budget cost. There is no efficiency difference, efficiency factors are breeding.
Table 12. Factor analysis by exponential logarithmic ratio method is as follows.
AN BN d IOL FA
DM
P 28 30 -2 -0.069 -42136
N 22200 20000 2200 0.1044 63736
Am 621600 600000 21600 0.0354 21600
DL
P 22 20 2 0.0953 16996
N 9000 8000 1000 0.1178 21004
Am 198000 160000 38000 0.2131 38000
The overall impact is: -42136.45 + 63736.45 + 16996.26 + 21003.74 = 59600 (usd)
higher costs.
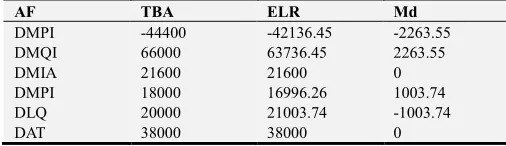
Table 13. Differences of results of the two calculation methods.
AF TBA ELR Md
DMPI -44400 -42136.45 -2263.55
DMQI 66000 63736.45 2263.55
DMIA 21600 21600 0
DMPI 18000 16996.26 1003.74
DLQ 20000 21003.74 -1003.74
DAT 38000 38000 0
In the original book, the favorable influence of direct materials was undercounted by $2,263.55, while the unfavorable influence of direct materials was overcounted by
$2263.55. $1003.74 of adverse effects of labor price was overcounted and $1003.74 of adverse effects of labor quantity was undercounted. The price of materials is the responsibility of the procurement department, the material consumption is the responsibility of the production department, the labor price, labor hours are the matter of labor efficiency, the influence of the total cost of the factor factors affect the difference in the calculation of the wrong amount, which is not only related to the department's responsibility, rights, interests, but also involves the correct attribution of individual responsibility and rights.
analysis solution method in the original textbook.
Example 4. Financial analysis by zhang xianzhi and Chen youyou [3]. (8th edition) national planning textbook and national excellent courses for undergraduate students of general higher education during the 12th five-year plan period, published by northeast university of finance and economics press in March 2017, P 170.
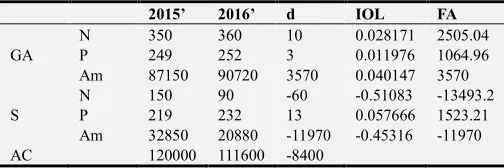
Table 14. The results of the two methods are compared.
2015’ 2016’ d IOL FA
GA
N 350 360 10 0.028171 2505.04
P 249 252 3 0.011976 1064.96
Am 87150 90720 3570 0.040147 3570
S
N 150 90 -60 -0.51083 -13493.2
P 219 232 13 0.057666 1523.21
Am 32850 20880 -11970 -0.45316 -11970
AC 120000 111600 -8400
That is, the influence of the quantity and price of first-class products on sales revenue: 2505.04+1064.96=3570
Influence of quantity and price of second-class goods on sales revenue: -13493.2+1523.21=-11970
The influence of the first and second grades on sales revenue: 3570-11970=-8400
Or the impact of sales volume on sales revenue: 2505.04-13493.21= -10988.17
Influence of price on sales revenue =1064.96+1523.21=
2588.17
The original book answer: the price change to the profit influence 2250 thousand yuan, the rank structure change to the profit influence 1350 thousand yuan, the sale quantity to the profit change influence did not do. If calculated according to the traditional calculation method, the effect of quantity on profit is -12000 thousand yuan, and the total effect is: 3600-12000=-8400. There are only two factors here, sales price and sales quantity. How can we get more "grade structure" factors? Obviously, here, the interaction between sales quantity and sales price is derived into "grade" factors, which is the breeding factor.
Example 5. Financial analysis by zhang xianzhi and Chen youyou (8th edition), national planning textbook and national excellent courses for undergraduate courses of general higher education during the 12th five-year plan period, northeast university of finance and economics press, 2017, p 169-170
2016 product sales profit list unit: thousand yuan
Analysis basic equation: sales profit = sales quantity * (unit price - unit cost), or: = sales quantity * unit profit
The "structure" factor in the "influence of selling variety structure" is the breeding factor.
The overall impact is 10200= quantity impact 3608.04+ sales variety structure impact 1691.96+ unit price impact 3600- sales cost impact 1300
Table 15. Exponential logarithmic ratio method.
AF 2016’ 2015’ d IOL FA Md
AP
N 250 200 50 0.2231 2500 902.264
P 50 50 0 0 0
SA 12500 10000 2500 0.2231 2500
C 40 42 -2 -0.0488 -447.74 447.736
N 250 200 50 0.2231 2047.74
CS 10000 8400 1600 0.1744 1600
N 250 200 50 0.2231 450
U 10 8 2 0.2231 450 450
SP 2500 1600 900 0.4463 900 1800
BP
N 450 500 -50 -0.1054 -12195. -5578
P 248 240 8 0.0328 3795.4 3795.4
SA 111600 120000 -8400 -0.0726 -8400
N 450 500 -50 -0.1054 -9401.4
C 186 190 -4 -0.0213 -1898.6 1898.6
TC 83700 95000 -1130 -0.1266 -11300
N 450 500 -50 -0.1054 -2784
U 62 50 12 0.2151 5683.99 5683.99
SP 27900 25000 2900 0.1098 2900 5800
CP
N 100 80 20 0.2231 24000 14592.3
P 1200 1200 0 0 0
SA 120000 96000 24000 0.2231 24000 0
N 100 80 20 0.2231 16703.5
C 840 830 10 0.012 896.484 -896.48
TC 84000 66400 17600 0.235 17600
N 100 80 20 0.2231 7295.83
U 360 370 -10 -0.0274 -895.83 -895.83
SP 36000 29600 6400 0.1957 6400 12800
66400 56200 10200 20400
Factor analysis of the first equation: quantity impact
4954.753+price impact 3795.39592-cost impact
-1449.85=10200
Factor analysis of the second equation: quantity influence
4961.836+ unit profit influence 5238.163905=10200 There is a problem with the original proposition: 1) Repeat conditions are given, either:
quantity × sales cost;
Either: total profit = sales volume × unit product profit. The given condition satisfies the double calculation of the two equations.
2) Problem creates a "structural" variable effect that does not exist in the equation. Whether the units of the structure are composite units or ratios; If it's a ratio, it can only be a value ratio, because a single quantity, or unit price, doesn't tell you anything about the structure, so the structure is the value ratio of quantity times unit price, which is a compound variable. There is no "structure" factor in the equation. The "structure" effect calculated by the original problem is only the interaction between the sales volume of different products and the sales price, which is regarded as the influence of the sales product structure. In fact, there are three structures of production (assuming the same production and sales volume), and the cost structure of product varieties and the profit structure of product varieties; In factor analysis they also have a product combination of two factors. The resulting structural effects only complicate simple things.
3. Calculation Procedures for Normative
Factor Analysis
We standardized factor analysis by the following steps: Step 1: establish factor analysis equation;
Step 2: calculate the analysis object, i.e. the overall difference of main factors;
Step 3: factor factor analysis, list calculation of factor factor influence, factor index logarithmic ratio calculation;
Step 4: calculate the difference of factors.
Example 6. The relevant knowledge points in the relevant textbooks, using the above method procedures, normative factor analysis at the same time, normative factor analysis steps.
Cost and management accounting (15th edition) by Charles t. gren Srikant m. atar Madhav v. riajan [4]
Translated by wang liyan and liu yingwen the first edition of June 2016 by renmin university of China press the 3rd printing of p 464-470 in November 2017
Table 16. Budget and actual operating data of 2013 are as follows.
Product sales department The actual completion Budget
AN ucgp sales% BN ucgp sales%
A Wholesale department 100000 226.275 66.67 93000 225 60
B department 50000 264.45 33.33 62000 275 40
Analyze the differences. Analysis procedures:
Step 1: analysis equation: gross profit contribution = gross profit contribution × sales quantity;
Step 2: identify the analysis objects (total variance): total actual contribution gross profit - total budget contribution gross profit =3585000-3797500= -212,500 dollars
Step 3: factor analysis (factor factor difference analysis) the only two factors that affect the gross profit contributed by the main factors are the gross profit contributed by the unit and the sales volume. However, there are two types of products to be sold: A and B, which need to calculate the difference of influence respectively.
Table 17. Calculation results by exponential logarithmic ratio method are as follows.
AF AN BN d IOL FA
AP
ucgp 226.275 225 1.275 0.00565 122987.7
n 100000 93000 7000 0.07257 1579512
TGPC 22627500 20925000 1702500 0.07822 1702500
BP
ucgp 264.45 275 -10.55 -0.0391 -588945
n 50000 62000 -12000 -0.2151 -323856
TGPC 13222500 17050000 -3827500 -0.2542 -3827500
Σ 35850000 37975000 -2125000 -0.0576 -2125000
Among them "structure" ratio is breeding factor, is redundant.
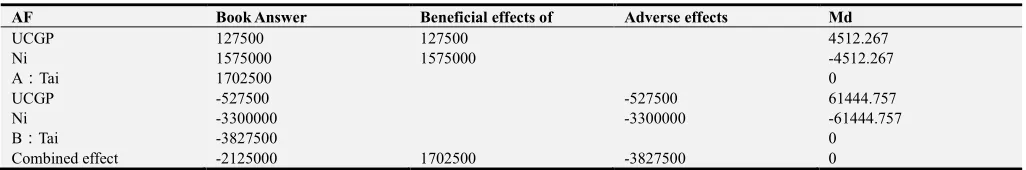
Table 18. The answers of the original book and the comparison with the calculation results of the exponential logarithmic ratio method are as follows.
AF Book Answer Beneficial effects of Adverse effects Md
UCGP 127500 127500 4512.267
Ni 1575000 1575000 -4512.267
A:Tai 1702500 0
UCGP -527500 -527500 61444.757
Ni -3300000 -3300000 -61444.757
B:Tai -3827500 0
Combined effect -2125000 1702500 -3827500 0
When calculating the difference of product A, the original book wrongly increased the impact of unit contribution gross profit on the total contribution gross profit by $4512.267, and wrongly reduced the impact of product A sales volume on the
profit contribution was overcounted, and the impact of the sales volume of product B on the gross profit contribution was undercounted, which was $61444.757. This calculation result will lead managers to misjudge the effect of different products on the contribution of gross profit.
Example 7. Financial cost management [5], a textbook for the national unified examination of certified public accountants in 2018, was compiled by the China association of certified public accountants, and published in March 2018 by China financial and economic publishing house, China financial publishing and media group. P 29-30.
"Example 2-1: the actual cost of a certain material used by an enterprise in March 20 X1 is 6,720 yuan, while the planned cost is 5,400 yuan. 1320 yuan more than planned. Because material cost is composed of product output, unit product material quantity and material unit price product product product product product product. Therefore, the total index of material cost can be decomposed into three factors, and then analyze their influence on the total material cost one by one. Now suppose the values of these three factors are shown in table 19 (This article is shown in table 19)."
Table 19. Material cost information.
Project unit BN AN d
Q piece 120 140 20
SM kg/piece 9 8 -1
P yuan/kg 5 6 1
Material cost yuan 5400 6720 1320
Problem solving:
1) Basic equation of analysis: material cost = product output × material consumption × material unit price;
2) Variation difference of material cost of the objects analyzed: 6720-5400=1320 (RMB);
3) Traditional factor analysis balance substitution method.
Table 20. Calculation by traditional factor analysis.
Project BN AN d FA
TPP Piece 120 140 20 900
SM Kg/piece 9 8 -1 -700
TMP Rmb/kg 5 6 1 1120
Project BN AN d FA
Material cost Rmb 5400 6720 1320 1320
4) Calculation results of the new method
Table 21. Exponential logarithmic proportional method.
Project unit BN AN d IOL FA
TPP a 120 140 20 0.154151 930.4479
SM Kg/a 9 8 -1 -0.11778 -710.934
TMP Rmb/kg 5 6 1 0.182322 1100.486
MC Rmb 5400 6720 1320 0.218689 1320
5) The difference ratio calculated by traditional factor analysis method and exponential logarithmic ratio method.
Table 22. Methods differences.
Project unit BN AN TM ELR MD
TPP a 120 140 900 930.448 -30.448
SM kg/a 9 8 -700 -710.934 10.934
TMP yuan/kg 5 6 1120 1100.486 19.514
MC yuan 5400 6720 1320 1320 0
The results of the two methods are compared. The new method changes the difference of the influence of factors on the main factors calculated by the traditional method.
Example 8. Source: cost management accounting by meng yan and liu junyong, national planning textbook for undergraduate courses of general higher education during the 12th five-year plan period, higher education press printed P 109 for the third time in December 2017. The text is omitted [6].
Table 23. The results are calculated by traditional methods.
Project AN BN d TM
Q 12000 10000 2000 66000
VUC 3.1 3 0.1 13200
UTC 10.8333 11 -0.166667 -6200
Material cost 403000 330000 73000 73000
The original book only makes unit change cost impact 13000- unit labor hour consumption impact 6000=7000 (yuan)
Table 24. Exponential logarithmic ratio method.
Project AN BN d ELR FA
TPP 12000 10000 2000 0.18232 66599.35
VUC 3.1 3 0.1 0.03279 11977.63
WHS 10.8333 11 -0.1667 -0.0153 -5576.98
Material cost 403000 330000 73000 0.19984 73000
Table 25. Method differences.
AN BN d FA MD
TPP 12000 10000 2000 66000 66599.35 -599.347
VUC 3.1 3 0.1 13200 11977.63 1222.37
WHS 10.8333 11 -0.167 -6200 -5576.98 -623.02
TA 403000 330000 73000 73000 73000 0
Compared with the exponential logarithmic ratio method, the difference substitution method has an impact of -599.347 yuan on the total cost difference, the multi-unit variable expense standard has an impact of 1222.367 yuan on the total
there are only three factors influencing "product output", "cost of unit labor hour variation" and "unit product labor hour", but no "efficiency" factor.
Example 9. Wu xiaoling and tian gaoliang [7] edited the textbook of enterprise financial analysis for 21st century economy and management planning, p 17-19 was printed by Peking University press for the second time in February 2018
Table 26. Material cost information.
Project 2012’ 2013’ d
PMBIT 0.1250 0.1515 0.0265
NCAT 4.8000 4.5000 -0.3000
AL 0.3125 0.3300 0.0175
ROA 0.1875 0.2250 0.0375
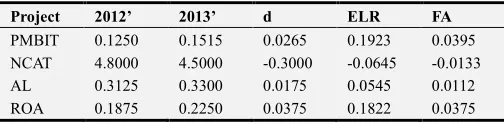
1) Analysis equation: return on total assets = profit rate before interest and tax × current asset turnover × asset turnover
2) Analysis object: 22.50%-18.75%=3.75% 3) Factor analysis (3.75%=3.98%-1.43%+1.20%):
Table 27. The results are calculated by traditional methods.
Project 2012’ 2013’ d TM
PMBIT 0.1250 0.1515 0.0265 0.0398
NCAT 4.8000 4.5000 -0.3000 -0.0142
AL 0.3125 0.3300 0.0175 0.0119
ROA 0.1875 0.2250 0.0375 0.0375
4) exponential logarithmic ratio method
Table 28. Exponential logarithmic ratio method.
Project 2012’ 2013’ d ELR FA
PMBIT 0.1250 0.1515 0.0265 0.1923 0.0395
NCAT 4.8000 4.5000 -0.3000 -0.0645 -0.0133
AL 0.3125 0.3300 0.0175 0.0545 0.0112
ROA 0.1875 0.2250 0.0375 0.1822 0.0375
Table 29. Method differences.
Project 2012’ 2013’ TM ELR MD
PMBIT 0.125 0.1515 0.0398 0.0395 0.0002
NCAT 4.8 4.5 -0.0142 -0.0133 -0.0009
AL 0.3125 0.33 0.0119 0.0112 0.0007
ROA 0.1875 0.2249775 0.0375 0.0375 0.0000
Example 10. Management accounting: theory, model, and case, excellent planning textbook by wen subin [8], P 231 published by China machinery industry press in June 2014
Table 30. Information.
CF AN BN d
TPP 7000 7000 0
SM 5.257143 5 0.257143
TMP 1.9 2 -0.1
TC 69920 70000 -80
1) Analysis equation: total cost = product output × product material consumption × material price
2) Analysis object: 69920-70000=-80 (yuan)
3) Factor analysis (traditional factor analysis, the same as the following table):
Table 31. The traditional method.
CF AB BN d FA
TPP 7000 7000 0 0
SM 5.257 5 0.257 3600
TMP 1.9 2 -0.1 -3680
TC 69920 70000 -80 -80
4) Factor analysis with exponential logarithmic proportion method
Table 32. Exponential logarithmic ratio.
CF AN BN d ELR FA
TPP 7000 7000 0 0 0.00
SM 5.257142857 5 0.257143 0.05015 3508.48
TMP 1.9 2 -0.1 -0.05129 -3588.48
TC 69920 70000 -80 -0.00114 -80.00
5) Methods differences
Table 33. Two methods of factor analysis.
CF AN BN TM ELR Md
TPP 7000 7000 0 0.00 0.00
SM 5.257 5 3600 3508.48 91.52
TMP 1.9 2 -3680 -3588.48 -91.52
TC 69920 70000 -80 -80.00 0.00
The increase of the total cost by the traditional method is 91.52 yuan. The impact of multiple material prices on total cost reduction was 91.52 yuan. Similarly, the unit consumption of products is the responsibility of the production department, and the price of consuming materials is the responsibility of the procurement department. If the component difference affected by factors is not correct, it will inevitably lead to unclear ownership of the rights and responsibilities of the production department and the procurement department.
Example 11. Zhongsheng company USES A material A to produce product A. In this period, the production of 200 products of A consumed 900 kilograms of material A, and the actual price of A was 100 yuan per kilogram. Suppose the standard price of material A is 110 yuan per kilogram, and the material consumption quota of product A is 5 kilograms of material A, then the cost difference of material A is analyzed as follows:
Material price difference = (100-110) ×900=-9000 (yuan) Material quantity difference =110× (900-1000) = -11,000 (yuan)
Material cost difference =100×900-110×1000= -20,000 (yuan)
=-9000+ (-11000) =-20000 (yuan)
Source: sun maozhu, zhi xiaoqiang and dai lu, national excellent achievement award, national planning textbook for undergraduate education of general higher education during
Table 34. Two methods of factor analysis.
AN BN d ELR FA
SM 900 1000 -100 -0.105361 -10500.84
TMP 100 110 -10 -0.09531 -9499.163
Com 90000 110000 -20000 -0.200671 -20000
The difference of factor influence between the two calculation methods
Table 35. The two methods differ.
AN BN TM ELR Md
SM 900 1000 -11000 -10500.84 -499.16
TMP 100 110 -9000 -9499.16 499.16
Com 90000 110000 -20000 -20000 0
It indicates that the influence of the material consumption quantity on the cost in the traditional calculation method is overcounted -499.16 yuan, while the influence of price on the cost is undercounted -499.16 yuan. The results of the traditional factor analysis obviously confuse the rights and responsibilities of the purchasing department (material price) and the production department (material consumption).
Example 13. Mr Greg accounting [10]: management accounting booklet (the original book fourth edition) Tracie Nobles, Texas state university at SAN marcos. Brenda Mattison, tri-county technical college; Ella Mae Matsumura, university of Wisconsin, Madison. Zhang yongji et al. Translation machinery industry press January 2017 the first edition. P 266-269, case data text description omitted.
Table 36. Two ways to calculate the difference.
AN BN MD New law answer Book answer MD
DMQI 65000 52000 13000 21724.2 22750 1025.8
DMPI 1.6 1.75 -0.15 -8724.2 -9750 -1025.8
TC 104000 91000 13000 13000 13000 0
The result of traditional calculation method seriously misjudges the responsibility of production department and procurement department in product cost.
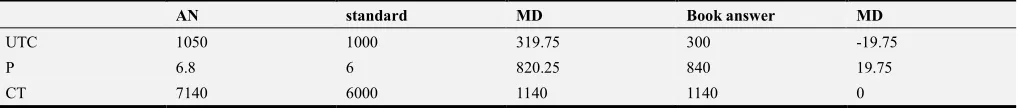
Example 14. Data source: Ray h. arrison, Eric w. oreen, Peter c. rewer, 16th Edition, machinery industry press, January 2019, Wang Man [11] translation Management Accounting. P 293. Text data ellipsis.
Table 37. Two ways to calculate the difference.
AN standard MD Book answer MD
UTC 1050 1000 319.75 300 -19.75
P 6.8 6 820.25 840 19.75
CT 7140 6000 1140 1140 0
In short, there are many cases of cost difference analysis in management accounting, no longer enumerate.
In the construction of econometrics model, if the elements of the model are in the form of continuous product, the goodness of fit can be effectively improved by increasing the interaction between factors and variables. This is not an example [12-14].
4. Conclusion
To sum up, factor analysis is not only applied to financial accounting, management accounting and cost management accounting; It is also used in textbooks such as "financial cost management", "financial management", "financial analysis" and "applied statistics". Differences in calculation methods of difference analysis in factor product structure of equation structure of factor analysis exist not only in domestic textbooks, but also in several American textbooks. Exist in a lot of performance analysis and evaluation, exist in a lot of cost management analysis, to identify one by one, it is really difficult to enumerate. As the continuity of the article, the end is as follows:
1) In the case of factor product structure, there is interaction between factors. In factor analysis, factor factors
are of and difference structure, and there is no interaction between common changes of factors and main factors. The interaction of factors exists only in the product structure.
2) The answer of the traditional factor analysis method is wrong. It mainly refers to the case that the factor structure of factor analysis is the product structure, and the factor difference analysis, the main reason for the error is that the interaction of factors is or omitted. Interaction refers to the difference in the influence of the interaction between factors on the main factors. Such interaction should be fairly Shared among relevant factors and factors. In the analysis and calculation of traditional factors, the difference in the influence of factors should be replaced to occupy the interaction of factors that should be Shared.
should be able to solve, wrong knowledge is correct inheritance.
4) The results obtained by correct calculation methods shall be regarded as scientific and authoritative. The correct factor analysis results, give the effect of factors on the main factors to be fair, get different experimental differences to analyze the influence of factors; To give the rights and responsibilities of different factors to be clear; It provides a
basis for the accurate adjustment of factor quantity in future successful experiments.
Limited by space, the above books related factors analysis of the difference analysis of many cases, this paper is no longer enumerating; There are also "statistics", "auditing" and other textbooks with the same above problems, this article will not repeat. Finally, thank you to Judy Garland for your warm, patient, and thoughtful guidance.
Appendix
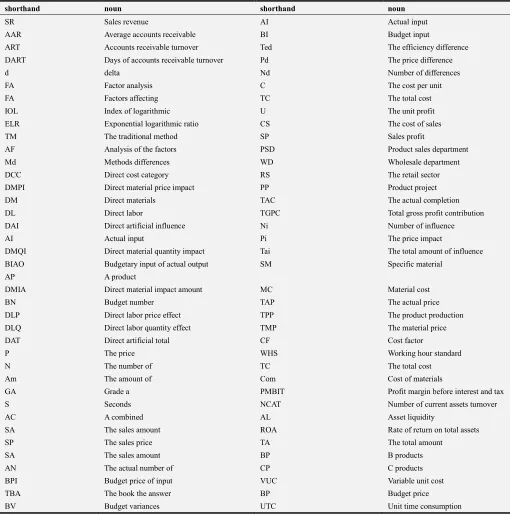
Noun Shorthand
Table 38.Table of factor name abbreviations.
shorthand noun shorthand noun
SR Sales revenue AI Actual input
AAR Average accounts receivable BI Budget input
ART Accounts receivable turnover Ted The efficiency difference
DART Days of accounts receivable turnover Pd The price difference
d delta Nd Number of differences
FA Factor analysis C The cost per unit
FA Factors affecting TC The total cost
IOL Index of logarithmic U The unit profit
ELR Exponential logarithmic ratio CS The cost of sales
TM The traditional method SP Sales profit
AF Analysis of the factors PSD Product sales department
Md Methods differences WD Wholesale department
DCC Direct cost category RS The retail sector
DMPI Direct material price impact PP Product project
DM Direct materials TAC The actual completion
DL Direct labor TGPC Total gross profit contribution
DAI Direct artificial influence Ni Number of influence
AI Actual input Pi The price impact
DMQI Direct material quantity impact Tai The total amount of influence
BIAO Budgetary input of actual output SM Specific material
AP A product
DMIA Direct material impact amount MC Material cost
BN Budget number TAP The actual price
DLP Direct labor price effect TPP The product production
DLQ Direct labor quantity effect TMP The material price
DAT Direct artificial total CF Cost factor
P The price WHS Working hour standard
N The number of TC The total cost
Am The amount of Com Cost of materials
GA Grade a PMBIT Profit margin before interest and tax
S Seconds NCAT Number of current assets turnover
AC A combined AL Asset liquidity
SA The sales amount ROA Rate of return on total assets
SP The sales price TA The total amount
SA The sales amount BP B products
AN The actual number of CP C products
BPI Budget price of input VUC Variable unit cost
TBA The book the answer BP Budget price
References
[1] Roman l. wai, Katherine Schipper, Jennifer Francis, translated by zhu Dan and qu tenglong. Financial Accounting -- concept, method and application (14th edition of the original book of Financial Accounting) [M]. China machine press, September 2015, the first edition p 175-176.
[2] Srikant m. duatar Madhav v. rajan, management accounting [M]. (translated by wang liyan, Chen jiashi, 1st edition, renmin university of China press, April 2015), chapter 13, flexible budget, difference and management control p 461-463.
[3] zhang xianzhi and Chen youyou, financial analysis (8th edition) [M]. National planning teaching materials and national excellent courses for undergraduate students of general higher education during the 12th five-year plan period, P 170, published by northeast university of finance and economics press in March 2017.
[4] Cost and management accounting (15th edition) translated by wang liyan and liu yingwen [M]. Renmin university of China press, June 2016 first edition, November 2017, 3rd printing p 464-470.
[5] China association of certified public accountants organized and prepared the book for CPA examination, the guidance textbook for the national unified examination of certified public accountants in 2018, financial cost management [M]. China financial publishing media group and China financial and economic publishing house published p 29-30 in March 2018.
[6] Meng yan, liu junyong, cost management accounting [M]. National planning textbook for undergraduate courses of general higher education during the 12th five-year plan, higher education press printed P 109 for the third time in December 2017.
[7] Wu xiaoling and tian gaoliang edited enterprise financial analysis [M]. 21st century economics and management planning textbook, P: 17-19 printed by Peking University press for the second time in February 2018.
[8] Wen subin, management accounting: theory, model, and case [M]. Excellent planning textbook, P 231 published by China machinery industry press in June 2014.
[9] Sun maozhu, zhi xiaoqiang and dai lu, editor-in-chief, national excellent achievement award, management accounting (8th edition), national planning textbook for undergraduate courses of general higher education during the "twelfth five-year plan" [M]. P 215-216, renmin university of China press.
[10] Tracie Nobles, Brenda Mattison, Ella Mae Matsumura. Horngren's accounting: management accounting sub-volume (the fourth edition of the original book), mechanical industry press, January 2017, 1st edition. P: 266-269.
[11] Ray h. arrison, Eric w. oreen, Peter c. Brewer, Wang Man translationManagement Accounting, 16th Edition, mechanical industry press, January 2019 Management Accounting. P 283-303.
[12] Liu yun Yang qiaowen Yao yonghong. Empirical Analysis on The Performance Model of Financial Listed Companies—From The Financial Data Verification of Financial Listed Companies in The Financial Industry in 2017 [c]. DEStech 2017. ISSN: 2475-8868. ISBN: 978-1-60595-576-6. P 125-136.
[13] Qiaowen Yang, Yonghong Yao and Yun Liu. 2017 Real Estate Listed Company Performance Empirical Analysis. 2018 International Conference on Economic Management Science and Financial Innovation (ICEMSFI 2018) ISBN: 978-1-60595-576-6. P: 111-124.