A promising and simple method to quantify soil/manure
mixing on beef feedlot pens
Chris Pratt
A,B, Matthew Redding
Aand Jaye Hill
AADepartment of Agriculture, Fisheries and Forestry, 203 Tor Street, Toowoomba, Qld 4350, Australia. BCorresponding author. Email: [email protected]
Abstract. On beef cattle feed pen surfaces, fresh and decayed manure is mixed with base rock or soil (base). Quantifying this mixing has beneficial applications for aspects including nutrient and greenhouse gas budgeting. However, no practical methods exist to quantify mixing. We investigated if measuring element concentrations in: (A) fresh manure, (B) base material, and (C) pen manure offers a promising method to quantify manure/base mixing on pen surfaces. Using three operational beef feedlots as study sites, we targeted carbon (C), and silicon (Si), which are the two most abundant and easily measurable organic and inorganic elements. Our results revealed that C concentrations were strongly (>15 times) and significantly (P<0.05) higher whereas Si concentrations strongly (>10 times) and significantly (P<0.01) lower in fresh manure than base material at all three sites. These relative concentrations were not significantly impacted by manure decay, as determined by an 18-week incubation experiment. This suggested that both of these elements are suitable markers for quantifying base/manure mixing on pens. However, due to the chemical change of manure during decay, C was shown to be an imprecise marker of base/manure mixing. By contrast, using Si to estimate base/manure mixing was largely unaffected by manure decay. Thesefindings were confirmed by measuring C and Si concentrations in stockpiled pen surface manure from one of the sites. Using Si concentrations is a promising approach to quantify base/manure mixing on feed pens given that this element is abundantly concentrated in soils and rocks.
Additionalkeywords: beefcattle,carbon,feedlots,manure,rock,silicon,soil.
Received19August2014,accepted28January2015,publishedonline 1 May 2015
Introduction
Beef feedlots are used for finishing cattle from pastures, particularly in the USA, Canada and Australia. In Australia it is estimated that 5% of the total beef cattle population (23 million) is on feedlots at any time (Australian-Govt2012). In the USA, ~20 million cattle are raised on feedlots annually (Roggeet al. 2006). Feedlot pens directly overlay native soil or a base of imported crushed rock material, often in the absence of bedding material.
Although feed pen surfaces have been reported to be dominated by manure (Durso et al. 2011), they may contain significant quantities of base rock/soil (herein referred to as base material) (Larneyet al.2006; Garcíaet al.2012). No practical methods exist for quantifying base material/manure mixing on pen surfaces. Uncertainty regarding the extent of base material mixing with manure causes mass balance problems infields such as nutrient and carbon (C) budgeting (Dantzman et al.1983; Eghballet al.1997), and greenhouse gas emission measurement where emissions from pad manure are often reported on a manure weight basis without necessarily accounting for the amount of soil/rock mixed in with it (Haoet al.2001; Patteyet al.2005). Indeed, the need for quantifying base material mixing with manure on feedlots has arisen in studies examiningin situsoil profiles in feedlot pens (Mielkeet al.1974; Dantzmanet al.1983;
Berry and Miller 2005; García et al. 2012) as well as investigations into characterising manure hauled from feedlot pens (Larneyet al.2000; Roggeet al.2006).
Using a marker element displaying a strong concentration contrast in base material relative to manure, or vice versa, could provide a useful approach to quantify mixing and assist with resolving this problem. Carbon is the most abundant and easily measurable organic element. Carbon concentrations in beef cattle manures have been reported to range between 34% (Hao et al.2001) and 46% dry weight (Helgasonet al.2005) whereas C concentrations in topsoils generally range from 1.5% (Cremers et al.2001) to 8.5% (Tateet al. 2007) dry weight with an average concentration of 2.5% dry weight (Shacklette and Boerngen1984).
The most abundant inorganic element is silicon (Si) whose global-scale soil/rock concentration has been reported to be 27% dry weight (Shacklette and Boerngen1984; Faure1998). Only one study was found reporting beef cattle manure Si concentrations [9.5% dry weight by Kobayashiet al. (2008)]. It is unclear whether this was fresh manure or pen manure.
The large manure/soil concentration differences for C and Si, initially suggest that both these elements could offer a practical opportunity to quantify mixing on pen surfaces. To use this concentration contrast to evaluate mixing ratios, sampling and
Journal compilationCSIRO 2015 www.publish.csiro.au/journals/an
The State of Queensland (through the Department of Agriculture, Fisheries and Forestry Queensland) 2015
CSIROPUBLISHING
analysis of three representative materials would be required at a given feedlot: (A) fresh manure, (B) underlying base material; and (C) pen surface material, (which contains fresh and degraded manure as well as base material). In this work we assess if measuring C and Si concentrations offers a promising approach to quantify base/manure mixing on beef feedlot pen surfaces.
Methods
Study sites, sample collection and preparation
The three feedlots are located on the Darling Downs, 150 km west of Brisbane, Australia. Site A’s herd size is 17 000 with a stocking density of 15 m2/head. Feed materials include barley and sorghum. The feedlot pens are constructed on soils native to the region (i.e. black Vertosol derived from weathering of mafic parent material). Manure from the pens is worked into a mound in the middle of the pen and removed every 4–6 months to a stockpiling site. Site B has an average herd size of 28 000 with a stocking density of 15 m2/head. The cattle receive a mixed ration diet comprising ~65% grain with the remainder consisting of wet distiller’s grain (ethanol byproduct), molasses, and cotton products. Site C’s herd size is 26 000 with a stocking density of 9–12 m2/head. Diet includes molasses, wheat, barley, sorghum, corn silage, cereal silage, cotton seed, cotton seed hulls, cotton seed meal, cereal hay, and sorghum. The pens at Site B and C overlie crushed rock from local quarries (alluvial weathered basalt at Site B and Ca-Mg rich conglomerate at Site C). Manure from the pens at these feedlots is scraped out every few weeks using a box scraper.
We were permitted access to one pen at each of the three sites. A 1-kg composite sample of fresh manure, observed to be deposited at the time of sampling, was collected from each site. These manure subsamples were taken from at least five deposits at each site. Care was taken to avoid scraping pen manure into the fresh samples. One-kilogram samples of the base material (i.e. soil for Site A and rock for Sites B and C) from each feedlot were obtained using material combined from six cores (to 20 cm depth) at each site. In addition to the fresh manure samples and soil/rock samples, a 1-kg composite manure sample was collected from a 250-m3stockpile of manure scraped from the pens at Site A. The composite sample was acquired from six cored subsamples at a depth of 1.5 m in the 1-day-old pile; with each core extracting ~150 g of manure. Each material was homogenised using a mechanical mixer. Batches of each material were collected and refrigerated for further experimentation and analysis.
Fresh manure decay experiment
Five-hundred grams (wet weight) of homogenised fresh manure from Sites A and B, and 250 g of manure from Site C (where less fresh manure was available), was split into 12 equal-weight batches. These batches were loosely packed into 50-mL open-topped plastic containers. These were placed inside a 35C incubator in order to assess dry mass loss from manure under warm conditions: optimal for respiration rates in manures and soils (Sikora and Sowers1985; Murwiraet al.1990; Keithet al. 1997). The containers were left in the incubator for 18 weeks (126 days), i.e. the average maximum clean-out period for manure
on pens in Queensland (Skerman2004) and representative of typical clean-out periods for pens in the USA (Dantzmanet al. 1983). The experiment represents a decay simulation for pen-deposited manure with the aim to estimate the impact of decay on manure C and Si concentrations.
Deionised (to avoid possible elemental contamination) water was used to adjust manure moisture contents between almost dry (<5% by dry weight) and starting levels, which would be expected underfield conditions. Manure batches were removed from the incubator at regular intervals (see Fig.1for timing), as sacrificial replicates, and measured for their dry matter content by oven-drying the samples overnight at 105C and recording weight loss. In addition to the above, sacrificial replicates of each manure were taken from the incubator and set aside for chemical analysis at various times (see Results and Discussion for timing).
Chemical analyses
Chemical analyses were performed on manure and soil/rock samples. Total (Dumas) C was analysed using a Leco analyser following the Dumas dry combustion principle where samples are combusted at 1050C. This method has been well described in previous work (Buckee1994). X-rayfluorescence spectroscopy was used to analyse for Si concentrations in the samples. Chemical analyses were performed in triplicate on the fresh manure, the stockpiled manure from Site A and soil/rock samples from each site.
Quality control
Lower detection limits for the elemental analyses conducted in this study are presented in Table 1. The table also shows recoveries of element concentrations for reference standard samples analysed by the laboratory.
Statistical analyses
Expanded regression (GENSTAT) was used to determine means
of the manure C and Si concentrations at time 0, half way
100
80
60
40
Mass remaining %
20
Site A + R2 = 0.96
Site B • R2 = 0.96
Site C × R2 = 0.90
0
0 20 40 60 80
Days
100 120
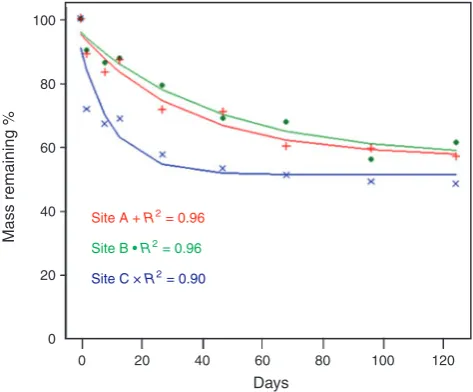
Fig. 1. Mass loss due to biological decay for fresh manures. Points are sacrificial replicates; decay curvesfitted using classic decay equation.R2
values show correlation of empirical data to equation.
through the decay experiment (63 days) and at the end (126 days). ANOVA was then applied to the data to determine the statistical significance of the differences in relative concentrations of elements between the manure and the soil/rock across all three sites. A P-value of <0.05 was considered significant. Confidence intervals (CI) to describe the variability in element concentrations during decay were determined using Excel, employing the equation:
CI upper; lower¼ 1:96·ðs:d:=HnÞ ð1Þ
Where, s.d. = standard deviation,n= sample number, and 1.96 is the critical value for the 95% CI.
Results and discussion
Dry mass losses for each of the manures during the incubation are plotted in Fig. 1. Manures from all three feedlots lost ~40–50% of their dry mass (Fig.1).
Mass loss for each manure type was well described by the classic exponential decay model. Most mass loss (>two-thirds) occurred in thefirst month, demonstrating that the composition of manure deposited on feedpads can change rapidly. In order to assess how biological decay affected the manures’composition, we recorded C and Si concentrations at various times during the decay experiment. The data is presented in Table1. Changes in C concentrations during decay were significant (P<0.05).
Carbon values tended to increase initially and then fall back to initial levels (Table 2). This trend might seem surprising as substantial C losses from manure have been reported during decay and composting processes (Kirchmann and Witter1992; Larneyet al.2005). Yet, in this study the manure’s starting C concentrations were greater than typical carbohydrate C concentrations (40%). Thus, it makes sense that as carbohydrates in manure are initially consumed for respiration the overall manure C concentration would go up. This would be exacerbated by the loss of other volatiles with even lower C contents, such as urea, ammonia, and fermentation products all of which have been reported in cattle manure (Miller and Varel 2002; Coleet al.2005; Prattet al.2014). Later during decay, as more complex C compounds are consumed in biological processes and the ash content increases relative to the volatile content, manure C concentrations would drop, which was observed in our work.
Silicon concentrations tended to increase during decay (Table 2), which was expected given that it is a non-volatile element; although Si concentration changes were not significant (P > 0.05). Using the elemental concentrations of the base material given in Table3and the manure data in Table 2, we calculated differences in relative concentrations of elements between the manure and the soil/rock across all three sites (Table 4). The relative concentration ratios are expressed as enrichments in base material relative to manure for Si
Table 1. Quality control data for element analyses
Element Lower detection limit%
Reference sample 1 –% deviation from target concentration
Reference sample 2 –% deviation from target concentration
Reference sample 3 –% deviation from target concentration
Carbon 0.01 5.3 5.0 0.3
Silicon 0.01 3.9 4.0 3.8
Table 2. Concentrations of carbon and silicon in the studied manures, as affected by biological decay (reported on a dry weight basis) for sacrificial replicate samples
Laboratory error given in parentheses. IS, insufficient sample for analyses
Site Days Significance of change
0 12 26 67 126
Carbon % A 41.5 (1.47) 53.3 (1.88) 47.9 (1.69) 41.2 (1.46) 41.2 (1.46) – B 44.2 (1.56) 44.9 (1.59) 49.7 (1.76) 41.7 (1.47) 42.2 (1.49) P<0.05 C 41.5 (1.47) 68.4 (2.42) 48.5 (1.71) 43.4 (1.53) 43.6 (1.54) – Silicon % A 1.84 (0.07) 1.91 (0.07) 2.02 (0.08) IS 2.53 (0.10) –
B 0.54 (0.02) 0.97 (0.04) 1.29 (0.05) IS 1.15 (0.04) None C 1.02 (0.04) 0.92 (0.04) 1.05 (0.04) IS 1.42 (0.06) –
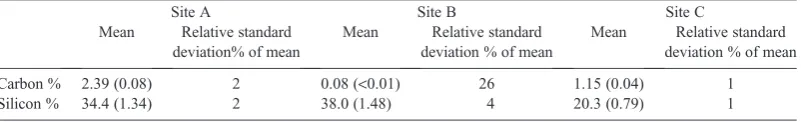
Table 3. Composition of base material at the studied sites
Average values of triplicate analyses. Laboratory error given in parentheses for means
Site A Site B Site C
Mean Relative standard deviation% of mean
Mean Relative standard deviation % of mean
Mean Relative standard deviation % of mean
Carbon % 2.39 (0.08) 2 0.08 (<0.01) 26 1.15 (0.04) 1
Silicon % 34.4 (1.34) 2 38.0 (1.48) 4 20.3 (0.79) 1
(i.e. base material element concentration/manure element concentration) and vice versa for C (i.e. manure element concentration/base material element concentration).
Based on data in Table4it appears that the strong relative concentration differences in C and Si between manure and base
materials are not impacted by manure decay and, thus, both of these elements could be effectively used to estimate mixing on feedlot pen surfaces. However, it is important not only to consider how manure decay affects relative concentrations but also how it affects the application of these contrasts to quantify
Table 4. Concentration ratios for silicon and carbon between base material and manure across sites over time
Calculated from the rock/soil means in Table3and thefitted means of manure concentrations in Table2determined using expanded regression (GENSTAT)
Element Site Concentration ratio Significance Average concentration ratio Day 0 Day 63 Day 126 of contrast across site and days
Carbon A 19.8 18.9 17.0 P<0.01 200
B 576 549 495 P<0.05
C 44.4 42.5 38.7 P<0.01
Silicon A 19.0 14.5 14.3 P<0.01 19.6
B 52.7 29.6 28.9 P<0.01
C 24.3 14.5 14.2 P<0.01
60
Site A Site B
Site C
40
50
40
30
20
10
0
50 60
70 25
20
15
10
5
0 40
30
20
10
0 35 30 25 20 15 10 5 0
40 35 30 25 20 15 10
Si% in pen surf
ace sample
Si% in pen surf
ace sample
Si% in pen surf
ace sample
5 0 50
40
30
20
10
10 20 30 40 50 60 70 80 90100
C% in pen surf
ace sample
C% in pen surf
ace sample
C% in pen surf
ace sample
0
0 0 10 20 30 40 50 60 70 80 90 100
10 20 30 40 50 60 70 80 90 100
0 0 10 20 30 40 50 60 70 80 90 100 10 20 30 40 50 60 70 80 90 100
% rock in sample
% rock in sample % rock in sample
% soil in sample % soil in sample % rock in sample
0 0 10 20 30 40 50 60 70 80 90 100
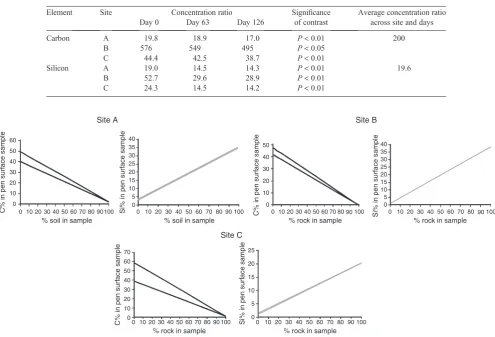
Fig. 2. Models depicting percentage of rock/soil material mixed with manure on pen surfaces as a function of carbon and silicon in hypothetical pen manure samples at the three studied sites. The two lines in each graph represent upper and lower variability (95% confidence level) in manure concentrations as affected by decay.
60 40
35
30
25
20
15
10
5
0 50
40
30
C% in stoc
kpile sample
Si% in stoc
kpile sample
% soil in stockpile 20
10
0
0 10 20 30 40 50 60 70 80 90 100 0 10 20 30 40 50 60 70 80 90 100
Fig. 3. Applying the mixing model for Site A to estimate the proportion of soil mixed into a stockpile of pen manure from that site.
manure/base material mixing. To investigate this, we developed simple mixing models using our data (Fig.2). The ratio of fresh to fully decayed manure in a given feed pen surface sample will likely be a continuum between the two extremes. In our models we represent this uncertainty by plotting upper and lower estimates of manure/base material mixing relationships using the width of the two-tail CI (95%) in element concentrations observed in the decay trial using Eqn 1.
It is evident that the precision of quantifying base material/ manure mixing using C concentrations is poor, due to the effect of manure decay on C concentrations (Fig.2). By contrast, Si yields a more precise estimate of base material/manure mixing on pen surfaces at each site (Fig. 2). To check our model approach, we applied C and Si concentrations measured in stockpiled manure from the pen surfaces at Site A to the mixing model generated for that site (Fig. 3). The average C and Si concentrations in the triplicate stockpile samples were 27% (RSD = 2%) and 10.5% (RSD = 10%) on a dry weight basis. It can be seen that using both elements yielded good agreement regarding the amount of soil (~30%) mixed in with the pen manure (Fig. 3). However, the precision using C concentrations was much poorer than that given by using Si concentrations (Fig.3). The high proportion of base soil in the pen manure highlights the importance of quantifying manure/base mixing.
Although the current demonstration is based on limited data (three sites) we suggest that the use of Si concentrations quantify manure/base material mixing has widespread potential given the global concentration of Si in rocks and soils. Aluminium would be another potentially strong marker element given the literature shows vastly greater soil/rock Al contents on a global scale (Shacklette and Boerngen 1984; Faure 1998) compared with beef manure (Eghball and Power1993; Chenet al.2003; Ajiboye et al. 2004; Miller et al. 2013). In some locations, notably limestone landscapes, which are dominated by Ca, Mg and C, Si and Al would not be useful markers for estimating base/manure mixing on feedlots. In these cases background research could point to the use of other suitable element markers (e.g. Ca, Mg) to estimate base/manure mixing.
Conclusions
Our study showed that measuring Si concentrations offers a promising and simple method for quantifying manure/base material on beef feedlot pen surfaces. Based on ourfindings, as well as literature data, we suggest that this method has widespread potential due to the abundant global concentration of Si in soils and rocks. By contrast, using carbon and organic compounds to estimate mixing is not recommended because they are affected too much by manure decay. Accurate quantification of base material mixing with manure on pen surfaces will assist in fields such as greenhouse gas and nutrient budgeting within beef feedlots.
Acknowledgements
This research was funded by the Australian Government, University of Queensland, Meat and Livestock Australia, Australian Pork Limited, Rural Industries Research and Development Corporation and Australian Egg Corporation Limited as part of the National Agricultural Manure Management Program. We are grateful for advice from Janine Price, Ray
King and Ian Kruger. Thanks to David Mayer for statistical analysis and Jarl Devereux for sampling and analysis assistance.
References
Ajiboye B, Akinremi OO, Racz GJ (2004) Laboratory characterization of phosphorus in fresh and oven-dried organic amendments.Journal of Environmental Quality33(3), 1062–1069. doi:10.2134/jeq2004.1062
Australian-Govt (2012) Australian National Greenhouse Accounts–National Inventory Report 2010 Volume 1. (Canberra)
Berry ED, Miller DN (2005) Cattle feedlot soil moisture and manure content: cattle feedlot soil moisture and manure content: II. Impact on Escherichia coli O157. Journal of Environmental Quality 34(2), 656–663. doi:10.2134/jeq2005.0656
Buckee GK (1994) Determination of total nitrogen in barley, malt and beer by Kjeldahl procedures and the Dumas combustion method: collaborative trial.Journal of the Institute of Brewing. Institute of Brewing (Great Britain)100(2), 57–64.
Chen S, Harrison JH, Liao W, Elliott DC, Liu C, Brown MD, Wen Z, Solana AE, Kincaid RL, Stevens DJ (2003) Value-Added Chemicals from Animal Manure, Department of Energy, USA. (Springfield, VA) Cole NA, Clark RN, Todd RW, Richardson CR, Gueye A, Greene LW,
Mcbride K (2005) Influence of dietary crude protein concentration and source on potential ammonia emissions from beef cattle manure123.
Journal of Animal Science83(3), 722–731.
Cremers DA, Ebinger MH, Breshears DD, Unkefer PJ, Kammerdiener SA, Ferris MJ, Catlett KM, Brown JR (2001) Measuring total soil carbon with Laser-Induced Breakdown Spectroscopy (LIBS). Journal of Environmental Quality30(6), 2202–2206. doi:10.2134/jeq2001.2202
Dantzman CL, Richter MF, Martin FG (1983) Chemical elements in soils under cattle pens.Journal of Environmental Quality12(2), 164–168. doi:10.2134/jeq1983.00472425001200020002x
Durso LM, Harhay GP, Smith TP, Bono JL, Desantis TZ, Clawson ML (2011) Bacterial community analysis of beef cattle feedlots reveals that pen surface is distinct from feces.Foodborne Pathogens and Disease8(5), 647–649. doi:10.1089/fpd.2010.0774
Eghball B, Power JF (1993) Management of manure from beef cattle in feedlots and from minor classes of livestock, United States Department of Agriculture. (Washington, DC)
Eghball B, Power JF, Gilley JE, Doran JW (1997) Nutrient, carbon, and mass loss during composting of beef cattle feedlot manure. Journal of Environmental Quality 26(1), 189–193. doi:10.2134/jeq1997.004724 25002600010027x
Faure G (1998)‘Principles and applications of geochemistry.’2nd edn. (Prentice-Hall Inc.: Upper Saddle River, NJ)
García AR, Maisonnave R, Massobrio MJ, Fabrizio De Iorio AR (2012) Field-scale evaluation of waterfluxes and manure solution leaching in feedlot pen soils.Journal of Environmental Quality41(5), 1591–1599. doi:10.2134/jeq2011.0320
Hao X, Chang C, Larney FJ, Travis GR (2001) Greenhouse gas emissions during cattle feedlot manure composting Lethbridge Research Centre Contribution No. 3870031.Journal of Environmental Quality30(2), 376–386. doi:10.2134/jeq2001.302376x
Helgason BL, Larney FJ, Janzen HH (2005) Estimating carbon retention in soils amended with composted beef cattle manure.Canadian Journal of Soil Science85(1), 39–46. doi:10.4141/S04-049
Keith H, Jacobsen KL, Raison RJ (1997) Effects of soil phosphorus availability, temperature and moisture on soil respiration inEucalyptus pauciflora forest. Plant and Soil 190(1), 127–141. doi:10.1023/ A:1004279300622
Kirchmann H, Witter E (1992) Composition of fresh, aerobic and anaerobic farm animal dungs. Bioresource Technology 40(2), 137–142. doi:10.1016/0960-8524(92)90199-8
Kobayashi N, Morioka M, Komiyama T, Ito T, Saigusa M (2008) Silicon content in livestock manure compost and a simple estimation method for
it (in Japanese with English summary).Journal of the Japan Society of Waste Management Experts19, 150–154. doi:10.3985/jswme.19.150
Larney FJ, Olson AF, Carcamo AA, Chang C (2000) Physical changes during active and passive composting of beef feedlot manure in winter and summer. Bioresource Technology 75(2), 139–148. doi:10.1016/ S0960-8524(00)00040-7
Larney FJ, Ellert BH, Olson AF (2005) Carbon, ash and organic matter relationships for feedlot manures and composts.Canadian Journal of Soil Science85(2), 261–264. doi:10.4141/S04-060
Larney FJ, Buckley KE, Hao X, Mccaughey WP (2006) Fresh, stockpiled, and composted beef cattle feedlot manure.Journal of Environmental Quality35(5), 1844–1854. doi:10.2134/jeq2005.0440
Mielke LN, Swanson NP, Mccalla TM (1974) Soil profile conditions of cattle feedlots.Journal of Environmental Quality3(1), 14–17. doi:10.2134/ jeq1974.00472425000300010004x
Miller DN, Varel VH (2002) An in vitro study of manure composition on the biochemical origins, composition, and accumulation of odorous compounds in cattle feedlots. Journal of Animal Science 80(9), 2214–2222.
Miller JJ, Beasley B, Drury C (2013) Transport of metals (Al, Fe) and trace elements (Cu, Mo, Ni, and Zn) through intact soil cores amended with fresh or composted beef cattle manure for nine years.Compost Science & Utilization 21(2), 99–109. doi:10.1080/1065657X.2013. 836067
Murwira HK, Kirchmann H, Swift MJ (1990) The effect of moisture on the decomposition rate of cattle manure.Plant and Soil122(2), 197–199. doi:10.1007/BF02851975
Pattey E, Trzcinski MK, Desjardins RL (2005) Quantifying the reduction of greenhouse gas emissions as a result of composting dairy and beef cattle manure. Nutrient Cycling in Agroecosystems72(2), 173–187. doi:10.1007/s10705-005-1268-5
Pratt C, Redding M, Hill J, Mudge SR, Westermann M, Paungfoo-Lonhienne C, Schmidt S (2014) Assessing refrigerating and freezing effects on the biological/chemical composition of two livestock manures.Agriculture, Ecosystems & Environment 197, 288–292. doi:10.1016/j.agee.2014. 08.012
Rogge WF, Medeiros PM, Simoneit BRT (2006) Organic marker compounds for surface soil and fugitive dust from open lot dairies and cattle feedlots.Atmospheric Environment 40(1), 27–49. doi:10.1016/ j.atmosenv.2005.07.076
Shacklette HT, Boerngen J (1984) Element concentrations in soils and other surficial materials of the conterminous United States. US Geological Survey. (United States Government Printing Office: Washington, DC)
Sikora LJ, Sowers MA (1985) Effect of temperature control on the composting process1. Journal of Environmental Quality 14(3), 434–439. doi:10.2134/jeq1985.00472425001400030025x
Skerman A (2004) Reference manual for the establishment and operation of beef cattle feedlots in Queensland. Queensland, Australia, Department of Primary Industries and Fisheries. (Brisbane)
Tate KR, Ross DJ, Saggar S, Hedley CB, Dando J, Singh BK, Lambie SM (2007) Methane uptake in soils from Pinus radiata plantations, a reverting shrubland and adjacent pastures: effects of land-use change, and soil texture, water and mineral nitrogen. Soil Biology and Biochemistry 39(7), 1437–1449. doi:10.1016/j.soilbio.2007.01.005
F Animal Production Science C. Prattet al.