International Journal of Integrated Engineering – Special Issue on Electrical Electronic Engineering
Vol. 9 No. 4 (2017) p. 32-36
Inverse Problem: Comparison between Linear
Back-Projection Algorithm and Filtered Back-Back-Projection Algorithm
in Soft-Field Tomography
Yasmin Abdul Wahab
1, Ruzairi Abdul Rahim
2,3*, Mohd Hafiz Fazalul
Rahiman
4, Suzzana Ridzuan Aw
3,5, Fazlul Rahman Mohd Yunus
3, Jaysuman
Pusppanathan
3,6, Nor Muzakkir Nor Ayob
3, Leow Pei Ling
3, Herlina Abdul
Rahim
3, Ida Laila Ahmad
2, Ariffuddin Jonet
2, Chia Kim Seng
2, Tee Kian Sek
21Department of Instrumentation & Control Engineering (ICE), Faculty of Electrical & Electronics Engineering,
Universiti Malaysia Pahang, 26600, Pekan, Pahang Malaysia
2Instrumentation and Sensing Technology Focus Group, Faculty of Electrical & Electronic Engineering, Universiti
Tun Hussein Onn Malaysia (UTHM), Johor. Email : [email protected]
3Process Tomography and Instrumentation Engineering Research Group (PROTOM-i), Faculty of Electrical
Engineering, Universiti Teknologi Malaysia, 81310 UTM Johor Bahru, Johor Malaysia
4Tomography Imaging Research Group, School of Mechatronic Engineering, Universiti Malaysia Perlis, 02600 Arau,
Perlis, Malaysia
5Faculty of Electrical & Automation Engineering Technology, Terengganu Advance Technical Institute University
College (TATiUC), Jalan Panchor, Telok Kalong, 24000 Kemaman, Terengganu, Malaysia
6Faculty of Biosciences and Medical Engineering, Universiti Teknologi Malaysia, 81310 UTM Johor Bahru, Johor
Malaysia
1.
Introduction
The image reconstruction of process tomography, can be divided into two parts: forward problem and inverse problem [1]. The forward problem is solved first in order to know the theoretical value of each of the sensors output based on the signal projection, while the algorithm is solved later in the inverse problem to obtain a tomogram. After the sensitivity map of the system solved, the tomogram is obtained by using either non-iterative or iterative algorithm in the inverse problem part [2].
A non-iterative algorithm is a direct method of image reconstruction and back-projection algorithm is categorized as a non-iterative algorithm [3]. It is a famous technique in tomography application consisting of a Linear Back-Projection (LBP) algorithm and a filtered back-projection (FBP) algorithm. LBP is applied in many
tomography processes, such as in ultrasonic tomography [4]–[7], optical tomography [8]–[11], electrical resistance tomography [12]–[15] and electrical capacitance tomography [16]–[20]. The advantages of the LBP algorithm is its low computational complexity, and it can generate an image at high speed [21]. In reconstructing the image using LBP, each sensitivity matrix is multiplied with it corresponding sensor reading [22]. The back projected data values are smeared back across the unknown density function (image) and overlap each other to increase the projection data density [5]. Hence, the main disadvantage of LBP algorithm is that it produces a blurred image, also known as the smearing effect [23].
The FBP algorithm is used to sharpen the reconstructed image obtained from the LBP algorithm [24]. It is applied mostly in hard-field tomography
Abstract: An image reconstruction algorithm in process tomography is very important in ensure that the reconstructed image is satisfied. The back-projection algorithm is the most popular algorithm applied in process tomography including a linear back-projection (LBP) algorithm and a filtered back-projection (FBP) algorithm. The objectives of this paper are: (1) to compare the result from LBP and FBP algorithm in soft-field tomography, and (2) to investigate the effect of FBP algorithm to a reconstructed image in soft-field tomography. Also, a comparison between hard-field tomography (ultrasonic tomography) and soft-field tomography (electrical resistance tomography, ERT) had been discussed in this paper. The ERT had been conducted based on a simulation using COMSOL Multiphysics live link with MATLAB software. As a result, a nature behavior of soft-field gave a main factor of inaccurate position of reconstructed image using FBP algorithm. When it multiplied with the concentration profile from LBP result, a “hill” surface sensitivity distribution and a color scale shifted in FBP gave inaccurate result. Therefore, it is believed that it gave a reason of why the FBP algorithm is not the concern on reconstructing image in soft-field tomography.
Keywords: Non-iterative algorithm, filtered back-projection, linear back-projection, hard-field, soft-field
compared to soft-field tomography such as in ultrasonic tomography [25]–[27] , X-ray tomography [28]–[30] and optical tomography [8], [31], [32], but was only discussed in electrical impedance tomography in 1992 [33].
Therefore, this paper compares the reconstructed images obtained from LBP and FBP algorithms in soft-field tomography, and investigates a factor of FBP algorithm is not widely applied in the soft-field tomography compared in the hard-field tomography. The comparison is made based on non-invasive electrical resistance tomography and ultrasonic tomography system.
2.
Methodology
The FBP algorithm in this paper was based on M. H. Fazalul Rahiman [25] that is applied in ultrasonic tomography application. This filter matrix has the same dimension as the sensitivity matrix so that it produces a weighting for the individual pixel. Hence, it can produce a uniform concentration profile for equal sensor output. The filter matrix, F is expressed by Equation 1 [25].
W
P
F
m (1)where Pm is the maximum pixel magnitude in total
matrix, W. Therefore, the FBP algorithm can be solved by multiplying the filter matrix by the LBP result [25]:
)
,
(
)
,
(
)
,
(
x
y
F
x
y
G
x
y
G
FBP
LBP (2)where
G
FBP(
x
,
y
)
is the FBP concentration profile, andG
LBP(
x
,
y
)
is the LBP concentration profile and it can be expressed by Equation 3 [22].
N Tx N Rx Rx Tx Rx TxLBP
x
y
M
x
y
S
G
1 1 , ,(
,
)
)
,
(
(3))
,
(
,x
y
M
TxRx is the normalized sensitivity matrice for the view of Tx,Rx, is the sensor loss amplitude of receiver Rx th for projection Tx th and N is the number of sensors or electrodes applied.A soft-field tomography in this paper is based on current research on non-invasive electrical resistance tomography. Sixteen electrodes are applied on the periphery of pipe wall non-invasively and it had been simulated using COMSOL Multiphysics live link with MATLAB software. Air was used as gas phantom so that it gives same material applied in Ref. [25].
3.
Results and Discussion
A hard-field tomography in this paper is referred from Ref. [25]. A concentration profile of liquid-gas bubble column had been determined by using ultrasonic tomography. The reconstructed image from LBP had been improved using FBP algorithm. The results in Ref. [25] proved that the reconstructed image using FBP algorithm can remove the smearing effect of the image with its current position.
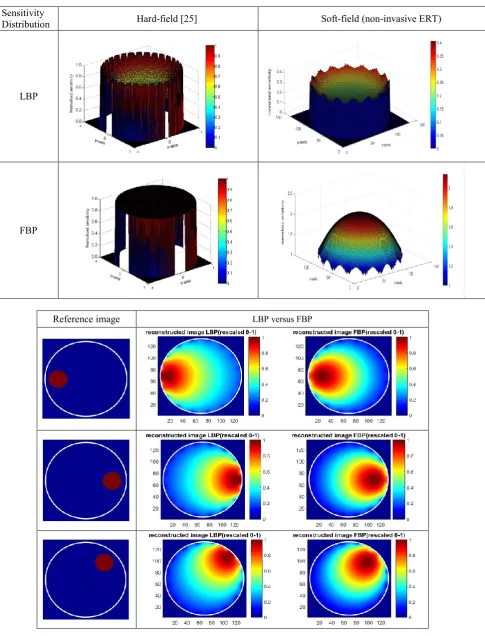
Nevertheless, if comparison is made between those sensitivity distributions for hard-field tomography and soft-field tomography (see Table 1); the distribution for soft-field tomography using FBP produces an inverse curve surface, while a flat surface of sensitivity distribution occurs in hard-field tomography. This is due to the nature of soft-field behavior that produces a curve line of each pair projections of the sensitivity map [34-35]. Thus, it makes the sensitivity distribution becomes a curve surface instead of a flat surface. Observation of the same pixel gives a higher pixel value resulting in color scale ratio changes. This give the color scale in FBP shifted. Consequently, it not produces a weighting for the sensitivity distribution.
As an example, tomograms with different positions for electrical resistance tomography system had been reconstructed as shown in Fig. 1. Comparisons between reconstructed images from LBP and FBP algorithm are clearly seen in Fig. 1. The position of the phantom from LBP algorithm can be identified. But, the size and shape of the phantom cannot be exactly as the reference image. When the phantom is placed near to the pipe wall, the shape and size of the reconstructed image affected due to the smearing effect and hence an ideal circle shape likes a reference image cannot be obtained.
However, the tomogram obtained for FBP is not accurate. The color scale ratio that changes in FBP influences the reconstructed image. It is believed that when every pixel from the curved filter matrix is multiplied with the LBP result, the color scale in FBP shifted.
4.
Conclusion
In this study, effect of reconstructed image using FBP algorithm for soft-field tomography had been discussed. It is believed that the nature of soft-field behavior gave a main factor of inaccurate reconstructed image obtained from the FBP algorithm. A “hill” surface produced by a filter matrix affects the final result of reconstructed image when it multiplied with LBP result. The reconstructed image is not accurate due to the color scale shifted when the FBP algorithm is applied to the electrical resistance tomography. Consequently, it is believed that it gave a reason of the FBP algorithm is not the main concern among researchers that conduct a research in soft-field tomography. However, more research work should be undertaken to investigate this problem.
Acknowledgement
Y A Wahab et al., Int. J. Of Integrated Engineering – Special Issue on Electrical Electronic Engineering Vol. 9 No. 4 (2017) p. 32-36
Table 1 Comparison sensitivity distribution between hard-field and soft-field tomography
Sensitivity
Distribution Hard-field [25] Soft-field (non-invasive ERT)
LBP
FBP
Reference image LBP versus FBP
Fig. 1 Example of comparison between reconstructed image using LBP versus FBP
References
[1] G. Dong, J. Zou, R. H. Bayford, X. Ma, S. Gao, W. Yan, M. Ge, and A. G. Equation, “The Comparison Between FVM and FEM for EIT Forward Problem,” IEEE Transactions on Magnetics, vol. 41, no. 5, pp. 1468–1471, 2005.
[2] Wael Abdelrahman Deabes, “Electrical Capacitance Tomography for Conductive Materials,” Tennessee Technological University, 2010.
[3] Z. Zakaria, “Non-Invasive Imaging of Liquid/Gas Flow using Ultrasonic Transmission Mode Tomography,” Universiti Teknologi Malaysia, 2007. [4] N. M. N. Ayob, S. Yaacob, Z. Zakaria, M. H. F. Rahiman, R. A. Rahim, and M. R. Manan, “Improving Gas Component Detection of An Ultrasonic Tomography System for Monitoring Liquid / Gas Flow,” in Proceedings of the 2010 6th IEEE International Colloquium on Signal Processing & Its Applications, 2010, pp. 278–282. [5] Z. Zakaria, M. H. Fazalul Rahiman, and R. Abdul
Rahim, “Simulation of the Two-Phase Liquid–Gas Flow through Ultrasonic Transceivers Application in Ultrasonic Tomography,” Sensors & Transducer, vol. 112, no. 1, pp. 24–38, 2010.
[6] M. H. Fazalul Rahiman, R. Abdul Rahim, and J. Pusppanathan, “Two-Phase Flow Regime Identification by Ultrasonic,” Sensors & Transducer, vol. 116, no. 5, pp. 76–82, 2010. [7] M. H. Fazalul Rahiman, R. Abdul Rahim, H. Abdul
Rahim, and N. M. Nor Ayob, “The Hardware Design Technique for Ultrasonic Process,” Sensors & Transducer, vol. 141, no. 6, pp. 52–61, 2012. [8] S. Z. Mohd Muji, R. Abdul Rahim, M. H. Fazalul
Rahiman, Z. Tukiran, N. M. Nor Ayob, E. J. Mohamad, and M. J. Puspanathan, “Optical Tomography: Image Improvement Using Mixed Projection of Parallel and Fan Beam Modes,” Measurement, vol. 46, no. 6, pp. 1970–1978, Jul. 2013.
[9] M. Wei, M. Tong, J. Hao, L. Cai, and J. Xu, “Detection of Coal Dust in A Mine Using Optical Tomography,” International Journal of Mining Science and Technology, vol. 22, no. 4, pp. 523– 527, 2012.
[10] S. Ibrahim, M. A. M. Yunus, R. G. Green, and K. Dutton, “Concentration Measurements of Bubbles in A Water Column using An Optical Tomography System,” ISA Transactions, vol. 51, no. 6, pp. 821– 826, 2012.
[11] J. Jamaludin, R. A. Rahim, H. A. Rahim, M. H. Fazalul Rahiman, S. Z. Mohd Muji, and J. M. Rohani, “Charge Coupled Device Based on Optical Tomography System in Detecting Air Bubbles in Crystal Clear Water,” Flow Measurement and Instrumentation, vol. 50, pp. 13–25, 2016.
[12] T. Dyakowski, L. F. C. Jeanmeure, and A. J. Jaworski, “Applications of Electrical Tomography for Gas–Solids and Liquid–Solids Flows — A
review,” Powder Technology, vol. 112, no. 3, pp. 174–192, 2000.
[13] P. Wang, B. Guo, and N. Li, “Multi-Index Optimization Design for Electrical Resistance Tomography Sensor,” Measurement, vol. 46, no. 8, pp. 2845–2853, 2013.
[14] B. Wang, W. Tan, Z. Huang, H. Ji, and H. Li, “Image Reconstruction Algorithm for Capacitively Coupled Electrical Resistance Tomography,” Flow Measurement and Instrumentation, vol. 40, pp. 216– 222, 2014.
[15] J. Sun and W. Yang, “Evaluation of Fringe Effect of Electrical Resistance Tomography Sensor,” Measurement, vol. 53, pp. 145–160, 2014.
[16] Z. Cui, H. Wang, C. Yang, D. Zhang, and Y. Geng, “Development and Application of ECT Digital System for Online Flow Measurement,” in Proceedings of the 2012 IEEE International Conference on Imaging Systems and Techniques Proceedings, 2012, pp. 599–604.
[17] E. J. Mohamad and R. Abdul Rahim, “Multiphase Flow Reconstruction in Oil Pipelines by Portable Capacitance Tomography,” in Proceedings of the 2010 IEEE SENSORS, 2010, pp. 273–278.
[18] W. Q. Yang and L. Peng, “Image Reconstruction Algorithms for Electrical Capacitance Tomography,” Measurement Science and Technology, vol. 14, pp. R1–R13, 2003.
[19] Y. Chen, L. Zhang, and D. Chen, “Two-Phase Flow Parameters Measurement and Image Reconstruction for Electrical Capacitance Tomography,” in Proceedings of the 2008 IEEE International Workshop on Education Technology and Training & International Workshop on Geoscience and Remote Sensing, 2008, pp. 680–684.
[20] M. J. Pusppanathan, F. R. Yunus, N. M. Nor Ayob, R. Abdul Rahim, and F. A. Phang, “A Novel Electrical Capacitance Sensor Design For Dual Modality,” Jurnal Teknologi, vol. 5, pp. 45–47, 2013.
[21] J. Lei and S. Liu, “Dynamic Inversion Approach for Electrical Capacitance Tomography,” IEEE Transactions on Instrumentation and Measurement, vol. 62, no. 11, pp. 3035–3049, 2013.
[22] S. Y. Nor Muzakkir Nor Ayob , Mohd Hafiz Fazalul Rahiman , Zulkarnay Zakaria , Ruzairi Abdul Rahim, “Eminent Pixel Reconstruction Algorithm for Ultrsonic Tomography,” Jurnal Teknologi, vol. 55, no. 2, pp. 15–22, 2011.
[23] W. Warsito and L. Fan, “Measurement of Real-Time Flow Structures in Gas–Liquid and Gas-Liquid– Solid on Systems using Electrical Capacitance Tomography (ECT),” Chemical Engineering Science, vol. 56, pp. 6455–6462, 2001.
[24] G. L. Zeng, “Image Reconstruction - A tutorial,” Computerized Medical Imaging and Graphics, vol. 25, pp. 97–103, 2001.
Y A Wahab et al., Int. J. Of Integrated Engineering – Special Issue on Electrical Electronic Engineering Vol. 9 No. 4 (2017) p. 32-36
[26] T. R. Hay, R. L. Royer, H. Gao, X. Zhao, and J. L. Rose, “A Comparison of Embedded Sensor Lamb Wave Ultrasonic Tomography Approaches for Material Loss Detection,” Smart Materials and Structures, vol. 15, no. 4, pp. 946–951, Aug. 2006. [27] E. V Malyarenko, J. S. Heyman, H. H. Chen-Mayer,
and R. E. Tosh, “Time-Resolved Radiation Beam Profiles in Water Obtained by Ultrasonic Tomography,” Metrologia, vol. 47, no. 3, pp. 208– 218, Jun. 2010.
[28] D. Sueseenak, T. Chanwimalueang, W. Narkbuekaew, K. Chitsakul, and C. Pintavirooj, “Cone-Beam X-Ray Tomography with Arbitrary-Orientation X-ray Tube,” in Proceedings of the 2006 1st IEEE Conference on Industrial Electronics and Applications, 2006, pp. 1–4.
[29] F. Meng, N. Zhang, and W. Wang, “Virtual Experimentation of Beam Hardening Effect in X-ray CT Measurement of Multiphase Flow,” Powder Technology, vol. 194, no. 1–2, pp. 153–157, 2009. [30] A. Contin and G. Schena, “3D Structural Analysis
of Ground-Wall Insulation of ac Rotating Machines Using X-Ray Tomography,” in Proceedings of the IEEE International Conference on Solid Dielectrics, 2013, pp. 279–282.
[31] K. S. Chan, “Real Time Image Reconstruction for Fan Beam Optical Tomography System,” Universiti Teknologi Malaysia, 2002.
[32] M. Madec, J.-B. Fasquel, W. Uhring, and P. Joffre, “Optical Implementation of The Filtered Backprojection Algorithm,” Optical Engineering, vol. 46, no. 10, pp. 1–16, Oct. 2007.
[33] D. C. Barber, B. H. Brown, and N. J. Avis, “Image Reconstruction in Electrical Impedance Tomography Using Filtered Back Projection,” in Proceedings of the Annual International Conference of the IEEE Engineering in Medicine and Biology Society, 1992, pp. 1691–1692.
[34] S. Mohammad, “Segmented Excitation for Electrical Capacitance Tomography,” Universiti Teknologi Malaysia, 2012.
[35] Pusppanathan, J., et al. . "Single-Plane Dual