ARTICLE
Pervasive Behavior Problems at 6 Years of Age in a
Total-Population Sample of Children Born at
<
25
Weeks of Gestation
Muthanna Samara, PhDa,b, Neil Marlow, MDc, Dieter Wolke, PhDa,b, for the EPICure Study Group
aDepartment of Psychology andbHealth Sciences Research Institute, Warwick Medical School, University of Warwick, Coventry, United Kingdom; cInstitute of Neuroscience, University of Nottingham, Nottingham, United Kingdom
The authors have indicated they have no financial relationships relevant to this article to disclose.
What’s Known on This Subject
Behavior problems have been reported mostly by using parent reports or teacher re-ports only. Few studies have focused on the behavioral development of extremely pre-mature children (⬍26 weeks of gestation).
What This Study Adds
We used parent and teacher agreement (pervasiveness) to determine clinically signifi-cant behavior or emotional problems. Extremely preterm children had 4 times increased odds of having emotional problems, compared with control children, at 6 years of age, independent of other disabilities.
ABSTRACT
OBJECTIVE.The goal was to test whether extremely preterm children have more
per-vasive behavior problems than classroom peers, by using parent and teacher con-sensus reports. Is there an excess number of extremely preterm boys with behavior problems?
METHODS.A total-population study of all extremely preterm children in the United
Kingdom and Ireland was performed. All children born atⱕ256⁄7weeks of gestation in the United Kingdom and Ireland between March and December 1995 were assessed at 76 months of age (range: 62– 87 months) (EPICure study). Pervasive behavior problems were defined as scoring⬎90th percentile on parent and teacher reports with a standard behavior scale, the Strengths and Difficulties Questionnaire. Of the 241 of 308 survivors who responded (78% of survivors), 200 had full reports on behavior problems from teachers and parents; they were compared with 148 control children.
RESULTS.A total of 19.4% of extremely preterm children (boys: 23.2%; girls: 15.6%),
compared with 3.4% of control children (boys: 4.6%; girls: 2.5%) had total behavior scores in the clinical range. Hyperactivity (extremely preterm: 30.6%; control: 8.8%) and conduct problems (extremely preterm: 12.5%; control: 5.4%) could be ac-counted for by cognitive deficits, but attention (extremely preterm: 33.3%; control: 6.8%), peer (extremely preterm: 25.4%; control: 5.4%), and emotional (extremely preterm: 13.5%; control: 4.1%) problems were not explained by poor cognitive functioning. Extremely preterm boys had behavior problems in excess of gender differences found in the control group in hyperactivity, attention, and prosocial
problems, and the impact on parents and teachers was greater for extremely preterm boys than girls.
CONCLUSIONS.Pervasive behavior problems are more frequent in children born at the limits of viability than previously
reported for larger preterm populations. Extremely preterm boys seem most vulnerable, and the impact on parents and teachers is considerable.Pediatrics2008;122:562–573
V
ERY PRETERM CHILDRENhave been reported to be at increased risk for behavior problems and psychopathologic conditions. Most consistently, increased risks for attention problems, hyperactivity, and social and peer rela-tionship problems have been reported for a variety of hospital and geographically defined cohorts.1–8 Studies inadolescence and early adulthood indicated that very preterm children continue to have more attention and hyperactivity problems9–13and difficulties in relating to peers.14,15There is mounting evidence that, as very preterm
children reach adolescence, they also more often suffer internalizing problems, including anxiety and depres-sion,9,10,12,14in line with the onset pattern reported in the general population.16Recent evidence, however, suggests
that very preterm children or those born at the limits of viability may suffer internalizing problems more often already in middle childhood.17,18
Gender differences in behavior are consistently found in the general population19,20and extremely preterm (EP) www.pediatrics.org/cgi/doi/10.1542/ peds.2007-3231
doi:10.1542/peds.2007-3231
Key Words
premature birth, behavior disorders, child psychology, mood disorders, attention deficit and disruptive disorders, early diagnosis
Abbreviations
EP— extremely preterm SDQ—Strengths and Difficulties Questionnaire
K-ABC—Kaufman Assessment Battery for Children
OR— odds ratio CI— confidence interval
populations,9,17with boys exhibiting more-frequent
ex-ternalizing disorders or attention-deficit/hyperactivity disorder and girls experiencing more internalizing disor-ders. Few studies12have investigated whether the gender
differences in very preterm children may be in excess of those reported in the general population. There is some indication that very low birth weight boys have even more social and attention problems, whereas very low birth weight girls may be at even higher risk for inter-nalizing problems.17It is unclear, however, whether the
behavior problems can be fully or mostly accounted for by general cognitive deficits, which are often found in very preterm children.1,21,22 Most studies in childhood
relied on parent reports alone2 or parent, self, and/or
teacher reports separately.3,9,10,14However, none
consid-ered pervasive behavior problems across informants, an important criterion for less-biased, more-accurate diag-nosis of behavior disorders.23–25 Finally, many of the
reports on behavior problems referred to clinical popu-lations born before the widespread introduction of pre-natal corticosteroid and surfactant treatments, which are important determinants of the increased survival rates for EP infants3,26,27 and might be expected to enhance
long-term outcomes and perhaps to alter patterns of disability.
In this report, we describe behavioral outcomes at 6 years of age for children born at gestational ages ofⱕ25 weeks, in a total-population study. We investigated whether children born EP were more likely to have clinically relevant pervasive behavior and emotional problems, compared with a term control group. Further-more, we studied whether any gender differences were in excess of those in the control group and whether increased pervasive behavior or emotional problems could be accounted for by cognitive deficits or other neurologic disabilities.
METHODS
Study Subjects
The derivation and characteristics of this population were described previously,28–30 as were the details of
the 6-year cognitive and neurologic assessments.21,31The
population represents all surviving children in the United Kingdom and Ireland who were born at ⱕ256⁄7 weeks of gestation from March through December 1995. Of the 308 children known to be alive at 30 months, the parents of 241 children consented to the study. Two hundred four children were in mainstream education. Two hundred twenty-three parents and 215 teachers (of 241) completed the Strengths and Difficulties Question-naire (SDQ)32,33; 200 children had both parent and
teacher reports. For each child assessed in mainstream school, we sought an age- and gender-matched class-mate as a comparison.21One hundred sixty teachers and
148 parents completed the SDQ for comparison children within the same class (148 control children had both parent and teacher reports). The study was approved by the Trent Multicenter Research Ethics Committee and the local education authorities in Scotland.
Behavior Assessments
Parent and Teacher SDQ
Teachers and parents completed the respective versions of the SDQ.32,33 The SDQ correlates highly (r ⬎ 0.80)
with the Child Behavior Checklist34total score and
dis-criminates between children with clinically significant behavior problems and children with no problem behav-ior as well as the Rutter Behavbehav-ior Scales35or the Child
Behavior Checklist.36,37 The 25 SDQ items fall into 5
scales (with 5 items each), that is, emotional symptoms, conduct problems, hyperactivity, peer problems, and prosocial behavior.32,33 For each scale except prosocial
behavior, higher scores indicate more problems. Cronbach’s␣values for each subscale of the teacher reports were moderate to good (hyperactivity: total sam-ple, Cronbach’s ␣ ⫽.88; EP children, Cronbach’s ␣ ⫽ .87; classroom control children, Cronbach’s ␣ ⫽ .84; conduct problems: total sample, Cronbach’s␣⫽.63; EP children, Cronbach’s ␣ ⫽ .69; control children, Cron-bach’s␣⫽.55; emotional problems: total sample, Cron-bach’s␣⫽.78; EP children, Cronbach’s␣⫽.74; control children, Cronbach’s␣⫽.82; peer problems: total sam-ple, Cronbach’s ␣ ⫽.75; EP children, Cronbach’s ␣ ⫽ .75; control children, Cronbach’s␣⫽.55; prosocial be-havior: total sample, Cronbach’s ␣⫽ .84; EP children, Cronbach’s ␣ ⫽ .86; control children, Cronbach’s␣ ⫽ .77). A total difficulties score based on the first 4 sub-scales (total sample, Cronbach’s ␣ ⫽ .85; EP children, Cronbach’s ␣ ⫽ .83; control children, Cronbach’s␣ ⫽ .83) and scale scores for each subscale were computed separately. An impact scale score also was computed, assessing whether the respondent thinks that the child has difficulty in the areas of emotions, concentration, behavior, or being able to get along with other people. If this is the case, then additional information is obtained about chronicity, distress, social impairment, and burden to others.32,33The total Cronbach’s␣value for the impact
scale was .84 (EP children, Cronbach’s␣⫽.83; control children, Cronbach’s␣⫽.88).
Additional items were adapted from the Conners Scales,38,39the Child Behavior Checklist,34,40theDiagnostic and Statistical Manual of Mental Disorders, Fourth Edition,41
and theInternational Classification of Diseases, 10th Revision, using the same Likert-scale format to assess components of attention-deficit/hyperactivity disorder (attention: teacher, 4 items; parents, 5 items; overactivity: 4 items each; impulsivity: teacher, 4 items; parents, 3 items). A principal-component factor analysis with varimax rota-tion was computed for teacher and parent items sepa-rately, yielding 2 factors in both analyses with distinct high loadings ofⱖ.50 and acceptable eigenvalues (atten-tion problems factor: teacher, 6 items, eigenvalue⫽7.2; parents, 7 items, eigenvalue ⫽5.7; overactivity/impul-sivity problems factor: teacher, 6 items, eigenvalue ⫽ 1.2; parents, 5 items, eigenvalue⫽1.0) (Appendix).
control children, Cronbach’s␣⫽.89) and the attention subscale (eg, has a short attention span; is easily dis-tracted or concentration wanders; and does not follow through on instruction and fails to finish school work) (total sample, Cronbach’s ␣⫽ .91; EP children, Cron-bach’s ␣⫽ .90; control children, Cronbach’s ␣ ⫽.89) was excellent. In addition, a 5-item school adaptation difficulties scale (eg, has found it difficult to settle in school; is worried about school; and needs special atten-tion to cope with school) had moderate internal consis-tency (total sample, Cronbach’s ␣ ⫽ .66; EP children, Cronbach’s ␣ ⫽ .69; control children, Cronbach’s␣ ⫽ .69) (Appendix). The internal consistency coefficients for parent reports (not shown here) were comparable to those reported above for the teacher reports.
The total scores and subscale scores were dichoto-mized into normal/borderline versus clinical (score of
⬎90th percentile, with respect to the control group). If the child scored at⬍90th percentile in both parent and
teacher reports, then the behavior was considered nor-mal (no behavior difficulty); mild difficulty refers to classification of the behavior in the clinical range by either parent or teacher, whereas clinical pervasive be-havior refers to classification of the bebe-havior in the clin-ical range by both parent and teacher (severe behavior difficulty).23,41,42 Parent and teacher ratings, classified
separately into normal/borderline and clinical catego-ries, are shown in Tables 1 and 2, for comparison with other studies.
Cognitive Ability
Children were assessed with the Kaufman Assessment Battery for Children (K-ABC).43 Cognitive impairment
or disability precluded use of the K-ABC for 41 index children.21 Those children were evaluated by using
ei-ther the Griffiths Scales of Mental Development44 (35
children) or the NEPSY neuropsychology assessment45(6
children). The Griffiths quotient or mean NEPSY
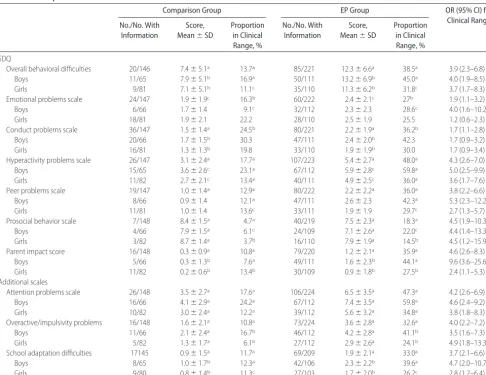
stan-TABLE 1 Parent Reports of Behavior at 6 Years for 224 Children Born at<25 Weeks of Gestation and 148 Age-Matched Classmates for
Comparison
Comparison Group EP Group OR (95% CI) for
Clinical Range No./No. With
Information
Score, Mean⫾SD
Proportion in Clinical Range, %
No./No. With Information
Score, Mean⫾SD
Proportion in Clinical Range, %
SDQ
Overall behavioral difficulties 20/146 7.4⫾5.1a 13.7a 85/221 12.3⫾6.6a 38.5a 3.9 (2.3–6.8)
Boys 11/65 7.9⫾5.1b 16.9a 50/111 13.2⫾6.9b 45.0a 4.0 (1.9–8.5)
Girls 9/81 7.1⫾5.1b 11.1c 35/110 11.3⫾6.2b 31.8c 3.7 (1.7–8.3)
Emotional problems scale 24/147 1.9⫾1.9c 16.3b 60/222 2.4⫾2.1c 27b 1.9 (1.1–3.2)
Boys 6/66 1.7⫾1.4 9.1c 32/112 2.3⫾2.3 28.6c 4.0 (1.6–10.2)
Girls 18/81 1.9⫾2.1 22.2 28/110 2.5⫾1.9 25.5 1.2 (0.6–2.3)
Conduct problems scale 36/147 1.5⫾1.4a 24.5b 80/221 2.2⫾1.9a 36.2b 1.7 (1.1–2.8)
Boys 20/66 1.7⫾1.5b 30.3 47/111 2.4⫾2.0b 42.3 1.7 (0.9–3.2)
Girls 16/81 1.3⫾1.3b 19.8 33/110 1.9⫾1.9b 30.0 1.7 (0.9–3.4)
Hyperactivity problems scale 26/147 3.1⫾2.4a 17.7a 107/223 5.4⫾2.7a 48.0a 4.3 (2.6–7.0)
Boys 15/65 3.6⫾2.6c 23.1a 67/112 5.9⫾2.8c 59.8a 5.0 (2.5–9.9)
Girls 11/82 2.7⫾2.1c 13.4a 40/111 4.9⫾2.5c 36.0a 3.6 (1.7–7.6)
Peer problems scale 19/147 1.0⫾1.4a 12.9a 80/222 2.2⫾2.2a 36.0a 3.8 (2.2–6.6)
Boys 8/66 0.9⫾1.4 12.1a 47/111 2.6⫾2.3 42.3a 5.3 (2.3–12.2)
Girls 11/81 1.0⫾1.4 13.6c 33/111 1.9⫾1.9 29.7c 2.7 (1.3–5.7)
Prosocial behavior scale 7/148 8.4⫾1.5a 4.7a 40/219 7.5⫾2.3a 18.3a 4.5 (1.9–10.3)
Boys 4/66 7.9⫾1.5a 6.1c 24/109 7.1⫾2.6a 22.0c 4.4 (1.4–13.3)
Girls 3/82 8.7⫾1.4a 3.7b 16/110 7.9⫾1.9a 14.5b 4.5 (1.2–15.9)
Parent impact score 16/148 0.3⫾0.9a 10.8a 79/220 1.2⫾2.1a 35.9a 4.6 (2.6–8.3)
Boys 5/66 0.3⫾1.3b 7.6a 49/111 1.6⫾2.3b 44.1a 9.6 (3.6–25.6)
Girls 11/82 0.2⫾0.6b 13.4b 30/109 0.9⫾1.8b 27.5b 2.4 (1.1–5.3)
Additional scales
Attention problems scale 26/148 3.5⫾2.7a 17.6a 106/224 6.5⫾3.5a 47.3a 4.2 (2.6–6.9)
Boys 16/66 4.1⫾2.9a 24.2a 67/112 7.4⫾3.5a 59.8a 4.6 (2.4–9.2)
Girls 10/82 3.0⫾2.4a 12.2a 39/112 5.6⫾3.2a 34.8a 3.8 (1.8–8.3)
Overactive/impulsivity problems 16/148 1.6⫾2.1a 10.8a 73/224 3.6⫾2.8a 32.6a 4.0 (2.2–7.2)
Boys 11/66 2.1⫾2.4a 16.7b 46/112 4.2⫾2.8a 41.1b 3.5 (1.6–7.3)
Girls 5/82 1.3⫾1.7a 6.1b 27/112 2.9⫾2.6a 24.1b 4.9 (1.8–13.3)
School adaptation difficulties 17145 0.9⫾1.5a 11.7a 69/209 1.9⫾2.1a 33.0a 3.7 (2.1–6.6)
Boys 8/65 1.0⫾1.7b 12.3a 42/106 2.3⫾2.2b 39.6a 4.7 (2.0–10.7)
Girls 9/80 0.8⫾1.4b 11.3c 27/103 1.7⫾2.0b 26.2c 2.8 (1.2–6.4)
Cut-off points for values in the clinical range were determined according to United Kingdom normative values (www.sdqinfo.com). aP⬍.001, for differences between EP and comparison groups.
dardized score was used to estimate a score. If this score was⬍40 (the lowest score in the K-ABC), then children were assigned a score of 39. To give a measure of cog-nitive function for all of the index children, these values were merged with the Mental Processing Component of the K-ABC to give an overall cognitive score. Develop-mental progress was assessed previously with the use of the Bayley Scales of Infant Development, Second Edi-tion, at 2.5 years, which yielded scores for mental and psychomotor development.46
Disability Classification
Children were classified into 4 functional groups of over-all disability. Severe overover-all disability included the child being highly dependent on caregivers and nonambula-tory cerebral palsy, an IQ score⬎3 SD below the mean, profound sensorineural hearing loss, or blindness. Mod-erate disability included reasonable independence and ambulatory cerebral palsy, an IQ score 2 to 3 SD below
the mean, sensorineural hearing loss that was corrected with a hearing aid, and impaired vision without blind-ness. Mild disability included neurologic signs with min-imal functional consequences or other impairments such as squints or refractive errors.21
Statistical Analyses
All analyses were conducted by using SPSS 14.0 (SPSS, Chicago, IL). To determine selective dropout, the 200 EP children with full behavior assessment results were com-pared with the 108 children with no or incomplete data on social, medical, growth, or functional/disability as-sessments from birth to 30 months of age, corrected for prematurity.
Categorical outcomes were compared with the use of
2tests for trends, as appropriate, or Fisher’s exact test.
All statistical tests were 2-sided. Odds ratios (ORs) are reported with 95% confidence intervals (CIs), compar-ing EP and control children, boys and girls, and different
TABLE 2 Teacher Ratings of Behavior at 6 Years for 215 Children Born at<25 Weeks of Gestation and 162 Age-Matched Classmates for
Comparison
Comparison Group EP Group OR (95% CI) for
Clinical Range No./No. With
Information
Score, Mean⫾SD
Proportion in Clinical Range, %
No./No. With Information
Score, Mean⫾SD
Proportion in Clinical Range, %
SDQ
Overall behavioral difficulties 19/162 5.4⫾4.9a 11.7a 72/208 10.6⫾6.2a 34.6a 4.0 (2.3–6.9)
Boys 7/72 5.7⫾5.2b 9.7a 41/103 11.7⫾6.7b 39.8a 6.1 (2.6–14.7)
Girls 12/90 5.3⫾4.7b 13.3c 31/105 9.6⫾5.5b 29.5c 2.7 (1.3–5.7)
Emotional problems scale 25/162 1.5⫾2.1c 15.4c 63/211 2.3⫾2.2c 29.9b 2.3 (1.4–3.9)
Boys 9/72 1.3⫾1.9b 12.5b 27/106 2.1⫾2.0b 25.5b 2.4 (1.0–5.5)
Girls 16/90 1.7⫾2.2b 17.8c 36/105 2.5⫾2.3b 34.3c 2.4 (1.2–4.7)
Conduct problems scale 30/162 0.7⫾1.2b 18.5 48/209 1.0⫾1.5b 23.0 1.3 (0.8–2.2)
Boys 16/72 0.7⫾1.2b 22.2 30/104 1.2⫾1.6b 28.8 1.4 (0.7–2.8)
Girls 14/90 0.6⫾1.1b 15.6 18/105 0.7⫾1.3b 17.1 1.1 (0.5–2.4)
Hyperactivity problems scale 23/162 2.5⫾2.5a 14.2a 99/213 5.3⫾3.1a 46.5a 5.2 (3.1–8.8)
Boys 13/72 2.8⫾2.7a 18.1a 62/107 6.1⫾2.9a 57.9a 6.2 (3.1–12.8)
Girls 10/90 2.2⫾2.3a 11.1a 37/106 4.5⫾3.1a 34.9a 4.3 (2.0–9.2)
Peer problems scale 29/162 0.7⫾1.2a 17.9a 106/210 2.1⫾2.3a 50.5a 4.7 (2.9–7.6)
Boys 16/72 0.8⫾1.1 22.2a 55/105 2.3⫾2.5 52.4a 3.8 (2.0–7.6)
Girls 13/90 0.7⫾1.2 14.4a 51/105 1.9⫾2.1 48.6a 5.6 (2.8–11.2)
Prosocial behavior scale 8/162 7.9⫾1.9a 4.9a 43/209 6.7⫾2.8a 20.6a 5.0 (2.3–11.0)
Boys 6/72 7.6⫾2.1a 8.3a 31/104 6.0⫾3.1a 29.8a 4.7 (1.8–11.9)
Girls 2/90 8.3⫾1.8a 2.2b 12/105 7.4⫾2.5a 11.4b 5.7 (1.2–26.3)
Teacher impact score 18/162 0.2⫾0.6a 11.1a 103/215 1.0⫾1.3a 47.9a 7.3 (4.2–12.8)
Boys 9/72 0.2⫾0.8c 12.5a 57/108 1.3⫾1.5c 52.8a 7.8 (3.5–17.2)
Girls 9/90 0.2⫾0.5c 10.0a 46/107 0.7⫾1.0c 43.0a 6.8 (3.1–14.9)
Additional scales
Attention problems scale 22/162 3.0⫾2.9a 13.6a 116/215 6.6⫾3.7a 54.0a 7.5 (4.4–14.3)
Boys 14/72 3.4⫾3.3c 19.4a 68/108 7.4⫾3.4c 63.0a 7.0 (3.5–14.3)
Girls 8/90 2.6⫾2.5c 8.9a 48/107 5.7⫾3.7c 44.9a 8.3 (3.7–18.9)
Overactive/impulsivity problems 18/162 1.7⫾2.8a 11.1a 65/215 3.6⫾3.8a 30.2a 3.5 (2.0–6.1)
Boys 9/72 2.0⫾3.1c 12.5a 44/108 4.5⫾4.0c 40.7a 4.8 (2.2–10.6)
Girls 9/90 1.5⫾2.5c 10.0b 21/107 2.7⫾3.4c 19.6b 2.2 (0.9–5.1)
School adaptation difficulties 20/161 1.0⫾1.5a 12.4a 82/209 2.2⫾2.0a 39.2a 4.5 (2.6–7.9)
Boys 9/71 1.1⫾1.6 12.7a 41/104 2.4⫾1.9 39.4a 4.5 (1.6–12.2)
Girls 11/90 0.9⫾1.5 12.2a 41/105 2.1⫾2.1 39.0a 3.9 (1.5–10.1)
Cut-off points for values in the clinical range were determined according to United Kingdom normative values (www.sdqinfo.com). aP⬍.001, for differences between EP and comparison groups.
types of disabilities. To test for the presence of specific behavior problems, logistic regression analyses with ad-justment for overall cognitive scores were performed.
RESULTS
Children Lost to Follow-up Monitoring
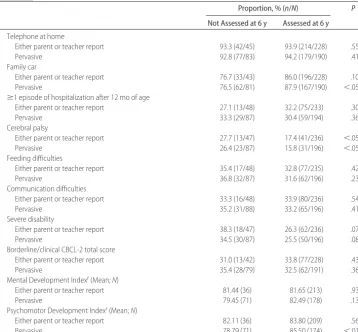
Compared with children who were assessed, dropouts (maximum: N ⫽108) were more likely to be of non-white ethnic origin (30.6% of dropouts vs 19% of those assessed;P⬍.05), to have young mothers (ⱕ21 years of age; 21.3% vs 9.5%; P⬍ .01), to live in overcrowded homes (43.5% vs 21.5%;P⬍.001), to have experienced
⬎1 serious life event by 30 months (42.4% vs 23.5%;
P⬍.001), and to have cerebral palsy (26.4% vs 15.8%;
P⬍.05), were less likely to have a family car (76.5% vs 87.9%;P⬍.05), and had a lower Psychomotor Devel-opment Index at 30 months of age (mean score: 78.8 vs 85.5; P ⬍ .01). The distributions of the other 22 vari-ables, including social factors, all neonatal complications, and all parameters on growth or disability up to 30 months of age, were similar in the 2 groups (Table 3).
Behavior Differences
Pervasive Behavior Problems
Compared with control children, EP children had signif-icantly more-frequent pervasive (defined by parent and teacher concurrence) behavior difficulties (P ⬍ .001), including emotional problems (P⬍.01), conduct prob-lems (P ⬍ .05), hyperactivity (P ⬍ .001), poorer peer relationships (P ⬍ .001) and prosocial behavior (P ⬍
.001), and higher impact scores (P⬍.001) on the SDQ (Table 4). Furthermore, they had more-frequent clinical overactivity/impulsivity problems (P ⬍ .01), attention problems (P⬍.001), and school adaptation difficulties (P⬍.001).
Both boys and girls in the EP group were significantly more likely to have results in the clinical range for pervasive total behavior difficulties, hyperactivity, peer problems, attention problems, and school adaptation problems, compared with their same-gender counter-parts in the control group (Table 4). Compared with control boys, EP boys were also more likely to have pervasive emotional problems, less prosocial behavior, higher impact scores, and overactivity/impulsivity prob-lems.
Within the control group, girls were more likely than boys to have pervasive emotional problems (P⬍.05). In contrast, within the EP group, boys were more likely to have hyperactivity (P⬍.001), prosocial problems (P⬍
.01), higher impact scores (P⬍.05), and attention prob-lems (P⬍.001).
To test whether the differences between EP and con-trol children could be explained by differences in overall cognitive scores, we repeated the analysis with adjust-ment for overall cognitive score. Group differences in conduct problems, hyperactivity problems, overactivity/ impulsivity problems, and impact on parents/teachers were explained by the lower cognitive abilities of the EP children and became nonsignificant after adjustment
(Table 5). In contrast, total difficulties, emotional and peer problems, attention problems, and school adapta-tion problems remained significant after adjustment for cognitive abilities (Table 5). This indicates that these difficulties are specific deficits that are not explained by general cognitive deficits. Emotional problems in EP children, compared with the control group, even in-creased slightly after adjustment for cognitive scores (be-fore adjustment: OR: 3.7; 95% CI: 1.5–9.2; after adjust-ment: OR: 4.2; 95% CI: 1.5–11.8) (Table 5).
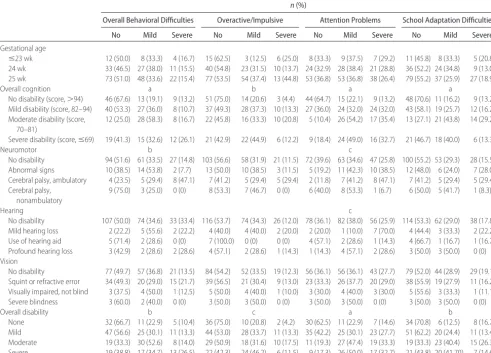
Disability and Severity of Behavior Difficulties in EP Children
Table 6 shows the associations of gestational age and cognitive, neuromotor, or sensory disability with total behavior difficulties and the specific scales for attention, overactivity/impulsivity, and school difficulties. No sig-nificant association between gestational age at birth and pervasive behavior problems was found. In contrast, cognitive impairment was associated with increased prevalence of overall mild or severe pervasive behavior difficulties (P ⬍.001) and more severe attention prob-lems (P⬍.001), overactivity/impulsivity (P⬍.01), and school adaptation difficulties (P⬍.001) (Table 6); fur-thermore, the children had more hyperactivity (P ⬍
.001), more peer relationship problems (P ⬍.01), and less prosocial behavior (P ⬍ .001), and parents and teachers were more severely affected by those problems (P⬍.001) (not shown). Neuromotor disability also was found to be significantly related to the severity of total difficulties (P⬍.01) and attention difficulties (P⬍.05) (Table 6). Conduct problems (P⬍.05), hyperactivity (P ⬍ .05), peer problems (P ⬍.01), and poorer prosocial behavior (P⬍ .001) were more frequent (not shown). Hearing disability showed significant associations with the severity of attention problems (P⬍ .05) (Table 6), hyperactivity (P⬍.05), and prosocial behavior (P⬍.05) (not shown). In contrast, the severity of visual disability was not related significantly and consistently to the se-verity of behavior difficulties.
Many children had multiple impairments and associ-ated disabilities,21 summarized in the overall disability
index, which was related significantly to the severity of total difficulties (P⬍.01), attention problems (P⬍.001), overactivity/impulsivity (P ⬍ .05), school adaptation problems (P⬍.01), hyperactivity (P⬍.001) (Table 6), peer problems (P⬍.001), prosocial behavior (P⬍.001), and the impact on parents/teachers (P ⬍ .001) (not shown). Neither overall disability nor the specific disabil-ities were found to be related to emotional problems.
DISCUSSION
TABLE 3 Distributions of Social, Medical, and Disability Variables Among Children Assessed at 6 Years and Children Lost to Follow-up Monitoring From a Cohort of 308 Surviving Children Born at
<25 Weeks of Gestation
Proportion, % (n/N) P
Not Assessed at 6 y Assessed at 6 y
Perinatal factors (308 surviving children) Mother of nonwhite ethnic origina
Either parent or teacher report 28.4 (19/67) 21.6 (52/241) .158
Pervasive 30.6 (33/108) 19.0 (38/200) ⬍.05
Maternal age ofⱕ21 y at birth
Either parent or teacher 23.9 (16/67) 10.8 (26/241) ⬍.01
Pervasive 21.3 (23/108) 9.5 (19/200) ⬍.01
Mother smoked in pregnancy
Either parent or teacher 40.4 (19/47) 31.8 (74/233) .163
Pervasive 34.5 (30/87) 32.6 (63/193) .432
Prenatal steroid treatment
Either parent or teacher report 79.1 (53/67) 80.0 (192/240) .496
Pervasive 79.6 (86/108) 79.9 (159/199) .533
Multiple birth
Either parent or teacher report 22.4 (15/67) 26.6 (64/241) .301
Pervasive 23.1 (25/108) 27.0 (54/200) .275
Congenital abnormality present
Either parent or teacher report 1.5 (1/67) 0.0 (0/239) .149
Pervasive 0.9 (1/108) 0.0 (0/198) .373
Birth weight (Mean;N)
Either parent or teacher report 0.75 (67) 0.74 (241) .961
Pervasive 0.74 (108) 0.75 (200) .741
Male gender
Either parent or teacher report 41.8 (28/67) 50.2 (121/241) .140
Pervasive 44.4 (48/108) 50.8 (101/200) .185
Cranial ultrasound findings
Abnormal cranial ultrasound findings
Either parent or teacher report 23.9 (16/67) 22.4 (54/241) .458
Pervasive 26.9 (29/108) 20.5 (41/200) .130
Ventriculomegalyb
Either parent or teacher report 37.3 (25/67) 31.5 (76/241) .227
Pervasive 38.0 (41/108) 30.0 (60/200) .098
Parenchymal cysts presentc
Either parent or teacher report 14.9 (10/67) 15.8 (38/241) .519
Pervasive 18.5 (20/108) 14.0 (28/200) .189
Laser or cryotherapy for retinopathy
Either parent or teacher report 59.7 (40/67) 54.9 (130/237) .286
Pervasive 55.6 (60/108) 56.1 (110/196) .510
Still receiving supplemental oxygen at discharge
Either parent or teacher report 50.7 (34/67) 49.8 (120/241) .500
Pervasive 52.8 (57/108) 48.5 (97/200) .275
Systemic steroid treatment for bronchopulmonary dysplasia
Either parent or teacher report 71.2 (47/66) 72.5 (174/240) .474
Pervasive 70.1 (75/107) 73.4 (146/199) .316
At 30 mo of age, corrected for prematurity (283 children assessed) Mother is single or separated
Either parent or teacher report 20.0 (9/45) 20.1 (46/229) .586
Pervasive 22.9 (19/83) 18.8 (36/191) .270
Mother in education after GCSEd
Either parent or teacher report 36.4 (16/44) 23.7 (52/219) .063
Pervasive 30.0 (24/80) 24.0 (44/183) .194
Father in education after GCSEd
Either parent or teacher report 43.3 (13/30) 33.7 (57/169) .208
Pervasive 36.5 (19/52) 34.7 (51/147) .469
High home crowding index (⬎1 person per room)
Either parent or teacher report 52.2 (35/67) 22.8 (55/241) ⬍.001
Pervasive 43.5 (47/108) 21.5 (43/200) ⬍.001
CI: 1.9 – 8.3), and on school adaptation (OR: 6.7; 95% CI: 2.7–16.1). However, most EP children, in particular those with no or only mild cognitive problems or neu-rologic disability, had no or only mild behavior prob-lems. The pervasive behavior problems we report for this population are more pronounced than those observed in other studies of more-mature, very preterm or very low birth weight populations in childhood, for whom disad-vantage was described predominately for attention and hyperactivity problems, peer relationships, and school adaptation problems.1,2,4,13 This increased prevalence of
behavior problems is of concern, because we used a more-extreme definition of a disorder that was evident on both parent and teacher reports, in contrast to most previous studies, some of which relied on parent reports only and some on parent, child, and teacher reports separately.1,9,14Parent and teacher reports correlate only
moderately (r⫽ 0.4 – 0.5), using the same instrument, and may be influenced by situation specificity or infor-mant bias.47Parent or teacher reports alone are also less
sensitive in identifying clinical cases for psychiatric prob-lems, compared with parent and teacher reports com-bined to assess pervasiveness,25,48as performed here. We
can be fairly certain, therefore, that the children we identified with pervasive behavior problems require psy-chological evaluation.
Controlling for general cognitive performance al-lowed us to determine whether differences in behavior and school adaptation could be explained by low IQ alone or were attributable to specific deficits in behav-ioral or emotional regulation. Differences in the preva-lence in the behavior domains of conduct, general hy-peractivity, and impulsiveness (and their impact on parents and teachers) were indeed mostly accounted for by the reduction in general cognitive abilities in the EP children. For hyperactivity, impulsivity, and conduct problems, this is a consistent finding in the general pop-ulation.49,50For important behaviors such as
hyperactiv-ity and antisocial behavior, this seems to be the conse-quence of global changes in cognitive functioning and
TABLE 3 Continued
Proportion, % (n/N) P
Not Assessed at 6 y Assessed at 6 y
Telephone at home
Either parent or teacher report 93.3 (42/45) 93.9 (214/228) .554
Pervasive 92.8 (77/83) 94.2 (179/190) .417
Family car
Either parent or teacher report 76.7 (33/43) 86.0 (196/228) .100
Pervasive 76.5 (62/81) 87.9 (167/190) ⬍.05
ⱖ1 episode of hospitalization after 12 mo of age
Either parent or teacher report 27.1 (13/48) 32.2 (75/233) .304
Pervasive 33.3 (29/87) 30.4 (59/194) .361
Cerebral palsy
Either parent or teacher report 27.7 (13/47) 17.4 (41/236) ⬍.05
Pervasive 26.4 (23/87) 15.8 (31/196) ⬍.05
Feeding difficulties
Either parent or teacher report 35.4 (17/48) 32.8 (77/235) .421
Pervasive 36.8 (32/87) 31.6 (62/196) .237
Communication difficulties
Either parent or teacher report 33.3 (16/48) 33.9 (80/236) .541
Pervasive 35.2 (31/88) 33.2 (65/196) .417
Severe disability
Either parent or teacher report 38.3 (18/47) 26.3 (62/236) .070
Pervasive 34.5 (30/87) 25.5 (50/196) .081
Borderline/clinical CBCL-2 total score
Either parent or teacher report 31.0 (13/42) 33.8 (77/228) .435
Pervasive 35.4 (28/79) 32.5 (62/191) .368
Mental Development Indexf(Mean;N)
Either parent or teacher report 81.44 (36) 81.65 (213) .936
Pervasive 79.45 (71) 82.49 (178) .133
Psychomotor Development Indexf(Mean;N)
Either parent or teacher report 82.11 (36) 83.80 (209) .560
Pervasive 78.79 (71) 85.50 (174) ⬍.01
The number of subjects varied according to the availability of the measured variable (either parent or teacher report:N⫽241; dropouts:N⫽67; pervasive behavior data available:N⫽200; incomplete data:N⫽108). CBCL indicates Child Behavior Checklist.
aEthnic group data were taken from original clinical records at the hospital of birth. bVentricular index of⬎4 mm or⬎95th percentile for postmenstrual age. cPeriventricular leukomalacia or porencephalic cysts.
dQualification higher than general certificate of secondary education (equivalent to education beyond 16 years of age).
eLife events considered to have affected the parent (obtained with a structured questionnaire with 17 examples, eg, broken relationship, moved, or financial problems).
not a specific feature of development after preterm birth. The origins are likely attributable to global changes in brain development, in terms of size and complexity,51–54
that affect overall cognitive development21 and
execu-tive function,55and they are unlikely to be the result of
damage to specific brain regions.31 At very low
gesta-tional ages, the changes seem to affect boys more than girls.54 This finding adds to our understanding of the
neuropathologic pathways associated with hyperactivity and conduct problems in EP children.
In contrast, the excess of emotional and attention problems and difficulties in peer relationships or school adaptation could not be accounted for by general cogni-tive ability. Problems with maintaining sustained
atten-tion have been reported consistently for very premature children.12,13Our results indicate that, although
impul-siveness and overactivity are explained by general cog-nitive ability, regulating/maintaining attention seems to be a specific functional deficit in EP children. This was reported previously for a very preterm cohort study by using the same cognitive measure (K-ABC) but only parent reports of behavior problems.56The assessment of
cognitive performance itself requires attention regula-tion, and this specific deficit occurs in addition to this confounding effect.
Similarly, problems in peer relationships2are not
ex-plained by global cognitive impairment. Being “differ-ent,” such as having poorer motor abilities, poor somatic growth, or even minor visual problems such as strabis-mus, can lead to social exclusion and victimization.57–59
These problems are common in this population.21,60
Al-though we found that the severity of cognitive or neu-romotor disability was related to severe peer relationship problems, neither specific hearing nor vision problems were, which is reassuring. Other factors, such as working memory,61attention deficits, peer relationship problems,
and motor problems,62 and socioeconomic family
fac-tors,63–65may exacerbate school problems in EP children
and need to be explored further in longitudinal analysis, because they may have consequences for adult out-comes.66
Most notably, emotional problems such as worrying, being unhappy, and being fearful were not at all ex-plained by the cognitive scores or overall or specific disabilities. The problems were frequent across the range of EP children, and the odds of pervasive emotional problems were increased 3.7-fold among EP children (rate: 13.5%), compared with control children (rate: 4.1%). The rate we observed among control children is similar to the prevalence in a representative community sample in the United Kingdom (4%),67giving face
valid-ity to the composition of our comparison group. The finding strongly suggests that children born at the limits of viability already suffer more emotional problems in
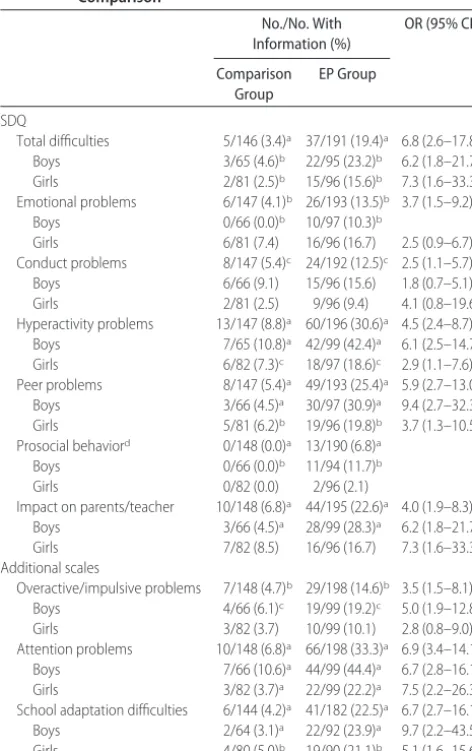
TABLE 4 Scores in the Clinical Range for Pervasive Behavioral Disorders (Denoting Agreement Between Teacher and Parent) Assessed at 6 Years for Children Born at<25
Weeks of Gestation and Age-Matched Classmates for Comparison
No./No. With Information (%)
OR (95% CI)
Comparison Group
EP Group
SDQ
Total difficulties 5/146 (3.4)a 37/191 (19.4)a 6.8 (2.6–17.8) Boys 3/65 (4.6)b 22/95 (23.2)b 6.2 (1.8–21.7) Girls 2/81 (2.5)b 15/96 (15.6)b 7.3 (1.6–33.3) Emotional problems 6/147 (4.1)b 26/193 (13.5)b 3.7 (1.5–9.2)
Boys 0/66 (0.0)b 10/97 (10.3)b
Girls 6/81 (7.4) 16/96 (16.7) 2.5 (0.9–6.7) Conduct problems 8/147 (5.4)c 24/192 (12.5)c 2.5 (1.1–5.7) Boys 6/66 (9.1) 15/96 (15.6) 1.8 (0.7–5.1) Girls 2/81 (2.5) 9/96 (9.4) 4.1 (0.8–19.6) Hyperactivity problems 13/147 (8.8)a 60/196 (30.6)a 4.5 (2.4–8.7)
Boys 7/65 (10.8)a 42/99 (42.4)a 6.1 (2.5–14.7) Girls 6/82 (7.3)c 18/97 (18.6)c 2.9 (1.1–7.6) Peer problems 8/147 (5.4)a 49/193 (25.4)a 5.9 (2.7–13.0)
Boys 3/66 (4.5)a 30/97 (30.9)a 9.4 (2.7–32.3) Girls 5/81 (6.2)b 19/96 (19.8)b 3.7 (1.3–10.5) Prosocial behaviord 0/148 (0.0)a 13/190 (6.8)a
Boys 0/66 (0.0)b 11/94 (11.7)b
Girls 0/82 (0.0) 2/96 (2.1)
Impact on parents/teacher 10/148 (6.8)a 44/195 (22.6)a 4.0 (1.9–8.3) Boys 3/66 (4.5)a 28/99 (28.3)a 6.2 (1.8–21.7) Girls 7/82 (8.5) 16/96 (16.7) 7.3 (1.6–33.3) Additional scales
Overactive/impulsive problems 7/148 (4.7)b 29/198 (14.6)b 3.5 (1.5–8.1) Boys 4/66 (6.1)c 19/99 (19.2)c 5.0 (1.9–12.8) Girls 3/82 (3.7) 10/99 (10.1) 2.8 (0.8–9.0) Attention problems 10/148 (6.8)a 66/198 (33.3)a 6.9 (3.4–14.1)
Boys 7/66 (10.6)a 44/99 (44.4)a 6.7 (2.8–16.1) Girls 3/82 (3.7)a 22/99 (22.2)a 7.5 (2.2–26.3) School adaptation difficulties 6/144 (4.2)a 41/182 (22.5)a 6.7 (2.7–16.1) Boys 2/64 (3.1)a 22/92 (23.9)a 9.7 (2.2–43.5) Girls 4/80 (5.0)b 19/90 (21.1)b 5.1 (1.6–15.6)
Values shown are the proportions scoring in⬎90th percentile. aP⬍.001, for differences between EP and comparison groups. bP⬍.01.
cP⬍.05.
dProsocial behavior does not have an OR value because no children with problems were in the control group.
TABLE 5 ORs for Clinical Scores for Pervasive Behavioral Disorders Before and After Adjustment for General Cognitive Scores
OR for Clinical Score (95% CI)
Unadjusted Adjusted
SDQ
Total difficulties 6.8 (2.6–17.9)a 3.3 (1.1–9.5)b Emotional problems 3.7 (1.5–9.2)c 4.2 (1.5–11.8)c Conduct problems 2.5 (1.1–5.7)b 2.4 (0.9–6.4) Hyperactivity problems 4.5 (2.4–8.7)a 2.0 (0.9–4.3) Peer problems 5.9 (2.7–13.0)a 2.5 (1.0–6.1)b
Impact 4.0 (1.9–8.3)a 1.7 (0.7–3.9)
Additional scales
Overactive/impulsive problems 3.5 (1.5–8.1)c 1.9 (0.7–5.3) Attention problems 6.9 (3.4–14.1)a 3.8 (1.7–8.3)c School adaptation difficulties 6.7 (2.8–16.1)a 5.3 (2.0–14.3)c
Prosocial behavior was not included because an OR was not available (see Table 4). aP⬍.001, for differences between EP and control groups.
middle childhood than control children and the devel-opment of emotional problems is quite independent of disability.
Comparison of the rates of behavior problems for control boys and girls confirmed the trends found in community samples,19,20,65,68with boys having more
con-duct, hyperactivity, and attention problems and total difficulties and girls having more emotional problems; with the small sample size, only the latter was statisti-cally significant. A similar pattern was found in the EP group. However, comparison of the ORs for boys and girls with respect to individual behavior dimensions (Ta-ble 4) indicated that EP boys had a disproportionate increase in hyperactivity and overactivity/impulsivity problems, were less prosocial, and had more peer and school adaptation difficulties than would be expected from the gender difference in the control group. There was one exception; EP girls were reported to have more conduct problems than expected. Overall, EP boys seemed to be even more vulnerable to developing be-havior difficulties, taking into account the usually re-ported gender differences. This finding extends those
previously reported for cognitive functioning in boys, compared with girls, in this sample21,31 and is found in
the context of lower survival rates and greater frequency of neonatal problems among boys in this population,28as
well as higher rates of disability.30 One may speculate
that gender differences in intrauterine development or the lack of intrauterine development make the male fetus/EP infant particularly vulnerable to perinatal ad-versity, with important consequences for brain and later development.20,54,69
There are some limitations to this study. We were not able to recruit a classroom control child for each EP child in mainstream school. Of the parents and teachers who gave consent, up to 15% did not return the behavior scales. We found no pattern or lack of cooperation ac-cording to regional variation or social deprivation in the area the school was serving. The return rate compares well with those of other questionnaire studies.25We thus
consider any bias to be minimal. The finding of substan-tial pervasive behavior and emotional problems cannot be accounted for by selective dropout. There were no differences regarding medical variables, growth, or early
TABLE 6 Severity and Type of Disability and Gestational Age Among EP Children and Severity of Behavior Difficulties at 6 Years of Age
n(%)
Overall Behavioral Difficulties Overactive/Impulsive Attention Problems School Adaptation Difficulties
No Mild Severe No Mild Severe No Mild Severe No Mild Severe
Gestational age
ⱕ23 wk 12 (50.0) 8 (33.3) 4 (16.7) 15 (62.5) 3 (12.5) 6 (25.0) 8 (33.3) 9 (37.5) 7 (29.2) 11 (45.8) 8 (33.3) 5 (20.8) 24 wk 33 (46.5) 27 (38.0) 11 (15.5) 40 (54.8) 23 (31.5) 10 (13.7) 24 (32.9) 28 (38.4) 21 (28.8) 36 (52.2) 24 (34.8) 9 (13.0) 25 wk 73 (51.0) 48 (33.6) 22 (15.4) 77 (53.5) 54 (37.4) 13 (44.8) 53 (36.8) 53 (36.8) 38 (26.4) 79 (55.2) 37 (25.9) 27 (18.9)
Overall cognition a b a a
No disability (score,⬎94) 46 (67.6) 13 (19.1) 9 (13.2) 51 (75.0) 14 (20.6) 3 (4.4) 44 (64.7) 15 (22.1) 9 (13.2) 48 (70.6) 11 (16.2) 9 (13.2) Mild disability (score, 82–94) 40 (53.3) 27 (36.0) 8 (10.7) 37 (49.3) 28 (37.3) 10 (13.3) 27 (36.0) 24 (32.0) 24 (32.0) 43 (58.1) 19 (25.7) 12 (16.2) Moderate disability (score,
70–81)
12 (25.0) 28 (58.3) 8 (16.7) 22 (45.8) 16 (33.3) 10 (20.8) 5 (10.4) 26 (54.2) 17 (35.4) 13 (27.1) 21 (43.8) 14 (29.2)
Severe disability (score,ⱕ69) 19 (41.3) 15 (32.6) 12 (26.1) 21 (42.9) 22 (44.9) 6 (12.2) 9 (18.4) 24 (49.0) 16 (32.7) 21 (46.7) 18 (40.0) 6 (13.3)
Neuromotor b c
No disability 94 (51.6) 61 (33.5) 27 (14.8) 103 (56.6) 58 (31.9) 21 (11.5) 72 (39.6) 63 (34.6) 47 (25.8) 100 (55.2) 53 (29.3) 28 (15.5) Abnormal signs 10 (38.5) 14 (53.8) 2 (7.7) 13 (50.0) 10 (38.5) 3 (11.5) 5 (19.2) 11 (42.3) 10 (38.5) 12 (48.0) 6 (24.0) 7 (28.0) Cerebral palsy, ambulatory 4 (23.5) 5 (29.4) 8 (47.1) 7 (41.2) 5 (29.4) 5 (29.4) 2 (11.8) 7 (41.2) 8 (47.1) 7 (41.2) 5 (29.4) 5 (29.4) Cerebral palsy,
nonambulatory
9 (75.0) 3 (25.0) 0 (0) 8 (53.3) 7 (46.7) 0 (0) 6 (40.0) 8 (53.3) 1 (6.7) 6 (50.0) 5 (41.7) 1 (8.3)
Hearing c
No disability 107 (50.0) 74 (34.6) 33 (33.4) 116 (53.7) 74 (34.3) 26 (12.0) 78 (36.1) 82 (38.0) 56 (25.9) 114 (53.3) 62 (29.0) 38 (17.8) Mild hearing loss 2 (22.2) 5 (55.6) 2 (22.2) 4 (40.0) 4 (40.0) 2 (20.0) 2 (20.0) 1 (10.0) 7 (70.0) 4 (44.4) 3 (33.3) 2 (22.2) Use of hearing aid 5 (71.4) 2 (28.6) 0 (0) 7 (100.0) 0 (0) 0 (0) 4 (57.1) 2 (28.6) 1 (14.3) 4 (66.7) 1 (16.7) 1 (16.7) Profound hearing loss 3 (42.9) 2 (28.6) 2 (28.6) 4 (57.1) 2 (28.6) 1 (14.3) 1 (14.3) 4 (57.1) 2 (28.6) 3 (50.0) 3 (50.0) 0 (0) Vision
No disability 77 (49.7) 57 (36.8) 21 (13.5) 84 (54.2) 52 (33.5) 19 (12.3) 56 (36.1) 56 (36.1) 43 (27.7) 79 (52.0) 44 (28.9) 29 (19.1) Squint or refractive error 34 (49.3) 20 (29.0) 15 (21.7) 39 (56.5) 21 (30.4) 9 (13.0) 23 (33.3) 26 (37.7) 20 (29.0) 38 (55.9) 19 (27.9) 11 (16.2) Visually impaired, not blind 3 (37.5) 4 (50.0) 1 (12.5) 5 (50.0) 4 (40.0) 1 (10.0) 3 (30.0) 4 (40.0) 3 (30.0) 5 (55.6) 3 (33.3) 1 (11.1) Severe blindness 3 (60.0) 2 (40.0) 0 (0) 3 (50.0) 3 (50.0) 0 (0) 3 (50.0) 3 (50.0) 0 (0) 3 (50.0) 3 (50.0) 0 (0)
Overall disability b c a b
None 32 (66.7) 11 (22.9) 5 (10.4) 36 (75.0) 10 (20.8) 2 (4.2) 30 (62.5) 11 (22.9) 7 (14.6) 34 (70.8) 6 (12.5) 8 (16.7) Mild 47 (56.6) 25 (30.1) 11 (13.3) 44 (53.0) 28 (33.7) 11 (13.3) 35 (42.2) 25 (30.1) 23 (27.7) 51 (62.2) 20 (24.4) 11 (13.4) Moderate 19 (33.3) 30 (52.6) 8 (14.0) 29 (50.9) 18 (31.6) 10 (17.5) 11 (19.3) 27 (47.4) 19 (33.3) 19 (33.3) 23 (40.4) 15 (26.3) Severe 19 (38.8) 17 (34.7) 13 (26.5) 22 (42.3) 24 (46.2) 6 (11.5) 9 (17.3) 26 (50.0) 17 (32.7) 21 (43.8) 20 (41.70) 7 (14.6)
Results were defined as follows: none, parent and teacher ratings in the normal range; mild, either teacher or parent rating in the clinical range; severe, teacher and parent ratings in the clinical range. aP⬍.001, for differences between gestational age and disability groups.
disability between those lost to follow-up monitoring and those assessed.21Rather, we found that dropout was
more likely in disadvantaged families, which would be expected to reduce the prevalence of behavior difficul-ties in the assessed population.49,50,65
This large study of outcomes for such an immature population at school age indicates that the odds for clinically relevant, pervasive behavior problems are 2 to 9 times higher for EP children and problems are more frequent than in more-mature preterm populations. Some of the behavior problems are accounted for by general cognitive deficits, but problems of attention, emotion, peer relationships, and school adaptation are more common than expected from cognitive scores. These patterns of behavior difficulties may have impor-tant implications for brain imaging research,54 primary
prevention of prematurity and neurodevelopmental problems, and clinical psychological care for EP children.
ACKNOWLEDGMENTS
The research reported herein was supported by grants from BLISS (see www.bliss.org/uk), the premature infant char-ity (Drs Marlow and Wolke), the Health Foundation (Drs Marlow and Wolke), and Well-Being of Women (Drs Mar-low and Wolke).
The EPICure Investigator Group included K. Costeloe (London), A. T. Gibson (Sheffield), E. M. Hennessy (London), N. Marlow (Nottingham), A. R. Wilkinson (Oxford), and D. Wolke (Warwick). Data were acquired by Drs Wolke and Marlow and the Developmental Panel researchers, as follows: psychologists: Emma Luck, Catherine Bamford, Helen Betteridge, Hanne Bruhn, Sandra Johnson, Iliana Magiati, Maria Morahan, Isabel Tsverik, and Muthanna Samara; pediatricians: Melanie Bracewell, Michele Cruwys, Ruth MacGregor, Lesley McDonald, Margaret Morton, Margaret Morris, and Sue Thomas. Administrative, technical, and material support was provided by Heather Palmer, Catherine Bamford, Emma Luck, and Melanie Bracewell.
REFERENCES
1. Bhutta AT, Cleves MA, Casey PH, Cradock MM, Anand KJ. Cognitive and behavioral outcomes of school-aged children who were born preterm: a meta-analysis.JAMA.2002;288(6): 728 –737
2. Hille ETM, den Ouden AL, Saigal S, et al. Behavioural problems in children who weigh 1000 g or less at birth in four countries.
Lancet.2001;357(9269):1641–1643
3. Anderson P, Doyle LW. Neurobehavioral outcomes of school-age children born extremely low birth weight or very preterm in the 1990s.JAMA.2003;289(24):3264 –3272
4. Hoff B, Hansen BM, Munck H, Mortensen EL. Behavioral and social development of children born extremely premature: 5-year follow-up.Scand J Psychol.2004;45(4):285–292 5. Foulder-Hughes LA, Cooke RWI. Motor, cognitive, and
behav-ioural disorders in children born very preterm.Dev Med Child Neurol.2003;45(2):97–103
6. Jeyaseelan D, O’Callaghan M, Neulinger K, Shum D, Burns Y. The association between early minor motor difficulties in ex-treme low birth weight infants and school age attentional difficulties.Early Hum Dev.2006;82(4):249 –255
7. Stjernqvist K, Svenningsen NW. Ten year follow up of children
born before 29 gestational weeks: health, cognitive develop-ment, behaviour and school achievement.Acta Paediatr.1999; 88(5):557–562
8. Salt A, Redshaw M. Neurodevelopmental follow-up after pre-term birth: follow up after two years.Early Hum Dev. 2006; 82(3):185–197
9. Saigal S, Pinelli J, Hoult L, Kim MM, Boyle M. Psychopathol-ogy and social competencies of adolescents who were ex-tremely low birth weight.Pediatrics.2003;111(5):969 –975 10. Indredavik MS, Vik T, Heyerdahl S, Kulseng S, Fayers P,
Brubakk AM. Psychiatric symptoms and disorders in adoles-cents with low birth weight.Arch Dis Child Fetal Neonatal Ed.
2004;89(5):F445–F450
11. Dahl LB, Kaaresen PI, Tunby J, Handegard BH, Kvernmo S, Ronning JA. Emotional, behavioral, social, and academic outcomes in adolescents born with very low birth weight.
Pediatrics. 2006;118(2). Available at: www.pediatrics.org/ cgi/content/full/118/2/e449
12. Hack M, Youngstrom EA, Cartar L, et al. Behavioral outcomes and evidence of psychopathology among very low birth weight infants at age 20 years.Pediatrics.2004;114(4):932–940 13. Botting N, Powls A, Cooke RWI, Marlow N. Attention deficit
hyperactivity disorders and other psychiatric outcomes in very low birthweight children at 12 years.J Child Psychol Psychiatry.
1997;38(8):931–941
14. Gardner F, Johnson A, Yudkin P, et al. Behavioral and emotional adjustment of teenagers in mainstream school who were born before 29 weeks’ gestation.Pediatrics.2004;114(3):676 – 682 15. Indredavik MS, Vik T, Heyerdahl S, Kulseng S, Brubakk A-M.
Psychiatric symptoms in low birth weight adolescents, assessed by screening questionnaires.Eur Child Adolesc Psychiatry.2005; 14(4):226 –236
16. Costello EJ, Pine DS, Hammen C, et al. Development and natural history of mood disorders.Biol Psychiatry.2002;52(6):529–542 17. Reijneveld SA, de Kleine MJK, van Baar AL, et al. Behavioural
and emotional problems in very preterm and very low birth-weight infants at age 5 years.Arch Dis Child Fetal Neonatal Ed.
2006;91(6):F423–F428
18. Farooqi A, Hagglof B, Sedin G, Gothefors L, Serenius F. Mental health and social competencies of 10- to 12-year-old children born at 23 to 25 weeks of gestation in the 1990s: a Swedish national prospective follow-up study. Pediatrics. 2007;120(1): 118 –133
19. Messer J, Goodman R, Rowe R, Meltzer H, Maughan B. Pre-adolescent conduct problems in girls and boys.J Am Acad Child Adolesc Psychiatry.2006;45(2):184 –191
20. Rutter M, Caspi A, Moffitt TE. Using sex differences in psycho-pathology to study causal mechanisms: unifying issues and re-search strategies.J Child Psychol Psychiatry.2003;44(8):1092–1115 21. Marlow N, Wolke D, Bracewell MA, Samara M. Neurologic and developmental disability at 6 years of age after extremely pre-term birth.N Engl J Med.2005;352(1):9 –19
22. Wolke D, Meyer R. Cognitive status, language attainment and prereading skills of 6-year-old very preterm children and their peers: the Bavarian Longitudinal Study.Dev Med Child Neurol.
1999;41(2):94 –109
23. Costello EJ, Loeber R, Stouthamer Loeber M. Pervasive and situational hyperactivity: confounding effect of informant: a research note.J Child Psychol Psychiatry.1991;32(2):367–376 24. Ablow JCPD, Measelle JRPD, Kraemer HCPD, et al. The
MacArthur Three-City Outcome Study: evaluating multi-informant measures of young children’s symptomatology.
J Am Acad Child Adolesc Psychiatry.1999;38(12):1580 –1590 25. Goodman R, Ford T, Simmons H, Gatward R, Meltzer H. Using
26. Fanaroff AA, Hack M, Walsh MC. The NICHD Neonatal Re-search Network: changes in practice and outcomes during the first 15 years.Semin Perinatol.2003;27(4):281–287
27. Lorenz J, Wooliever D, Jetton J, Paneth N. A quantitative review of mortality and developmental disability in extremely premature newborns.Arch Pediatr Adolesc Med.1998;152(5):425– 435 28. Costeloe K, Hennessy E, Gibson AT, Marlow N, Wilkinson AR,
EPIcure Study Group. The EPIcure Study: outcomes to dis-charge from hospital for infants born at the threshold of via-bility.Pediatrics.2000;106(4):659 – 671
29. Wood NS, Costeloe K, Gibson AT, Hennessy EM, Marlow N, Wilkinson AR. The EPICure study: associations and anteced-ents of neurological and developmental disability at 30 months of age following extremely preterm birth.Arch Dis Child Fetal Neonatal Ed.2005;90(2):F134 –F140
30. Wood NS, Marlow N, Costeloe K, Chir B, Gibson AT, Wilkin-son AR. Neurologic and developmental disability after ex-tremely preterm birth.N Engl J Med.2000;343(6):378 –384 31. Wolke D, Samara M, Bracewell M, Marlow N. Specific
lan-guage difficulties and school achievement in children born at 25 weeks of gestation or less.J Pediatr.2008;152(2):256 –262 32. Goodman R. The Strengths and Difficulties Questionnaire: a
research note.J Child Psychol Psychiatry.1997;38(5):581–586 33. Goodman R. Psychometric properties of the Strengths and
Difficulties Questionnaire. J Am Acad Child Adolesc Psychiatry.
2001;40(11):1337–1345
34. Achenbach T.Manual for the Child Behavior Checklist/4 –18 and 1991 Profile. Burlington, VT: University of Vermont; 1991 35. Elander J, Rutter M. An update on the status of the Rutter
Parents’ and Teachers’ Scale.Child Psychol Psychiatry Rev.1996; 1(1):31–35
36. Goodman R, Scott S. Comparing the Strengths and Difficulties Questionnaire and the Child Behavior Checklist: is small beau-tiful?J Abnorm Child Psychol.1999;27(1):17–24
37. Klasen H, Woerner W, Wolke D, et al. Comparing the German versions of the Strengths and Difficulties Questionnaire (SDQ-Deu) and the Child Behavior Checklist.Eur Child Adolesc Psy-chiatry.2000;9(4):271–276
38. Conners CK, Sitarenios G, Parker JD, Epstein JN. Revision and restandardization of the Conners’ Teacher Rating Scale (CTRS-R): factor structure reliability, and criterion validity.J Abnorm Child Psychol.1998;26(4):279 –291
39. Conners CK, Sitarenios G, Parker JD, Epstein JN. The revised Conners’ Parent Rating Scale (CPRS-R): factor structure, reli-ability, and criterion validity. J Abnorm Child Psychol. 1998; 26(4):257–268
40. Swanson JM.School-Based Assessments and Interventions for ADD Students. Irvine, CA: K. C. Publishing; 1992
41. American Psychiatric Association.Diagnostic and Statistical Man-ual of Mental Disorders. 4th ed. Washington, DC: American Psychiatric Association; 1994
42. Cohen NJ, Minde K. The “hyperactive syndrome” in kindergarten children: comparison of children with pervasive and situational symptoms.J Child Psychol Psychiatry.1983;24(3):443– 455 43. Kaufman A, Kaufman N.Kaufman Assessment Battery for
Chil-dren.Circle Pines, MN: American Guidance Service; 1983 44. Griffiths R.Abilities of Young Children: A Comprehensive System of
Mental Measurement for the First 8 Years of Life.Chard, England: Young and Son; 1970
45. Korkman M, Kirk U, Kemp S.Manual for the NEPSY: A Devel-opmental Neuropsychological Assessment.San Antonio, TX: Har-court Brace Jovanovich; 1998
46. Bayley N. Bayley Scales of Infant Development. 2nd ed. San Antonio, TX: Psychological Corp; 1993
47. Achenbach TM, Krukowski RA, Dumenci L, Ivanova MY. As-sessment of adult psychopathology: meta-analyses and
impli-cations of cross-informant correlations. Psychol Bull. 2005; 131(3):361–382
48. Achenbach TM, Rescorla LA. Developmental issues in assess-ment, taxonomy, and diagnosis of psychopathology: life span and multicultural perspectives. In: Cichetti D, Cohen DJ, eds.
Developmental Psychopathology, Vol 1: Theory and Method. Hobo-ken, NJ: Wiley; 2006:139 –180
49. Biederman J, Faraone SV. Attention-deficit hyperactivity dis-order.Lancet.2005;366(9481):237–248
50. Moffitt TE, Avshalom C. Childhood predictors differentiate life-course persistent and adolescence-limited antisocial pathways among males and females.Dev Psychopathol.2001;13(2):355–375 51. Inder TE, Warfield SK, Wang H, Huppi PS, Volpe JJ. Abnormal cerebral structure is present at term in premature infants.
Pediatrics.2005;115(2):286 –294
52. Kesler SR, Ment LR, Vohr B, et al. Volumetric analysis of regional cerebral development in preterm children. Pediatr Neurol.2004;31(5):318 –325
53. MacKendrick W. Understanding neurodevelopment in prema-ture infants: applied chaos theory.J Pediatr.2006;148(4):427– 429 54. Kapellou O, Counsell SJ, Kennea N, et al. Abnormal cortical development after premature birth shown by altered allomet-ric scaling of brain growth.PLoS Med.2006;3(8):e265 55. Marlow N, Hennessy EM, Bracewell M, Wolke D. Motor and
executive function at 6 years of age after extremely preterm birth.Pediatrics.2007;120(4):793– 804
56. Wolke D, Schulz J, Meyer R. Long-term developmental outcome of very prematurely born infants. Bavarian Longitudinal Study [in German].Monatsschr Kinderheilkd.2001;149(suppl 1):S53–S61 57. Horwood J, Waylen A, Herrick D, Williams C, Wolke D. Com-mon visual defects and peer victimization in children.Invest Ophthalmol Vis Sci.2005;46(4):1177–1181
58. Williams C, Horwood J, Northstone K, Herrick D, Waylen A, Wolke D. The timing of patching treatment and a child’s well-being.Br J Ophthalmol.2006;90(6):670 – 671
59. Smith PK, Morita Y, Junger-Tas J, Olweus D, Catalano R, Slee P.The Nature of School Bullying: A Cross-national Perspective. Lon-don, England: Routledge; 1999
60. Bracewell MA, Hennessy EM, Wolke D, Marlow N. The EPI-Cure study: growth and blood pressure at 6 years of age fol-lowing extremely preterm birth.Arch Dis Child Fetal Neonatal Ed.2008;93(2):108 –114
61. Sansavini A, Guarini A, Alessandroni R, Faldella G, Giovanelli G, Salvioli G. Are early grammatical and phonological working memory abilities affected by preterm birth?J Commun Disord.
2007;40(3):239 –256
62. Marlow N, Roberts BL, Cooke I. Motor skills in extremely low birthweight children at the age of 6 years. Arch Dis Child.
1989;64(6):839 – 847
63. Taylor HG, Burant CJ, Holding PA, Klein N, Hack M. Sources of variability in sequelae of very low birth weight.Child Neuro-psychol.2002;8(3):163–178
64. Schneider W, Wolke D, Schlagmu¨ller M, Meyer R. Pathways to school achievement in very preterm and full term children.Eur J Psychol Educ.2004;19(4):385– 406
65. Meltzer H, Gatward R, Goodman R, Ford T. Mental health of children and adolescents in Great Britain. Int Rev Psychiatry.
2003;15(1–2):185–187
66. Harrison H. Outcomes in young adulthood for very-low-birth-weight infants [letter].N Engl J Med.2002;347(2):141 67. Meltzer H, Gatward R, Goodman R, Ford T. Mental Health of
Children and Adolescents in Great Britain. London, England: Sta-tionery Office; 2000
APPENDIX Additional Scales
Parents
Overactive/impulsive subscale (5 items) Restless, overactive, cannot stay still for long Constantly fidgeting or squirming
Leaves seat in classroom or in situations in which remaining seated is expected
Has difficulty playing or working quietly Has difficulty waiting his or her turn in games Attention problems subscale (7 items)
Has short attention span
Is easily distracted, concentration wanders Is easily frustrated in efforts
Only attends if it is something of personal interest Sees tasks through to the end, good attention spana
Does not follow through on instructions (fails to finish school work) Thinks things out before actinga
School adaptation difficulties (5 items) Worries about school
Has found it difficult to settle in school Needs special attention to cope with school Finds it difficult to separate from parents Enjoys schoola
Teachers
Overactive/impulsive subscale (6 items) Restless, overactive, cannot stay still for long
Leaves seat in classroom or in situations in which remaining seated is expected
Constantly fidgeting or squirming Has difficulty playing or working quietly Has difficulty waiting his or her turn Interrupts or intrudes on others Attention problems subscale (6 items)
Only pays attention to things she or he is really interested in Has short attention span
Is easily distracted, concentration wanders Sees tasks through to the end, good attention spana
Does not follow through on instructions (fails to finish school work) Thinks things out before actinga
School adaptation difficulties (5 items) Has found it difficult to settle in school Needs special attention to cope with school Finds it difficult to separate from parents Worries about school
Enjoys schoola
DOI: 10.1542/peds.2007-3231
2008;122;562
Pediatrics
Muthanna Samara, Neil Marlow and Dieter Wolke
25 Weeks of Gestation
≤
Children Born at
Pervasive Behavior Problems at 6 Years of Age in a Total-Population Sample of
Services
Updated Information &
http://pediatrics.aappublications.org/content/122/3/562
including high resolution figures, can be found at:
References
http://pediatrics.aappublications.org/content/122/3/562#BIBL
This article cites 58 articles, 15 of which you can access for free at:
Subspecialty Collections
sub
http://www.aappublications.org/cgi/collection/fetus:newborn_infant_
Fetus/Newborn Infant
rning_disorders_sub
http://www.aappublications.org/cgi/collection/cognition:language:lea
Cognition/Language/Learning Disorders
following collection(s):
This article, along with others on similar topics, appears in the
Permissions & Licensing
http://www.aappublications.org/site/misc/Permissions.xhtml
in its entirety can be found online at:
Information about reproducing this article in parts (figures, tables) or
Reprints
http://www.aappublications.org/site/misc/reprints.xhtml
DOI: 10.1542/peds.2007-3231
2008;122;562
Pediatrics
Muthanna Samara, Neil Marlow and Dieter Wolke
25 Weeks of Gestation
≤
Children Born at
Pervasive Behavior Problems at 6 Years of Age in a Total-Population Sample of
http://pediatrics.aappublications.org/content/122/3/562
located on the World Wide Web at:
The online version of this article, along with updated information and services, is
by the American Academy of Pediatrics. All rights reserved. Print ISSN: 1073-0397.