International Journal of Community Medicine and Public Health | January 2019 | Vol 6 | Issue 1 Page 395 Raut MK et al. Int J Community Med Public Health. 2019 Jan;6(1):395-411
http://www.ijcmph.com pISSN 2394-6032 | eISSN 2394-6040
Original Research Article
Enablers of vitamin A coverage among children under five years of age
from multi-country analyses of global demographic and health surveys
in selected LMIC and LIC countries in Africa and Asia:
a random forest analysis
Manoj Kumar Raut
1*, J. C. Reddy
1, Debabrata Bera
2, Kirti Warvadekar
1INTRODUCTION
Vitamin A deficiency (VAD) is a major public health problem in many developing countries. VAD causes xerophthalmia, a range of eye conditions from night blindness to more severe clinical outcomes such as
keratomalacia and corneal scars, and permanent blindness. WHO recommends vitamin A supplementation (VAS) with a dose of 30 mg retinol equivalents in infants aged 6–11 months and 60 mg retinol equivalents at least twice a year in young children aged 12–59 months living in settings where VAD is a public health problem. A ABSTRACT
Background: Vitamin A deficiency is a common form of micronutrient malnutrition. The estimated relative risks associated with vitamin A deficiency in children were 1.86 (95% CI 1.32–2.59) for measles mortality, 2.15 (95% CI 1.83–2.58) for diarrhoea mortality, 1.78 (95% CI 1.43–2.19) for malaria mortality, 1.13 (95% CI 1.01–1.32) for other infectious disease mortality. Vitamin A supplementation reduces night blindness, child morbidity and mortality. Methods: This paper tries to explore the socio-demographic causes of receipt of vitamin A in selected lower-middle-income and low lower-middle-income countries by analysing the data of the demographic and health surveys from 2012 and 2016 using PASW 18.0 software. Multivariate binary logistic regressions were conducted to explore the role of socio-demographic covariates in the receipt of vitamin A supplementation. In addition, random forest (RF) analyses were conducted using Python 3.6.
Results: After adjusting for related socio-economic and demographic factors, mother’s work status and education and among mass media channels, exposure to television seems to play an important role in predicting receipt of vitamin A in the selected countries in Asia, while education of the mother was significantly associated with the receipt of vitamin A in the selected countries of Africa. In all the selected countries, the RF analyses revealed mother’s education followed by wealth index and mass media (TV), as the variable of most importance.
Conclusions: It can be concluded that mother’s education and mass media seems to be working well in making the mothers aware about the vitamin A campaign, especially, the exposure to television. It also figures in the variable importance matrix in addition to wealth index.
Keywords: Vitamin A supplementation, Vitamin A deficiency, Maternal education, Mass media, Wealth index, Demographic and health surveys
1
Regional Research and Evaluation Unit, Asia, Nutrition International, Asia Regional Office, New Delhi, India 2
Hi-Tech, Manufacturing and Services (HMS) analytics, Genpact, Candor TechSpace, Gurgaon, Haryana, India
Received: 10 November 2018 Revised: 12 December 2018 Accepted: 14 December 2018
*Correspondence: Dr. Manoj Kumar Raut,
E-mail: [email protected]
Copyright: © the author(s), publisher and licensee Medip Academy. This is an open-access article distributed under the terms of the Creative Commons Attribution Non-Commercial License, which permits unrestricted non-commercial use, distribution, and reproduction in any medium, provided the original work is properly cited.
meta-analysis of 17 trials (11 in Asia, 5 in Africa and 1 in Latin America) for all-cause mortality indicated that vitamin A reduces the overall risk of death by 24% (risk ratio (RR) 0.76; 95% confidence interval (CI) 0.69– 0.83).1,2 After considering an unpublished cluster-randomized trial involving one million children in north India (the DEVTA trial), VAS reduced the effect size of all-cause mortality from 24% to 12% (RR 0.88; 95% CI 0.84–0.94). Vitamin A programming is a prerequisite for achieving one of the sustainable development goals (SDG 3, target 3.2, indicator 3.2.1) of reducing under five mortality to at least as low as 25 per 1,000 live births by 2030. The global prevalence of VAD in children under age 5 has declined from about 39 per cent to about 30 per cent over the past two decades. However, progress has not been seen in South Asia and sub-Saharan Africa, where today, vitamin A deficiency still affects around 44 per cent and 48 per cent of children under age five years, respectively. More than 95 per cent of vitamin A-related measles and diarrhoea deaths occur in these regions – and VAS offers a powerful tool for preventing them.3
A literature review was undertaken to understand the determinants of VAS in other studies. Agarwal and Agarwal have shown that rural children and children of educated mothers were more likely to receive VAS than others.4 Children born in a higher birth order (6+) and those residing in states with low levels of social and economic development were only about half as likely to receive VAS as their counterparts in a cross-sectional study of 20,802 children aged 12-35 months whose mothers participated in the third round of the National Family Health Survey (NFHS-3) conducted during 2005-2006, where the association between the socio-economic and demographic characteristics of the children, the social and economic development status of the State in which they reside and VAS status were examined by means of unadjusted and adjusted logistic regression models. Kimani-Murage et al, analyzed the data of Kenya Demographic and Health Survey 2008-09 and found a positive association between receiving VAS and stunting levels.5 They also found a strong negative relationship between receiving vitamin A supplement and underweight status. They found that VAS may be beneficial to the growth of young children. They have also noted that the analysis was not able to establish a causal relationship, given the cross-sectional nature of the data and have thus recommended longitudinal studies to determine causal relationships. Semba et al, found that maternal education is an important factor relating to receipt of a vitamin A capsule in the BDHS 2004 data.6 A higher level of formal education achieved by girls may be a key factor in breaking the intergenerational cycle of malnutrition and poverty. Since younger maternal age was also associated with the lower coverage, further efforts are, thus, required by the VAS programmes to reach young, uneducated primigravida mothers. Also, children of households of higher socioeconomic status were more likely to have received a vitamin A capsule. Thapa et al, have analysed the data of Nepal
Demographic & Health Survey, 2001 and found that the beneficial effect of VAS on child mortality is larger than that found in most earlier clinical studies.7 This larger effect may be due mainly to the other health related activities undertaken by the female community health volunteers who distribute vitamin A capsules.
VAS of 6-59 months old children living in areas where vitamin A deficiency is a problem can reduce their risk of dying by an average of 23%.8 VAD was 1·5 more likely in children with anaemia than in children who did not have anaemia (95% CI 1·08–2·10; p=0·047).9 The latest estimates (2016) tell us that 64 per cent of children in need in priority countries were reached with two doses of vitamin A – but more than 140 million children were left behind, leaving them vulnerable to disease and death. VAD affects almost half of children under 5 years in south Asia and sub-Saharan Africa.10
The effect of VAS on diarrhoea disease during infancy and, in particular, whether VAS would reduce rotavirus infection and morbidity, because rotavirus is one of the leading causes of life-threatening diarrhoea in infants in sub-Saharan Africa.11 Three trials from southern Asia have reported that neonatal VAS reduced mortality by 21% in the first six months of life.12 Globally, night blindness affects 5.2 million pre-school age children (95% CI: 2.0–8.4 million) and 9.8 million pregnant women (95% CI: 8.7–10.8 million), which corresponds to 0.9% and 7.8% of the population at risk of VAD respectively. According to current estimates, 122 countries are classified as having a moderate to severe public health problem based on biochemical VAD in preschool-age children; while 88 countries are classified as having a problem of moderate to severe public health significance with respect to biochemical VAD in pregnant women.13 Further in 2013, VAD accounted for 2% of all deaths in children under 5 years of age in the sub-Saharan Africa region.14 Most importantly, vitamin A supplements can improve a child’s chance of survival by 12 to 24 per cent.15
Study objectives
The objectives of the study are to examine the association between different socio-demographic characteristics and receipt of vitamin A in selected LMIC and LIC countries in the Africa and Asia region.
METHODS
International Journal of Community Medicine and Public Health | January 2019 | Vol 6 | Issue 1 Page 397 country research institutes. We used the existing
weighted data of children under five years of age for our analyses. Individual level datasets were analysed using PASW Statistics 18, Release 18.0 software.
Multivariate binary logistic regression
Multivariate Binary logistic regressions were conducted to explore factors associated with VAS. Logistic regression can be used to predict a dependent variable on the basis of independent variables and to determine the per cent of variance in the dependent variable explained by independent variables; to rank the relative importance of independents; to assess interaction effects; and to understand the impact of covariates. Logistic regression applies maximum likelihood estimation after transforming the dependent variable into a logit variable (the natural log of the odds of the dependent occurring or not). In this way, logistic regression estimates the probability of a certain event occurring. Note that logistic regression calculates changes in the log odds of the dependent, not changes in the dependent variable itself, as OLS regression does. In addition to bivariate analysis, multivariate analysis was performed to control for the effects of other factors. Binary logistic regression models were used to explore associations between the dependent variable and independent variables, adjusting for socio-demographic and economic covariates. The dependent variable was coded as 1 if the child had received vitamin A supplements in the last six months and 0 if the child had not received vitamin A supplements in the last six months. The age group has been taken as 9-59 months to give adequate exposure of 6 months to a child considering the fact that usually in some countries, vitamin A campaign rounds are held biannually every six months.
Random forest analyses (RF)
In addition, random forest analysis was used to identify feature (independent variables) importance and model accuracy for two extreme countries from Africa and Asia each. Random forest is a recently developed machine learning technique that deals with classification and clustering of data non-parametrically. It is an ensemble method that combines a number of trees by taking the same number of bootstrap samples from the original data, and growing a tree on each bootstrap sample. Tree implementations are very simple and user-friendly and require fewer techniques from the investigator. The individual trees in a random forest are not pruned and used for decision in classification or clustering. Random forest uses a randomly selected subset of predictors for splitting the root nodes in to new daughter nodes for each split. From all trees grown in this process based on the bootstrap samples, we generate a forest. From the complete forest, the response variable for an instance is predicted as an average or majority vote of the predictions of all trees. Random forest can highly increase the prediction accuracy compared to an
individual tree, as the ensemble reduces the variance. The RF is one of the most effective machine learning models for predictive analytics.16,17 The model feature importance from sklearn random forest was used to calculate feature importance. Random forest uses gini importance or mean decrease in impurity (MDI) to calculate the importance of each feature. Gini importance is also known as the total decrease in node impurity. This is how much the model fit or accuracy decreases when you drop a variable. The larger the decrease, the more significant the variable is. Here, the mean decrease is a significant parameter for variable selection. The Gini index can describe the overall explanatory power of the variables. For this RF analysis, Python 3.6 software was used.
Covariates considered in random forest and multivariate binary logistic regression model
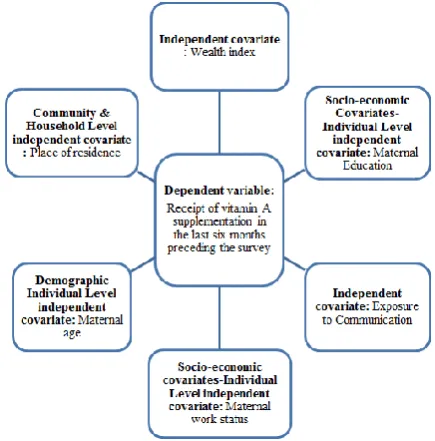
Based on a literature review, the analysis of these survey data considered the following covariates in Figure 1.
Figure 1: Conceptual framework.
Demographic and socio-economic profile of the countries
128 in Nigeria in Africa and 29 under-five deaths per thousand live births in Philippines to 87 under-five deaths per thousand live births in Pakistan in Asia.
Ethical approval
Procedures and questionnaires for standard DHS surveys have been reviewed and approved by ICF Institutional Review Board (IRB). Additionally, country-specific DHS
survey protocols are reviewed by the ICF IRB and typically by an IRB in the host country. ICF IRB ensures that the survey complies with the U.S. Department of Health and Human Services regulations for the protection of human subjects (45 CFR 46), while the host country IRB ensures that the survey complies with laws and norms of the nation: https://dhsprogram.com/What-We-
Do/Protecting-the-Privacy-of-DHS-Survey-Respondents.cfm.
Table 1: Socio-demographic profile of the selected countries in Africa and Asia.
Sl.
No. Indicators
Africa Asia
Ethiopia Kenya Nigeria Senegal Tanzania Bangladesh India Indonesia Pakistan Philippines
1 Population(in million), 1
st
July’2017 (Projected) 104.96 49.70 190.89 15.85 57.31 164.67 1,339.17 262.99 197.02 104.92
2
Annual rate of population change (2017) (%) (Estimated
2.6 2.7 2.7 3.0 3.1 1.2 1.2 1.3 2.1 1.6
3 Urban population (%) 19 25 46 43 30 23.3 31.2 54 32.5 44
4 Population density
(persons per sq. km.) 100 83 199 78 61 1238 382 143 246 341
5 Total fertility rate(lifetime
births per woman) 4.63 4.10 5.74 5.0 5.24 2.22 2.3 2.6 3.8 3.05
6
Crude birth rate (no. of live births per 1000 mid-year population)
33.6 33.1 40.5 37.6 39.8 20.2 20.8 20.4 29.8 24.1
7
Neonatal mortality rate (no. of neonatal deaths per 1000 live births)
(SDG3, Target 3.2, Indicator 3.2.2)
28 22 34 21 19 23 26 14 46 13
8
Infant mortality rate (no. of infant deaths per 1000 live births)
41 36 51 34 40 34 43 22 64 22
9
Under-five mortality rate (no. of under-5 deaths per 1000 live births) (SDG 3, Target 3.2, Indicator 3.2.1)
58 49 91 47 57 28 35 26 79 27
10
Maternal mortality ratio (no. of maternal deaths per 100,000 live births) (SDG 3, Target 3.1, Indicator 3.1.1)
412 362 576 315 530 176 167 126 178 120
11
Status of Human Development Index (in rank), UNDP
172 146 152 162 151 139 131 113 147 116
12 GDP per capita (Current
USD) 768 1,508 1,969 1,033 936 1,384 1,940 3,847 1,548 2,989
13 World Bank Classification Low income
Lower middle income
Lower middle income
Low income
Low income
Lower middle income
Lower middle income
Lower middle income
Lower middle income
Lower middle income Source: Demographic and Health Surveys 2007-16, United Nations18, HDR 201619, UNICEF, 201820
RESULTS
The comparative analyses of the ten countries reveal that children 9 to 59 months of age, who received vitamin A varies from 41.8% in Nigeria to 81.3% in Senegal in Africa. It varies from 58.8% in India to 77.0% in Philippines in Asia. The trends in vitamin A coverage in the several rounds of demographic and health surveys vary from an average annual rate of increase (AARI) of -7.4% in Tanzania from 2010 to 2015-16 to 18.8% in Kenya from 2008-09 to 2014 in Africa and -0.3% in Bangladesh from 2007 to 2014 to 14.2% in case of India
during 2005-06 to 2015-16. Receipt of VAS does not vary much by sex of the child.
Results of the bivariate analyses
International Journal of Community Medicine and Public Health | January 2019 | Vol 6 | Issue 1 Page 399 across all countries similarly, receipt of vitamin A was
also found to be higher among the literates, higher among those who had two or less two children, higher among the households belonging to the higher socio-economic
status, higher among those who were exposed to mass media communication channels of newspaper, radio and television.
Table 2: Trends in per cent of children receiving vitamin A supplementation in the selected countries in Africa and Asia: DHS, 2007- 16.
Sl. No Region Country DHS rounds
% of children age 6 to 59 months who received vitamin A supplements in the six months preceding the survey
Average annual rate of increase (AARI (%))
1
Africa
Ethiopia 2011 53.1 -3.4
2016 44.7
2 Kenya 2008-09 30.3 18.8
2014 71.7
3 Nigeria 2008 25.8 9.9
2013 41.3
4 Senegal
2010-11 78.4
-0.2 2012-13 83.7
2014 88.6
2015 88.4
2016 77.5
5 Tanzania 2010 60.8 -7.4
2015-16 41.3
6
Asia
Bangladesh
2007 83.5
-0.3
2011 62.1
2014 60.9
7 India 2005-06 15.6 14.2
2015-16 59.1
8 Indonesia 2007 68.5 -2.3
2012 61.1
9 Pakistan 2006-07 60.2 3.1
2012-13 72.1
10 Philippines 2008 75.9 1.9
2013 85.2
Sources: Demographic & Health Surveys, 2007-16.
Table 3: Per cent of children age 6 to 59 months who received VAS in the six months preceding the survey by sex in the selected countries in Africa and Asia: DHS, 2012- 16
Sl. No Region Country DHS Rounds Children (6 to 59 months)
Boys (6 to 59 months)
Girls (6 to 59 months)
Gender Parity Index in VAS coverage*
1
Africa
Ethiopia 2016 44.7 44.9 44.5 0.99
2 Kenya 2014 71.7 71.6 71.9 1.00
3 Nigeria 2013 41.3 41.5 41.1 0.99
4 Senegal 2016 77.5 77.4 77.6 1.00
5 Tanzania 2015-16 41.3 41.9 40.6 0.97
6
Asia
Bangladesh 2014 60.9 61.7 60.0 0.97
7 India 2015-16 59.1 59.1 59.1 1.00
8 Indonesia 2012 61.1 60.5 61.8 1.02
9 Pakistan 2012-13 72.1 72.1 72.1 1.00
10 Philippines 2013 85.2 84.1 86.4 1.03
Table 4: Socio-demographic and economic characteristics of the mothers in the selected countries in Africa and Asia, DHS (2012-16) (%).
Socio-demographic and economic characteristics
Africa Asia
Ethiopia Kenya Nigeria Senegal Tanzania Bangladesh India Indonesia Pakistan Philippines
DHS rounds 2016 2014 2013 2016 2015-16 2014 2015-16 2012 2012-13 2013
N (Weighted cases) 8,392 15,262 23,314 4,694 7,481 6,635 201,758 16,948 3,420 6,982
Community level covariates Place of residence
Rural 89.1 65.5 63.8 62.9 73.7 74.8 71.3 50.4 69.5 53.3
Urban 10.9 34.5 36.2 37.1 26.3 25.2 28.7 49.6 30.5 46.7
Individual level covariates Maternal education
Non-literate 67.4 12.2 48.6 65.0 21.7 16.7 30.1 2.2 56.1 1.6
Literate 32.6 87.8 51.4 35.0 78.3 83.3 69.9 97.8 43.9 98.4
Demographic covariates Maternal age (years)
15-24 19.4 26.5 22.4 21.1 26.9 46.3 32.0 21.8 22.2 26.4
25-34 54.4 52.7 50.7 50.8 45.9 45.6 58.9 52.6 56.0 47.5
35-49 26.2 20.8 26.9 28.1 27.2 8.2 9.0 25.6 21.8 26.1
Socio-economic covariates Maternal work status
Not working currently 71.5 68.9 30.0 57.7 20.0 72.7 96.9 52.3 72.5 61.0
Working currently 28.5 31.1 70.0 42.3 80.0 27.3 3.1 47.7 27.5 39.0
Wealth index
Poorest 23.9 24.1 23.0 25.1 24.3 23.0 24.9 22.0 23.1 27.4
Poorer 22.9 21.0 22.3 22.5 21.4 18.7 21.7 19.2 20.2 21.8
Middle 21.0 18.1 19.0 19.4 19.6 19.1 19.8 19.5 17.8 20.0
Richer 18.0 17.2 18.0 17.9 18.4 20.2 18.5 20.3 22.5 17.4
Richest 14.2 19.5 17.7 15.2 16.3 19.0 15.1 19.0 16.3 13.3
Communication exposure – Mass media Newspaper
Never read Newspaper 93.6 71.4 85.9 88.6 64.5 85.7 67.3 52.4 76.4 40.5
Read Newspaper 6.4 28.6 14.1 11.4 35.5 14.3 32.7 47.6 23.6 59.5
Radio
Never listened to Radio 74.0 21.9 39.4 16.3 25.9 95.3 86.7 49.0 84.0 20.6
Listened to Radio 26.0 78.1 60.6 83.7 74.1 4.7 13.3 51.0 16.0 79.4
Television
Never watched TV 82.5 57.7 53.6 31.0 58.7 41.9 30.6 4.9 36.9 10.1
International Journal of Community Medicine and Public Health | January 2019 | Vol 6 | Issue 1 Page 401
Socio-demographic and economic characteristics
Africa Asia
Ethiopia Kenya Nigeria Senegal Tanzania Bangladesh India Indonesia Pakistan Philippines Vitamin A receipt among 9-59
months of children (weighted) Did not receive Vitamin A in the last
six months 55.2 28.1 58.2 18.7 57.9 36.4 41.2 36.6 26.0 23.0
Received Vitamin A in the last six
months 44.8 71.9 41.8 81.3 42.1 63.6 58.8 63.4 74.0 77.0
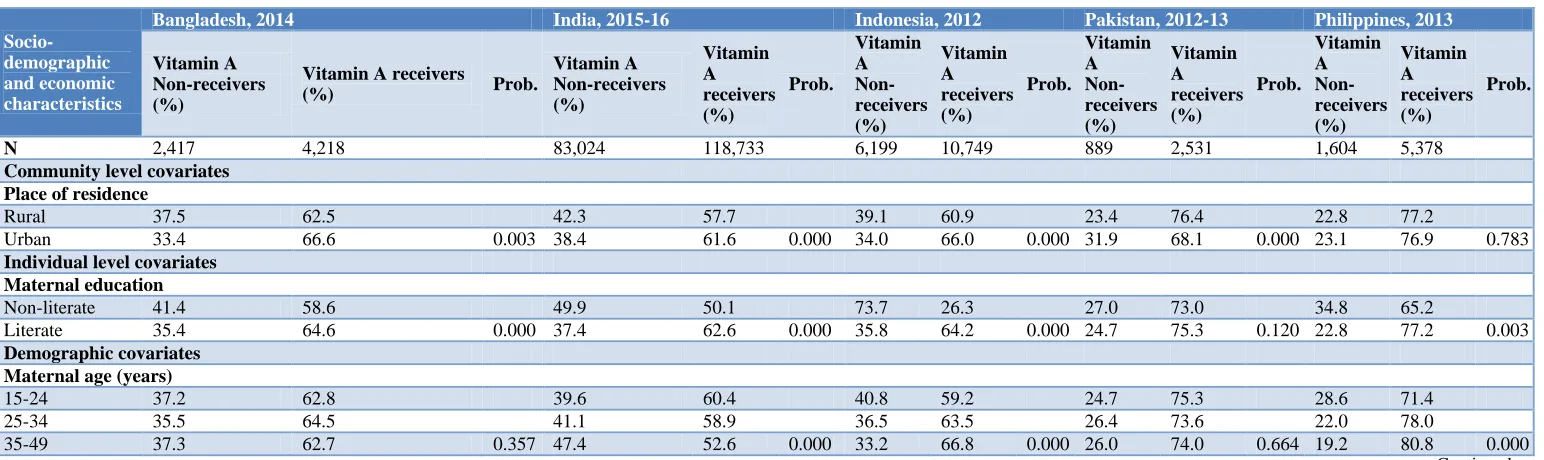
Table 5: Receipt of vitamin A in the last six months by socio-demographic and economic characteristics in selected countries in Africa, DHS.
Socio-demographic and economic characteristics
Ethiopia, 2015-16 Kenya, 2014 Nigeria, 2013 Senegal, 2016 Tanzania, 2015-16
Vitamin A non-receivers (%)
Vitamin A receivers (%)
Prob.
Vitamin A non-receivers (%)
Vitamin A receivers (%)
Prob.
Vitamin A non-receivers (%)
Vitamin A receivers (%)
Prob.
Vitamin A non-receivers (%)
Vitamin A receivers (%)
Prob.
Vitamin A non-receivers (%)
Vitamin A receivers (%)
Prob.
N (weighted
cases) 4,631 3,761 4,288 10,974 13,565 9749 878 3,816 4,328 3,152
Community level covariates Place of residence
Rural 57.0 43.0 30.0 70.0 64.9 35.1 20.0 80.0 59.7 40.3
Urban 40.4 59.6 0.000 24.5 75.5 0.000 46.3 53.7 0.000 16.6 83.4 0.004 52.8 47.2 0.000
Individual level covariates Maternal education
Non-literate 58.6 41.4 40.3 59.7 74.7 25.3 20.3 79.7 71.2 28.8
Literate 48.1 51.9 0.000 26.4 73.6 0.000 42.6 57.4 0.000 15.7 84.3 0.000 54.2 45.8 0.000
Demographic covariates Maternal age(years)
15-24 57.4 42.6 28.6 71.4 64.8 35.2 24.3 75.7 59.1 40.9
25-34 54.4 45.6 27.8 72.2 56.1 43.9 20.0 80.0 57.5 42.5
35-49 55.3 44.7 0.115 28.2 71.8 0.696 56.5 43.5 0.000 12.3 87.7 0.000 57.2 42.8 0.398
Socio-economic covariates Maternal work status Not working
currently 57.6 42.4 29.3 70.7 66.2 33.8 21.0 79.0 57.2 42.8
Working
currently 49.0 51.0 0.000 25.4 74.6 0.000 54.7 45.3 0.000 15.6 84.4 0.000 58.0 42.0 0.554
Wealth index
Poorest 59.5 40.5 35.7 64.3 78.7 21.3 25.1 74.9 69.9 30.1
Poorer 58.5 41.5 28.3 71.7 68.8 31.2 19.4 80.6 60.2 39.8
Middle 56.8 43.2 27.2 72.8 56.1 43.9 16.2 83.8 54.2 45.8
Richer 54.4 45.6 23.9 76.1 46.2 53.8 15.3 84.7 50.5 49.5
Richest 41.2 58.8 0.000 22.9 77.1 0.000 32.5 67.5 0.000 14.3 85.7 0.000 49.6 50.4 0.000
Socio-demographic and economic characteristics
Ethiopia, 2015-16 Kenya, 2014 Nigeria, 2013 Senegal, 2016 Tanzania, 2015-16
Vitamin A non-receivers (%)
Vitamin A receivers (%)
Prob.
Vitamin A non-receivers (%)
Vitamin A receivers (%)
Prob.
Vitamin A non-receivers (%)
Vitamin A receivers (%)
Prob.
Vitamin A non-receivers (%)
Vitamin A receivers (%)
Prob.
Vitamin A non-receivers (%)
Vitamin A receivers (%)
Prob.
Communication exposure- Mass media Newspaper
Never read
Newspaper 56.3 43.7 29.8 70.2 62.2 37.8 19.2 80.8 63.0 37.0
Read
Newspaper 38.8 61.2 0.000 23.7 76.3 0.000 33.5 66.5 0.000 14.6 85.4 0.009 48.6 51.4 0.000
Radio Never listened
to Radio 58.2 41.8 33.4 66.6 70.7 29.3 23.3 76.7 64.8 35.2
Listened to
Radio 46.5 53.5 0.000 26.6 73.4 0.000 50.0 50.0 0.000 17.8 82.2 0.000 55.5 44.5 0.000
Television Never watched
TV 57.0 43.0 31.2 68.8 70.3 29.7 24.9 75.1 61.5 38.5
Watched TV 46.7 53.3 0.000 23.9 76.1 0.000 44.1 55.9 0.000 16.0 84.0 0.000 52.7 47.3 0.000
Prob.: Probability value.
Table 6: Receipt of Vitamin A in the last six months by socio-demographic-economic variables in the countries in Asia, DHS
Socio-demographic and economic characteristics
Bangladesh, 2014 India, 2015-16 Indonesia, 2012 Pakistan, 2012-13 Philippines, 2013
Vitamin A Non-receivers (%)
Vitamin A receivers
(%) Prob.
Vitamin A Non-receivers (%)
Vitamin A receivers (%)
Prob.
Vitamin A Non-receivers (%)
Vitamin A receivers (%)
Prob.
Vitamin A Non-receivers (%)
Vitamin A receivers (%)
Prob.
Vitamin A Non-receivers (%)
Vitamin A receivers (%)
Prob.
N 2,417 4,218 83,024 118,733 6,199 10,749 889 2,531 1,604 5,378
Community level covariates Place of residence
Rural 37.5 62.5 42.3 57.7 39.1 60.9 23.4 76.4 22.8 77.2
Urban 33.4 66.6 0.003 38.4 61.6 0.000 34.0 66.0 0.000 31.9 68.1 0.000 23.1 76.9 0.783
Individual level covariates Maternal education
Non-literate 41.4 58.6 49.9 50.1 73.7 26.3 27.0 73.0 34.8 65.2
Literate 35.4 64.6 0.000 37.4 62.6 0.000 35.8 64.2 0.000 24.7 75.3 0.120 22.8 77.2 0.003
Demographic covariates Maternal age (years)
15-24 37.2 62.8 39.6 60.4 40.8 59.2 24.7 75.3 28.6 71.4
25-34 35.5 64.5 41.1 58.9 36.5 63.5 26.4 73.6 22.0 78.0
International Journal of Community Medicine and Public Health | January 2019 | Vol 6 | Issue 1 Page 403
Socio-demographic and economic characteristics
Bangladesh, 2014 India, 2015-16 Indonesia, 2012 Pakistan, 2012-13 Philippines, 2013
Vitamin A Non-receivers (%)
Vitamin A receivers
(%) Prob.
Vitamin A Non-receivers (%)
Vitamin A receivers (%)
Prob.
Vitamin A Non-receivers (%)
Vitamin A receivers (%)
Prob.
Vitamin A Non-receivers (%)
Vitamin A receivers (%)
Prob.
Vitamin A Non-receivers (%)
Vitamin A receivers (%)
Prob.
Socio-economic covariates Maternal work status Not working
currently 35.8 64.2 41.2 58.8 37.6 62.4 25.7 74.3 25.5 74.5
Working
currently 38.0 62.0 0.093 40.7 59.3 0.512 35.5 64.5 0.006 26.7 73.3 0.572 19.0 81.0 0.000
Wealth index
Poorest 42.6 57.4 48.0 52.0 46.1 53.9 31.6 68.4 27.8 72.2
Poorer 36.6 63.4 43.0 57.0 38.2 61.8 18.8 81.2 20.5 79.5
Middle 35.8 64.2 39.3 60.7 34.2 65.8 27.9 72.1 21.2 78.8
Richer 36.7 63.3 35.6 64.4 31.6 68.4 23.2 76.8 20.2 79.8
Richest 29.3 70.7 0.000 36.4 63.6 0.000 31.6 68.4 0.000 28.5 71.5 0.000 23.4 76.6 0.000
Communication exposure- Mass media Newspaper
Never read
Newspaper 38.1 61.9 44.7 55.3 38.6 61.4 26.5 73.5 25.0 75.0
Read
Newspaper 26.3 73.7 0.000 33.8 66.2 0.000 34.3 65.7 0.000 24.5 75.5 0.269 21.6 78.4 0.001
Radio Never listened
to Radio 36.7 63.3 42.1 57.9 38.6 61.4 26.1 73.9 27.6 72.4
Listened to
Radio 31.0 69.0 0.041 35.1 64.9 0.000 34.6 65.4 0.000 25.5 74.5 0.755 21.8 78.2 0.000
Television Never watched
TV 41.2 58.8 49.4 50.6 56.3 43.7 27.7 72.3 33.9 66.1
Watched TV 33.0 67.0 0.000 37.5 62.5 0.000 35.6 64.4 0.000 25.0 75.0 0.086 21.7 78.3 0.000
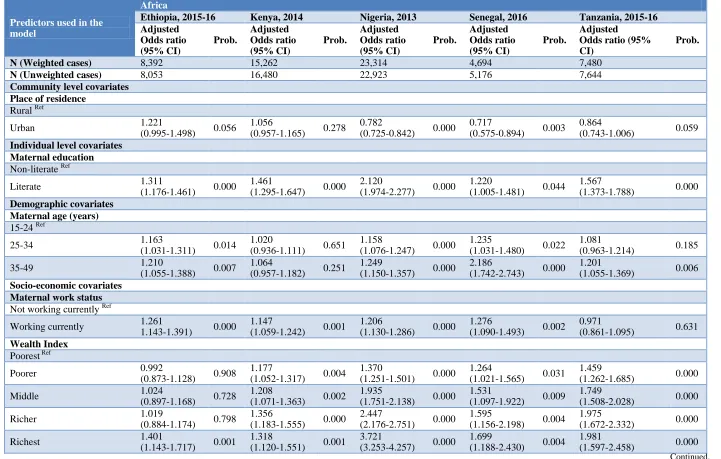
Table 7: Adjusted odds ratio from the multivariate binary logistic regression of factors associated with receipt of vitamin A in the last six months in the selected countries in Africa. (Dependent variable: Receipt of Vitamin A).
Predictors used in the model
Africa
Ethiopia, 2015-16 Kenya, 2014 Nigeria, 2013 Senegal, 2016 Tanzania, 2015-16
Adjusted Odds ratio (95% CI) Prob. Adjusted Odds ratio (95% CI) Prob. Adjusted Odds ratio (95% CI) Prob. Adjusted Odds ratio (95% CI) Prob. Adjusted Odds ratio (95% CI)
Prob.
N (Weighted cases) 8,392 15,262 23,314 4,694 7,480
N (Unweighted cases) 8,053 16,480 22,923 5,176 7,644
Community level covariates Place of residence
Rural Ref
Urban 1.221
(0.995-1.498) 0.056
1.056
(0.957-1.165) 0.278
0.782
(0.725-0.842) 0.000
0.717
(0.575-0.894) 0.003
0.864
(0.743-1.006) 0.059 Individual level covariates
Maternal education Non-literate Ref
Literate 1.311
(1.176-1.461) 0.000
1.461
(1.295-1.647) 0.000
2.120
(1.974-2.277) 0.000
1.220
(1.005-1.481) 0.044
1.567
(1.373-1.788) 0.000 Demographic covariates
Maternal age (years) 15-24 Ref
25-34 1.163
(1.031-1.311) 0.014
1.020
(0.936-1.111) 0.651
1.158
(1.076-1.247) 0.000
1.235
(1.031-1.480) 0.022
1.081
(0.963-1.214) 0.185
35-49 1.210
(1.055-1.388) 0.007
1.064
(0.957-1.182) 0.251
1.249
(1.150-1.357) 0.000
2.186
(1.742-2.743) 0.000
1.201
(1.055-1.369) 0.006 Socio-economic covariates
Maternal work status Not working currently Ref
Working currently 1.261
1.143-1.391) 0.000
1.147
(1.059-1.242) 0.001
1.206
(1.130-1.286) 0.000
1.276
(1.090-1.493) 0.002
0.971
(0.861-1.095) 0.631 Wealth Index
Poorest Ref
Poorer 0.992
(0.873-1.128) 0.908
1.177
(1.052-1.317) 0.004
1.370
(1.251-1.501) 0.000
1.264
(1.021-1.565) 0.031
1.459
(1.262-1.685) 0.000
Middle 1.024
(0.897-1.168) 0.728
1.208
(1.071-1.363) 0.002
1.935
(1.751-2.138) 0.000
1.531
(1.097-1.922) 0.009
1.749
(1.508-2.028) 0.000
Richer 1.019
(0.884-1.174) 0.798
1.356
(1.183-1.555) 0.000
2.447
(2.176-2.751) 0.000
1.595
(1.156-2.198) 0.004
1.975
(1.672-2.332) 0.000
Richest 1.401
(1.143-1.717) 0.001
1.318
(1.120-1.551) 0.001
3.721
(3.253-4.257) 0.000
1.699
(1.188-2.430) 0.004
1.981
International Journal of Community Medicine and Public Health | January 2019 | Vol 6 | Issue 1 Page 405
Predictors used in the model
Africa
Ethiopia, 2015-16 Kenya, 2014 Nigeria, 2013 Senegal, 2016 Tanzania, 2015-16
Adjusted Odds ratio (95% CI)
Prob.
Adjusted Odds ratio (95% CI)
Prob.
Adjusted Odds ratio (95% CI)
Prob.
Adjusted Odds ratio (95% CI)
Prob.
Adjusted Odds ratio (95% CI)
Prob.
Communication Exposure- Mass Media
Newspaper
Never read Newspaper Ref
Read Newspaper 1.174
(0.955-1.445) 0.128
1.117
(1.023-1.220) 0.014
1.286
(1.176-1.406) 0.000
0.981
(0.730-1.317) 0.897
1.422
(1.275-1.586) 0.000 Radio
Never listened to Radio Ref
Listened to Radio 1.379
(1.228-1.548) 0.000
1.018
(0.925-1.121) 0.716
1.346
(1.258-1.440) 0.000
1.166
(0.958-1.419) 0.125
1.085
(0.963-1.222) 0.179 Television
Never watched TV Ref
Watched TV 0.847
(0.729-0.984) 0.030
1.129
(1.022-1.246) 0.017
1.024
(0.945-1.110) 0.558
1.386
(1.119-1.716) 0.003
1.004
(0.893-1.128) 0.948 CI: Confidence Interval, ref Refers to Reference Category. Prob.: Probability value
Table 8: Adjusted odds ratio from the multivariate binary logistic regression of factors associated with receipt of vitamin A in the last six months in the selected countries in Asia. (Dependent variable: Receipt of Vitamin A).
Predictors used in the model
Asia
Bangladesh, 2014 India, 2015-16 Indonesia, 2012 Pakistan, 2012-13 Philippines, 2013 Adjusted
Odds Ratio (95% CI)
Prob.
Adjusted Odds Ratio (95% CI)
Prob.
Adjusted Odds Ratio (95% CI)
Prob.
Adjusted Odds Ratio (95% CI)
Prob.
Adjusted Odds Ratio (95% CI)
Prob.
N (weighted cases) 6,634 201,757 16,948 3,420 6,982
N (unweighted cases) 6,462 208,785 18,021 3,372 7,216
Community level covariates place of residence
Rural Ref
Urban 0.987
(0.862-1.129) 0.845
0.953
(0.931-0.976) 0.000
0.981
(0.912-1.055) 0.606
0.485
(0.391-0.601) 0.000
0.849
(0.747-0.964) 0.011 Individual level covariates
Maternal education Non-literate Ref
Literate 1.097
(0.949-1.267) 0.211
1.310
(1.279-1.341) 0.000
3.659
(2.864-4.675) 0.000
1.084
(0.865-1.359) 0.484
1.289
Predictors used in the model
Asia
Bangladesh, 2014 India, 2015-16 Indonesia, 2012 Pakistan, 2012-13 Philippines, 2013 Adjusted Odds Ratio (95% CI) Prob. Adjusted Odds Ratio (95% CI) Prob. Adjusted Odds Ratio (95% CI) Prob. Adjusted Odds Ratio (95% CI) Prob. Adjusted Odds Ratio (95% CI) Prob. Demographic covariates Maternal age (years) 15-24 Ref
25-34 1.100
(0.987-1.225) 0.084
0.969
(0.949-0.988) 0.002
1.135
(1.047-1.231) 0.002
0.937
(0.769-1.142) 0.517
1.404
(1.230-1.604) 0.000
35-49 1.090
(0.894-1.329) 0.395
0.859
(0.830-0.889) 0.000
1.354
(1.233-1.487) 0.000
0.963
(0.759-1.222) 0.756
1.703
(1.452-1.998) 0.000 Socio-economic covariates
Maternal work status Not working currently Ref
Working currently 0.924
(0.825-1.036) 0.176
1.048
(0.995-1.105) 0.077
1.092
(1.024-1.165) 0.008
1.024
(0.854-1.228) 0.796
1.337
(1.183-1.512) 0.000 Wealth index
Poorest Ref
Poorer 1.212
(1.036-1.417) 0.016
1.007
(0.979-1.035) 0.634
1.234
(1.116-1.364) 0.000
2.048
(1.590-2.638) 0.000
1.395
(1.174-1.657) 0.000
Middle 1.127
(0.954-1.332) 0.160
1.030
(0.998-1.062) 0.065
1.445
(1.302-1.604) 0.000
1.290
(0.990-1.683) 0.060
1.328
(1.106-1.595) 0.002
Richer 1.025
(0.859-1.222) 0.788
1.113
(1.074-1.152) 0.000
1.590
(1.425-1.773) 0.000
1.939
(1.437-2.617) 0.000
1.385
(1.135-1.691) 0.001
Richest 1.268
(1.033-1.557) 0.066
1.002
(0.963-1.042) 0.938
1.546
(1.375-1.737) 0.000
1.788
(1.238-2.583) 0.002
1.050
(0.849-1.298) 0.655 Communication exposure- Mass media
Newspaper
Never read Newspaper Ref
Read Newspaper 1.453
(1.230-1.717) 0.000
1.251
(1.222-1.281) 0.00
0.972
(0.904-1.044) 0.046
1.049
(0.828-1.328) 0.692
1.034
(0.909-1.176) 0.613 Radio
Never listened to Radio Ref
Listened to Radio 1.146
(0.893-1.471) 0.284
1.171
(1.140-1.204) 0.000
1.072
(1.001-1.148) 0.046
0.959
(0.771-1.192) 0.704
1.189
(1.026-1.377) 0.021 Television
Never watched TV Ref
Watched TV 1.280
(1.126-1.454) 0.000
1.305
(1.274-1.337) 0.000
1.533
(1.311-1.791) 0.000
1.157
(0.955-1.402) 0.135
1.528
International Journal of Community Medicine and Public Health | January 2019 | Vol 6 | Issue 1 Page 407 Figure 2: Random forest (RF) analyses using Python of assessment of variable importance in the selected ten countries in Africa and Asia (%).
Note: *Low Coverage Country; ** High Coverage Country.
Variable Ethiopia Kenya Nigeria* Senegal** Tanzania Bangladesh India* Indonesia Pakistan Philippines**
Maternal age 10 10 5 15 12 12 7 12 9 15
Place of residence 11 14 4 10 12 13 6 10 21 10
Maternal education 12 19 29 13 14 10 30 20 10 6
Exposure to new spaper 9 9 7 10 11 11 18 8 9 9
Exposure to radio 11 10 9 13 10 14 6 8 10 10
Exposure to television 18 16 17 14 10 13 12 16 11 18
Wealth index 15 11 23 13 21 12 12 14 19 14
Maternal w ork status 14 11 7 12 10 15 8 13 11 17
Total 100 100 100 100 100 100 100 100 100 100
Training Accuracy 59 68 67 73 63 61 84 63 62 80
Test Accuracy 56 66 66 74 64 59 84 62 60 80
Coverage of vitamin A supplementation 45 72 42 81 42 64 59 63 74 77
Figure 3: Per cent of children 6 to 59 months who received vitamin A supplements in the six months preceding the survey in selected countries around the world in recent DHS surveys.
Source: Stat compiler, ICF, 2015.
Countries DHS round
% of children age 6 to 59 months w ho received vitamin A supplements in the six months preceding the survey
Countries DHS round
% of children age 6 to 59 months w ho received vitamin A supplements in the six months preceding the survey
Af ghanistan 2015 DHS 47.5 Myanmar 2015-16 DHS 54.4
Angola 2015-16 DHS 6.0 Namibia 2013 DHS 83.6
Bangladesh 2014 DHS 60.9 Nepal 2016 DHS 82.5
Benin 2011-12 DHS 48.6 Niger 2012 DHS 59.6
Burundi 2016-17 DHS 68.7 Nigeria 2013 DHS 41.3
Cambodia 2014 DHS 69.6 Pakistan 2012-13 DHS 72.1
Chad 2014-15 DHS 44.1 Peru 2012 DHS 4.5
Comoros 2012 DHS 48.5 Philippines 2013 DHS 85.2
Congo Democratic
Republic 2013-14 DHS 70.4 Rw anda 2014-15 DHS 86.4
Cote d'Ivoire 2011-12 DHS 60.8 Senegal 2016 DHS 77.5
Dominican Republic 2013 DHS 34.2 Sierra Leone 2013 DHS 83.2
Egypt 2014 DHS 16.7 Tajikistan 2012 DHS 76.5
Ethiopia 2016 DHS 44.7 Tanzania 2015-16 DHS 41.3
Gabon 2012 DHS 53.8 Timor-Leste 2016 DHS 64.5
Gambia 2013 DHS 68.7 Togo 2013-14 DHS 81.7
Ghana 2014 DHS 65.2 Uganda 2016 DHS 61.6
Guatemala 2014-15 DHS 49.7 Yemen 2013 DHS 55.2
Guinea 2012 DHS 40.8 Zambia 2013-14 DHS 76.5
Haiti 2012 DHS 44.4 Zimbabw e 2015 DHS 67.4
India 2015-16 DHS 59.1
Indonesia 2012 DHS 61.1
Jordan 2012 DHS 11.0
Kenya 2014 DHS 71.7
Kyrgyz Republic 2012 DHS 43.8
Lesotho 2014 DHS 61.3
Liberia 2013 DHS 60.2
Malaw i 2015-16 DHS 64.2
International Journal of Community Medicine and Public Health | January 2019 | Vol 6 | Issue 1 Page 409 Results of the multivariate binary logistic regression
analyses
Predictors used in the model: Background community level and individual level socio-demographic and economic covariates, which are expected to be associated with vitamin A receipt have been entered in the model. The predictors used in the model are the place of residence, age of the woman, education of the mother, current work status of the mother, possession of household assets used in the construction of wealth quintile and exposure to mass media.
Education and working status of mothers was found to play a significant role; as a significant proportion of working mothers reported that the child received vitamin A as compared to non-working mothers and educated mothers reported that the child had received vitamin A compared to non-literate mothers. Examining the exposure to different mediums of communication, it was found that a significant proportion of mothers who watched television were more likely to have received vitamin A with the adjusted odds ratio ranging from 1.157 times to 1.528 times in the five countries in Asia. Mother’s education was found to be significantly associated with the receipt of vitamin A in all the five countries in Africa with adjusted odds ratio ranging from 1.220 times to 1.567 times.
Results of the random forest analyses
Predictors used in the model: The same list of background community level and individual level socio-demographic and economic covariates used what has been used for multivariate binary logistic regression. Analysis was carried out for all the ten countries including the lowest and highest vitamin A coverage countries; India and Philippines from Asia; and Nigeria and Senegal from Africa. Mother’s education was found to be one of the most important variable followed by wealth index and exposure to television, which was strongly associated with the receipt of vitamin A. It was found to have higher importance (>25%) in model score compared to other factors.
Levels and trends in vitamin A around the world in DHS countries: Among the 47 DHS countries, the most recent rounds of DHS surveys reveal that the vitamin A coverage varies from as low as 4.5% in Peru in the 2012 DHS to as high as 86.4% in Rwanda in the 2014-15 DHS round.
DISCUSSION
VAS has been around for many years in different countries of the world. Education and working status of mothers was found to play a significant role; as a significant proportion of working mothers reported that the child received vitamin A as compared to non-working
mothers and educated mothers reported that the child had received vitamin compared to non-literate mothers. Current paper is an effort to assess or find out the factors that may affect the uptake of vitamin A among children under five years of age across countries and regions of Asia and Africa. In addition to bivariate, multivariate analysis by considering the receipt of vitamin A in last six months as the dependent variable and different socio-economic and demographic covariates as predictors revealed that place of residence of mothers is significantly associated the receipt of vitamin A among the children across the regions and countries, except Philippines, where place of residence did not play any significant role and receipt of vitamin A was almost equal among rural and urban children. Covariates like mothers’ education, economic status of the mothers as well as exposure to mass media i.e. Television has significantly influenced the receipt of vitamin A across regions. This indicates that children of literate mothers, belonging to better off section of the society and having access to medium of communication like TV were having higher probability of receiving vitamin A. Work status of mother was found to have more of its impact on vitamin A coverage in African countries indicating that children of working mothers had a higher probability of vitamin A receipt. In few countries of both the regions it was found that probability of receiving the vitamin A by children increased with age of the mother. Results from the multivariate binary logistic regression depicts that education of mother and exposure to Television were the most significant factors affecting uptake of vitamin A, which corroborates the findings of Semba et al, who found that maternal education is an important factor relating to receipt of a vitamin A capsule in the BDHS 2004 data and that children belonging to households with higher socioeconomic status were more likely to have received a vitamin A capsule.6 Proximity of the mothers to the health facility, proper positioning of the VAS in the country health programs, frequent supplementation rounds as well as sweeping strategies post round also plays key role in enhancing the coverage. For assessing these factors there is a need to look upon country specific vitamin A programs and their strategies to bring in the more vulnerable sections of the population in geographical and social terms.
CONCLUSION
young mothers, not formally educated or illiterate mothers and mothers residing in rural areas. This can be achieved by training community health workers extensively to counsel about the benefits of vitamin A, conducting more localized and intensified behaviour change communication activities and most importantly by doing frequent supplementation rounds with extensive sweeping plans. Lessons from other health programs i.e. polio eradication can be considered as the best practice where extensive planning is done and an effort is made to not leave even a single child. Exposure to mass media seems to be a good predictor of VAS in the countries of Asia and mother’s education seems to be a good predictor in the countries of Africa. The need of the hour to is to use more and more mass media to communicate messages regarding the bi-annual vitamin A campaign in the countries of Asia and stress on mothers’ education in the countries of Africa.
ACKNOWLEDGEMENTS
The authors acknowledge the use of the data published on the public domain by DHS program implemented by ICF International and partners Blue Raster, The Futures Institute, The Johns Hopkins Bloomberg School of Public Health Center for Communication Programs (JHUCCP), PATH, and Vysnova, and two new partner organizations in 2013—EnCompass and Kimetrica.
Funding: No funding sources Conflict of interest: None declared Ethical approval: Not required
REFERENCES
1. Awasthi S, Peto R, Read S, Clark S, Pande V, Bundy D. Vitamin A supplementation every 6 months with retinol in 1 million pre-school children in north India: DEVTA, a cluster-randomised trial. Lancet. 2013;381:1469-77.
2. Imdad A, Mayo-Wilson E, Herzer K, Bhutta ZA. Vitamin A supplementation for preventing morbidity and mortality in children from six months to five years of age. Cochrane Database Systematic Rev. 2017;3:CD008524.
3. Stevens G, Bennett JE, Hennocq Q, Lu Y, De-Regil LM, Rogers L, et al. Trends and mortality effects of vitamin A deficiency in children in 138 low-income and middle-income countries between 1991 and 2013: a pooled analysis of population-based surveys. The Lancet Global Health. 2015;3(9):e528 -e536. 4. Agrawal S, Agrawal PK. Vitamin A supplementation
among children in India: Does their socio-economic status and the economic and social development status of their state of residence make a difference? Int J Med Public Health. 2013;3:48-54.
5. Kimani-Murage EW, Ndedda C, Raleigh K, Masibo, P. Vitamin A Supplementation and Stunting Levels Among Two Year Olds in Kenya: Evidence from the
2008-09 Kenya Demographic and Health Survey. International Journal of Child Health and Nutrition 2012;1:135-47.
6. Semba RD, De PS, Sun K, Akhter N, Bloem MW, Raju VK. Coverage of Vitamin A Capsule Programme in Bangladesh and Risk Factors Associated with Non-receipt of Vitamin A, J Health Population Nutr. 2010;;28(2):143-8.
7. Thapa S, Choe, Kim M, Retherford, Robert D. Effects of vitamin A supplementation on child mortality: evidence from Nepal’s 2001 Demographic and Health Survey, Tropical Medicine and International Health 2005;10(8):782–9.
8. Beaton GH, Martorell R, Aronson KJ, Edmonston B, McCabe G, Ross AC, et al. Effectiveness of vitamin A supplementation in the control of young child morbidity and mortality in developing countries. WHO, Geneva; 1993: 120.
9. Chaudhry AB, Hajat S, Rizkallah N, Ala’a Abu-Rub et al. Risk factors for vitamin A and vitamin D deficiencies in children younger than 5 years in the occupied Palestinian territory: a cross-sectional study. The Lancet. 2018;391:S3.
10. UNICEF. Coverage at a Crossroads: New directions for vitamin A supplementation programmes. New York: UNICEF; 2018.
11. Molbak K, Fischer TK, Mikkelsen CS. The estimation of mortality due to rotavirus infections in sub-Saharan Africa. Vaccine 2000;19(4–5):393–5. 12. Bhutta ZA, Ahmed T, Black RE, Cousens S, Dewey
K, Giugliani E, et al. What works? Interventions for maternal and child undernutrition and survival. Lancet 2008;371:417–40.
13. WHO. Global prevalence of vitamin A deficiency in populations at risk 1995–2005. WHO Global Database on Vitamin A Deficiency? Geneva, World Health Organization, 2009.
14. Stevens GA, Bennett JE, Hennocq Q et al. Trends and mortality effects of vitamin A deficiency in children in 138 low-income and middle-income countries between 1991 and 2013: a pooled analysis of population-based surveys. Lancet Glob Health. 2015;3:e528–36.
15. UNICEF. Vitamin A Supplementation: A Statistical Snapshot. New York: UNICEF 2016.
16. Hastie T, Tibshirani R, Friedman JH. The Elements of Statistical Learning: Data Mining, Inference and Prediction; Second edition. Springer-Verlag, New York. 2009.
17. Gilles L, Louis W, Antonio S, Pierre G. Understanding variable importances in forests of randomized trees, Dept. of EE & CS, University of Li`ege, Belgium. 2013.
18. United Nations, Department of Economic and Social Affairs, Population Division, 2017, World Population Prospects: The 2017 Revision, Volume I: Comprehensive Tables. ST/ESA/SER.A/399. 19. UNDP. Human Development Report 2016: Human
International Journal of Community Medicine and Public Health | January 2019 | Vol 6 | Issue 1 Page 411 http://hdr.undp.org/sites/default/files/2016_human_d
evelopment_report.pdf. Accessed on 25 July 2018. 20. UNICEF. The State of the World’s Children 2016,
2018. Available at: https://www.unicef.org/ publications/index_101992.html. Accessed on 25, July 2018.