Pak. J. Anal. Environ. Chem. Vol. 17, No. 2 (2016) 118 – 123
http://doi.org/10.21743/pjaec.v17i2.260
Development of Indirect Spectrophotometric Method for
Quantification of Cephalexin in Pure Form and Commercial
Formulation Using Complexation Reaction
Muhammad Naeem Khan*, Sundus Kalsoom, Rahana Hussain,
Zarbad Shah and Muhammad Saadiq
Department of Chemistry, Bacha Khan University, Charsadda, KPK, Pakistan.
*Corresponding Author Email: [email protected]
Received 21 May 2016, Revised 23 September 2016, Accepted 25 September 2016
---Abstract
A simple, accurate and indirect spectrophotometric method was developed for the quantification of cephalexin in pure form and pharmaceutical products using complexation reaction. The developed method is based on the oxidation of the cephalexin with Fe3+ in acidic medium. Then 1, 10-phenanthroline reacts with Fe2+ and a red colored complex was formed. The absorbance of the complex was measured at 510 nm by spectrophotometer. Different experimental parameters affecting the complexation reactions were studied and optimized. Beer’s law was obeyed in the concentration range 0.4 -10 µgmL-1with a good correlation of 0.992. The limit of detection and limit of quantification were found to be 0.065 µgmL-1and 0.218 µgmL-1, respectively. The method have good reproducibility with a relative standard deviation of 6.26 % (n = 6). The method was successfully applied for the determination of cephalexin in bulk powder and commercial formulation. Percent recoveries were found to range from 95.47 to 103.87 % for the pure form and 98.62 to 103.35 % for commercial formulations.
Keywords:Cephalexin, Spectrophotometry, Pharmaceutical formulations, 1, 10-Phenonthroline.
---Introduction
Cephalexin (7-[(aminophenyl acetyl) amino]-3-methyl-8-oxo-5-thia-l-azabicyclo [4.2.0] oct-2-ene-2-carboxylic acid) is a semisynthetic β-lactam
antibiotic, which belongs to the group of
cephalosporin antibiotics. Cephalexin is a first-generation cephalosporin antibacterial used for the handling of vulnerable infections including those of respiratory tract, urinary tract and skin [1]. Cephalexin is an active broad spectrum antibiotic that targets both Gram positive and Gram negative
bacteria [2]. Cephalexin is an effective
cephalosporin and shows a broad spectrum of antibiotic activity, weak bond capability to blood protein, no metabolites, and low toxicity and to be quickly absorbed following oral administration to
give a high serum levels and urine
concentration. Therefore, the cephalexin is widely
used for clinical chemotherapy [3,4]. The extensive
use of cephalexin make a clinical and
pharmacological study needs a simple, fast and sensitive analytical method to determine the drug
in commercial formulations and biological
samples.
A number of methods have been described
in the literature for the determination of
cephalexin. These include chromatographic
methods [5-9], fluorometry [10-12], flow injection analysis [13,14], atomic absorption [15] and
electroanalytical methods [16]. Limited
2-naphthoquinone-4-sulfonate (NQS) and measured the absorbance at 475 nm. The second spectrophotometric method is based on the reaction of cephalexin with ninhydrin reagent giving blue colored chromogen, which was measured at 576 nm. These spectrophotometric methods involve prolonged procedures or have a narrow range of calibration curves. The aim of the present attempt was to develop a simple, accurate,
selective and reproducible method for the
determination of cephalexin in pure form and
pharmaceutical preparations. The developed
method is more sensitive than the published methods and is free from such experimental variables such as heating or extraction step.
Materials and Methods
Instruments
A UV-Visible spectrophotometer SP-1800 (721 G) equipped with 1-cm matched glass
cell was used for absorbance measurement.
A digital analytical balance and a digital
water bath, labacon, model LWB-104 was also used.
Materials and reagents
Analytical or high grade purity reagents were used. FeCl3. 6H2O and H2SO4, 95-97% extra
pure (Riedel-deHaën, Germany) and
1,10-phenanthroline (S.A, Barcelona Spain) were
used. Standard reference cephalexin was
gifted by Saydon Pharmaceutical Industry
(Pvt.) Ltd., Peshawar, Pakistan. Commercial
formulation of cephalexin (Ceporex capsules
250 mg, manufactured by GlaxoSmithKline)
Pakistan was purchased locally. 0.003 molL-1 Fe3+ fresh solution was prepared by dissolving 0.04 g iron chloride hexahydrate in volumetric flask and diluted to 50 mL with distilled water. 0.02 molL-1 1,10-phenanthroline solution was prepared by dissolving 0.198 g of reagent in 5.0 mL of methanol and diluting up to 50 mL with distilled water.
Standard solution
Standard stock solution of cephalexin (100 µgmL-1) was prepared by dissolving 0.005 g of
standard cephalexin in distilled water by heating it for few minutes at 75 oC and after cooling diluted to 50 mL with distilled water. Working standard solutions of the required concentration were freshly prepared by dilution.
Sample Solution
The contents of five capsules of Ceporex containing 250 mg of cephalexin were weighed and mixed. The average mass of the powder in one capsule was calculated. Proper amount of the drug powder equivalent to 0.01 g of cephalexin was dissolved in distilled water by heating it for few minutes at 75 °C, filtered, transferred to a 100 mL volumetric flask and made the volume to the mark with distilled water. A working sample solution of 5 µgmL-1was prepared from stock sample solution by dilution with distilled water.
General procedure
Proper volumes of cephalexin standard stock solution to produce a final concentration of 0.4–10 µgmL-1 were taken in Erlenmeyer flasks. Then 1.0 mL of Fe3+ (0.003 molL-1) solution and 1.0 mL of 1, 10-phenanthroline (0.02 molL-1) was added. The mixture was heated at 100 °C for 20 minutes on water bath and after cooling transferred to volumetric flasks and made the volume up to 10 mL with distilled water. The absorbance was measured at 510 nm on a spectrophotometer against a reagent blank.
Results and Discussion
When varying amount of cephalexin drug are reacted with a known and fixed amount of Fe3+ in acidic medium, proportionate amount of Fe3+ will be used for the oxidation of the drug, and there will a concurrent fall in Fe3+ concentration and a concomitant increase in the concentration of Fe2+. The amount of Fe2+can be determined by using 1,
10-phenanthroline. This property has been
used for the determination of cephalexin in
pharmaceutical preparations. The absorption
linearly dependent on the concentration of cephalexin drug studied, forming the basis for the determination.
0 0.1 0.2 0.3 0.4 0.5 0.6 0.7 0.8
350 400 450 500 550 600 650
A
b
so
rb
a
n
c
e
Wavelength (nm)
Figure 1. Absorption spectra for the colored product
Conditions;10 µgmL-1cephalexin, 1.0 mL of Fe3+(0.003 molL-1),
1.0 mL of 1,10 phenanthroline (0.02 molL-1), heated at 100 °C for
20 min, diluted to 25 mL
Optimization of reaction parameters
Different experimental parameters
affecting the complexation reaction were carefully studied.
Effect of heating temperature and time
The effect of temperature in the range of 60-100 °C and heating time from 5 to 25 minutes was studied. Maximum color product was formed when the reaction mixture was heated for 20 minutes at 100 °C (Fig. 2, 3).
0 0.2 0.4 0.6 0.8 1 1.2 1.4
50 60 70 80 90 100 110
A
b
s
o
rb
a
n
c
e
Temp (oC)
Figure 2. Effect of temperature on absorbance
Conditions;10 µgmL-1cephalexin, 1.0 mL of Fe3+(0.003 molL-1),
1.0 mL of 1,10 phenanthroline (0.02 molL-1), heated at 60-100 °C
for 20 min, diluted to 25 mL
0.6 0.8 1 1.2 1.4 1.6
0 5 10 15 20 25 30
A
b
so
rb
a
n
c
e
Heating Time (min)
Figure 3. Effect of heating time on absorbance
Conditions: 10 µgmL-1cephalexin, 1.0 mL of Fe3+(0.003 molL-1),
1.0 mL of 1,10 phenanthroline (0.02 molL-1), heated at 100 °C for
5-25 min, diluted to 25 mL
Effect of concentration and volume of Fe3+ solution
The effect of concentration of Fe3+ was also studied in the range of 0.001 to 0.005 molL-1. It was observed that maximum color formation was occurred with 0.003 molL-1Fe3+(Fig. 4). The effect of volume of 0.003 molL-1 Fe3+ was also studied and it was found that 1.0 mL was found to produce maximum absorbance.
0.4 0.6 0.8 1 1.2 1.4 1.6
0 0.001 0.002 0.003 0.004 0.005 0.006
A
b
so
rb
a
n
c
e
Concentration of Fe3+(M)
Figure 4. Effect of Fe3+concentration on absorbance
Conditions; 10 µgmL-1cephalexin, 1.0 mL of Fe3+(0.001-0.005 mol
L-1), 1.0 mL of 1, 10 Phenanthroline (0.02 molL-1), heated at 100
°C for 20 min, diluted to 25 mL
Effect of concentration and volume of 1, 10-phenanthrolin solution
0.8 1 1.2 1.4 1.6 1.8 2
0 0.01 0.02 0.03 0.04 0.05 0.06
A
b
so
rp
ti
o
n
Conc. of 1,10-phenonthroline
Figure 5. Effect of concentration of 1, 10-phenonthroline Conditions; 10 µgmL-1cephalexin, 1.0 mL of Fe3+(0.003 molL-1),
1.0 mL of 1,10 phenanthroline (0.006-0.05 molL-1), heated at 100
°C for 20 min, diluted to 25 mL
Stability
The stability of the reaction product was studied by measuring the absorbance after 10
minutes intervals up to 120 minutes. It was
investigated that no change in absorbance of the reaction product was observed. Thus, the reaction product is stable and will not affect the result of analysis even if the absorbance of the reaction product is measured after 2 hours of dilution (Fig. 6).
1.65 1.7 1.75 1.8 1.85 1.9
0 20 40 60 80 100 120 140
A
b
s
o
rb
a
n
c
e
Time (min)
Figure 6. Effect of time on stability of reaction product after
dilution
Conditions; 10 µgmL-1cephalexin, 1.0 mL of Fe3+(0.003 molL-1),
1.0 mL of 1,10 phenanthroline (0.02 molL-1), heated at 100 °C for
20 min, diluted to 25 mL
Effect of interferences
The interferences effect from commonly used excipients in pharmaceutical preparations of
cephalexin was investigated (Fig.7). These
excipients include sucrose, starch and glucose. Under the same experimental conditions, these
excipients were added to a known amount of drug (cephalexin 0.4 µgmL-1), in different concentration in the ratio of 1:1, 1:2, 1:4, 1:6, 1:8 and 1:10. The mixtures containing drug and excipients were analyzed by the proposed method. None of these
common excipients was found to cause
interference.
0 0.04 0.08 0.12 0.16 0.2 0.24
1:00 1:01 1:04 1:02 1:06 1:08 1:10
A
b
so
r
b
a
n
c
e
Drug : Excipient
Sucrose Starch Glucose
Figure 7. Effect of common excipients on determination of
cephalexin by the proposed method
Analytical figures of merit
Under the optimized conditions of the proposed method, Beer’s law was obeyed in the concentration range 0.4-10 µg mL-1 with a good correlation of 0.992 (Fig. 8). The LOD and LOQ values were calculated and found to be 0.0654 µgmL-1 and 0.218 µgmL-1, respectively. The analytical parameters are given in Table 1. The sensitivity of the method is compared with other reported methods (Table 2), which show that sensitivity of the present method is superior to those of previously reported methods.
y = 0.190x + 0.063 R² = 0.992
0 0.5 1 1.5 2 2.5
0 2 4 6 8 10 12
A
b
so
rb
a
n
c
e
Concentration (µg/mL)
Figure 8. Effect of concentration of cephalexin on absorbance Conditions; 0.4 - 10 µgmL-1 cephalexin, 1.0 mL of Fe3+(0.003
molL-1), 1.0 mL of 1,10 Phenanthroline (0.02 molL-1), heated at
Table 1. Analytical parameters for the spectrophotometric determination of cephalexin.
Table 2.Comparison of the present method and other reported
methods for the determination of cephalexin levels.
Methods Linear
range
Limit of Detection (LOD)
References
Spectrofluorimety 0.04–0.4
µgmL-1 ngmL7.76-1 [12]
Atomic absorption spectroscopy
5-50
µgmL-1 µgmL1.66-1 [15]
Spectrophotometry 5–60
µgmL-1 µgmL1.22-1 [18]
Spectrophotometry 1.5–10
µgmL-1 µgmL0.90-1 [19]
HPLC 10-110,
10–120
µgmL-1
2.236, 2.090
µgmL-1
[21]
Spectrophotometry 0.4–10
µgmL-1
0.065
µgmL-1
Present method
Reliability of the method
The precision of the method was checked by evaluating cephalexin in pure form and pharmaceutical preparations at three different concentrations in triplicate within the Beer’s law range. The results are summarized in Table 3 for pure form and Table 4 for dosage form. The percentage recoveries obtained ranged from 95.47 to 103.87% for the pure form and 98.62 to 103.35% for dosage form. The RSD value was found to be satisfactory (RSD≤6.5) showing good reproducibility of the method. Accuracy of the method was calculated by the standard addition method using one brand of capsule (ceporex
containing 250 mg of cephalexin). Specific
concentrations of standard cephalexin solution
were added to commercial formulation and
investigated by the described procedure. Percent recoveries were calculated and ranged from 99.01– 102.13 % (Table 5).
Table 3. Evaluation of accuracy and precision of the proposed
method using solutions of pure cephalexin.
Amount taken (μgmL-1)
Amount found (μgmL-1)
% Recovery ± RSD
Confidence limit
0.4 0.402 100.5 ± 9.98 100.50 ± 0.24%
0.6 0.5728 95.47 ± 12.21 95.47 ± 0.30%
0.8 0.8310 103.87 ± 2.16 103.87 ± 0.05%
Mean = 92.31
± SD = 13.41
t-test = 0.9920 (4.303)
Results are the averages of three separate analyses; RSD = Relative standard deviation
Table 4. Evaluation of accuracy and precision of the proposed
method for cephalexin determination in pharmaceutical preparation.
Pharmaceutical preparations
Amount taken (μgmL-1)
Amount found (μgmL-1)
% Recovery ± RSD
0.4 0.401 100.00 ± 9.98
0.6 0.591 98.62 ± 3.93
Ceporex capsules
250 mg 0.8 0.827 103.35 ± 7.98
Results are the averages of three separate analyses; RSD = Relative standard deviation
Table 5. Evaluation of recovery test of cephalexin in commercial
formulation (capsules) by the proposed method.
Sample Sample (μgmL-1) (
μgmL-1)
added
(μgmL-1)
found
% Recovery ± RSD
0.4 0.81 102.13 ± 7.75
0.6 1.01 101.0±3.59
Ceporex capsules 250 mg
0.4
0.8 1.22 99.01±5.72
Results are the averages of three separate analyses; RSD = Relative standard deviation
Application
The proposed method has been effectively applied for the determination of cephalexin in
commercial formulation. The result of the
proposed method obtained showed close
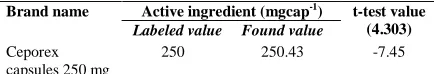
agreement with the label claims without any interference. The results were statistically compared using student’s t-test for accuracy (Table 6).
Table 6. Determination of cephalexin in commercial formulations.
Active ingredient (mgcap-1)
Brand name
Labeled value Found value
t-test value (4.303)
Ceporex capsules 250 mg
250 250.43 -7.45
Results are the averages of three separate analyses; RSD = Relative standard deviation
Parameters Value
λmax(nm) 510
Linear range (µgmL-1) 0.4-10
Limit of detection ( µgmL-1) 0.0654
Limit of quantification ( µgmL-1) 0.218
Regression equation (y) Y=0.190X+ 0.063
Slope (b) 0.190
Intercept (a) 0.063
Correlation coefficient (r2) 0.992
Standard deviation ( µgmL-1) 0.0218
Conclusion
A sensitive, simple and selective
spectrophotometric method was developed for determination of cephalexin in pure form and commercial formulation. Compared with HPLC
and LC/MS methods, the proposed method
is simple and does not need any pretreatment
or lengthy procedure. The developed
method was found to have a wider linear range and can be used as an alternative to HPLC for the determination of cephalexin in industrial and research institution laboratories.
Acknowledgments
The authors extend their appreciation to the Bacha Khan University, Charsadda, KPK, Pakistan for providing the facility to conduct this research.
References
1. S. C. Sweetman, Eds. In The Martindale: The Complete Drug Reference. 35thed. London, UK, Pharmaceutical Press, (2007) 194.
2. L. S. Goodman, A. Gilman and
Antimicrobial agents, in: J. G. Hardnab, L. L. Limbird, and A. G. Gilman, (Eds.), The Pharmacological Basis of Therapeutics,10th ed., McGraw-Hill, New York (2001). 3. T. Nakagawa, J. Haginaka, K. Yamaoka and
T. Uno,J. Antibiotic,31 (1978) 769. http://doi.org/10.7164/antibiotics.31.769 4. P. Campíns-Falcó, A. Sevillano-Cabeza, L.
Gallo-Martínez, F. Bosch-Reig and I. Monzó- Mansanet,Mikrochim. Acta., 126 (1997) 207.
https://doi.org/10.1007/BF01242322 5. M. A. Carroll, E. R. White, Z. Jancsik and J.
E. Zarembo,J. Antibiotic, 30 (1977) 397. http://doi.org/10.7164/antibiotics.30.397 6. M. C. Hsu, Y. S. Lin and H. C. Chung,J.
Chromatog.A, 692 (1995) 67.
http://doi:10.1016/0021-9673(94)00688-6 7. M. C. Hsu, H. C. Chung and Y. S. Lin,J.
Chromatog. A, 727 (1996) 239. http://dx.doi.org/10.1016/0021-9673(95)01119-6
8. S. A. Coran, M. Bambagiotti-Alberti, V. Giannellini, A. Baldi, G. Picchioni and F. Paoli,J. Pharm. Biom. Anal., 18 (1998) 271.
https://doi.org/10.1016/S0731-7085(98)00167-8
9. R. M. Jeswani, P. K. Sinha, K. S. Topagi and M. C. Damle,Int. J. Pharm. Tech. Res., 1 (2009) 527. http://citeseerx.ist.psu.edu/ doi=10.1.1.513.6062&rep=rep1&type=pdf 10. J. L. Fabregas and J. E. Beneyto,Analyst,
105 (1980) 813.
https://doi.org/10.1039/an9800500813 11. F. Plavšić, B. Vrhovac, A. Radoševićand I.
Dvorźak,J. Clin. Chem. Clin. Biochem., 19 (1981) 35.
https://doi.org/10.1515/cclm.1981.19.1.35, 12. R. Dalia El- Wasseef,Spectrosc. Lett., 40
(2007) 797.
https://doi.org/10.1080/00387010701506588 13. U. J. Meyer, Z. L. Zhi, E. Loomans, F.
Spener and M. Meusel,Analyst, 124 (1999) 1605. https://doi.org/10.1039/a907121k 14. Z. L. Zhi, U. J. Meyer, J. W. Van den Bedem
and M. Meusel,Anal. Chim. Acta, 442 (2001) 207. https://doi.org/10.1016/S0003-2670(01)01180-1
15. S. M. AL-Ghannam,J. Food Drug Anal., 16 (2008) 19
http://search.proquest.com/openview/686fa6 8d7f1a1117006c7156d658fdb0/1
16. M. Xu, H. Ma and J. Song,J. Pharm. Biom. Anal., 35 (2004) 1075.
https://doi.org/10.1016/j.jpba.2004.03.018 17. M. Irandoust, M. Shariati-Rad and K. Mina,
IJPSR, 5 (2014) 97.
http://dx.doi.org/10.13040/IJPSR.0975-8232 18. S. A. Patel and N. J. Patel,Int. Res. J.
Pharm., 2 (2011) 145.
http://journals.indexcopernicus.com/abstract. php?icid=982222
19. O. H. Rebwar,Chem. Sci. Trans., 2 (2013) 1110. doi.10.7598/cst2013.449
20. A. H. Rageh, S.R. El-Shaboury, G. A. Saleh, F. A. Mohamed,Nat. Sci., 2 (2010) 828. doi:10.4236/ns.2010.28104