O R I G I N A L A R T I C L E
Open Access
Functional classification of rice flanking
sequence tagged genes using MapMan
terms and global understanding on
metabolic and regulatory pathways
affected by
dxr
mutant having defects in
light response
Anil Kumar Nalini Chandran
1†, Gang-Seob Lee
2†, Yo-Han Yoo
1, Ung-Han Yoon
3, Byung-Ohg Ahn
4, Doh-Won Yun
5,
Jin-Hyun Kim
6, Hong-Kyu Choi
6, GynHeung An
1*, Tae-Ho Kim
3*and Ki-Hong Jung
1*Abstract
Background:Rice is one of the most important food crops for humans. To improve the agronomical traits of rice, the functions of more than 1,000 rice genes have been recently characterized and summarized. The
completed, map-based sequence of the rice genome has significantly accelerated the functional characterization of rice genes, but progress remains limited in assigning functions to all predicted non-transposable element (non-TE) genes, estimated to number 37,000–41,000.
Results:The International Rice Functional Genomics Consortium (IRFGC) has generated a huge number of gene-indexed mutants by using mutagens such as T-DNA, Tos17 and Ds/dSpm. These mutants have been identified by 246,566 flanking sequence tags (FSTs) and cover 65 % (25,275 of 38,869) of the non-TE genes in rice, while the mutation ratio of TE genes is 25.7 %. In addition, almost 80 % of highly expressed non-TE genes have insertion mutations, indicating that highly expressed genes in rice chromosomes are more likely to have mutations by mutagens such as T-DNA,Ds,dSpmandTos17. The functions of around 2.5 % of rice genes have been characterized, and studies have mainly focused on transcriptional and post-transcriptional regulation. Slow progress in characterizing the function of rice genes is mainly due to a lack of clues to guide functional studies or functional redundancy. These limitations can be partially solved by a well-categorized functional classification of FST genes. To create this classification, we used the diverse overviews installed in the MapMan toolkit. Gene Ontology (GO) assignment to FST genes supplemented the limitation of MapMan overviews.
(Continued on next page)
* Correspondence:[email protected];[email protected];[email protected]
†Equal contributors
1Graduate School of Biotechnology & Crop Biotech Institute, Kyung Hee University, Yongin 446-701, Republic of Korea
3
Genomics Division, National Academy of Agricultural Science, RDA, Jeonju 560-500, Republic of Korea
Full list of author information is available at the end of the article
(Continued from previous page)
Conclusion:The functions of 863 of 1,022 known genes can be evaluated by current FST lines, indicating that FST genes are useful resources for functional genomic studies. We assigned 16,169 out of 29,624 FST genes to 34 MapMan classes, including major three categories such as DNA, RNA and protein. To demonstrate the MapMan application on FST genes, transcriptome analysis was done from a rice mutant of 1-deoxy-D-xylulose 5-phosphate reductoisomerase (DXR)gene with FST. Mapping of 756 down-regulated genes indxrmutants and their annotation in terms of various MapMan overviews revealed candidate genes downstream ofDXR-mediating light signaling pathway in diverse functional classes such as the methyl-D-erythritol 4-phosphatepathway (MEP) pathway overview, photosynthesis, secondary metabolism and regulatory overview. This report provides a useful guide for systematic phenomics and further applications to enhance the key agronomic traits of rice.
Keywords:DXR, Gene-indexed mutant, Functional genomics, MapMan analysis, Rice
Background
Rice (Oryza sativa) is one of the most important crops worldwide, as both a staple food and a model system for genomic research. The complete genome sequence is a basic resource to elucidate individual gene functions and initiate comparative genomics among crop species. As a monocot model, high-throughput omics data are available for rice at multiple levels including microarray and RNA-seq, proteomic data, protein-protein interactions, reac-tome, and genome-wide gene-indexed mutant collections (Chandran and Jung 2014). These data are helpful for precisely estimating detailed gene functions. The func-tions of more than 1,000 rice genes have been elucidated by genetic analysis with natural and gene-indexed mu-tants or transgenic approaches (Yamamoto et al. 2012). These genes constitute about 2.5 % of the predicted loci in the Rice Annotation Project Database (RAP-DB) (Ta-naka et al. 2008), indicating that the functions of most rice genes have yet to be elucidated. Progress in rice functional genomics requires high-throughput omics data from multiple levels. The gene-indexed mutant population is a key resource for functional genomics and the International Rice Functional Genomics Con-sortium (IRFGC) has generated gene-indexed mutants that are available to study the functions of around 30,000 genes.
Two main obstacles are expected to limit the progress of current functional genomic analyses with gene-indexed mutants. One obstacle is gene redundancy aris-ing from large segmental gene duplications and tandem duplications (Yu et al. 2005). The redundancy is partial or uneven, depending on the similarities in expression of duplicated genes (Briggs et al. 2006). The other obstacle is the limited information available to study gene func-tion. MapMan is a useful tool to provide global views of diverse aspects of high-throughput data and can be used to functionally classify rice genes with flanking sequence tag (FST) mutants for systematic functional studies (Thimm et al. 2004; Usadel et al. 2009; Jung and An 2012).
In this report, we tried to systematically assign func-tions to all predicted rice genes with FSTs. For this pur-pose, a total of 246,566 FSTs from various mutant resources worldwide along with new FSTs we identified with Ds insertions were collected and mapped to the rice genome (Chandran and Jung 2014). We analyzed the expression patterns of FST genes using Agrobacter-ium infected callus samples at different time points. Next, functional assignment was done for 29,624 rice FST genes based on functional classification information from the MapMan Toolkit. This information can be used for systematic functional studies on selected meta-bolic pathways or functional modules. As a case study of metabolic pathways or functional modules assessment using MapMan tool, we carried out transcriptome profiling of rice mutant leaves in 1-deoxy-D-xylulose 5-phosphate reductoisomerase (DXR) gene compared to its wild type control. Estimation and further annotating of these down regulated genes indxrmutant using MapMan classification informs diverse routes for the regulation or metabolism of the light response pathway and associated genes. Use of additional FSTs will clarify the functionality of the routes associated withDXR. Gene Ontology (GO) assignment on FSTs partially supplements the limitation of MapMan annotation.
Results and discussion
Current state of rice gene-indexed mutants by transpo-sons and T-DNA insertions
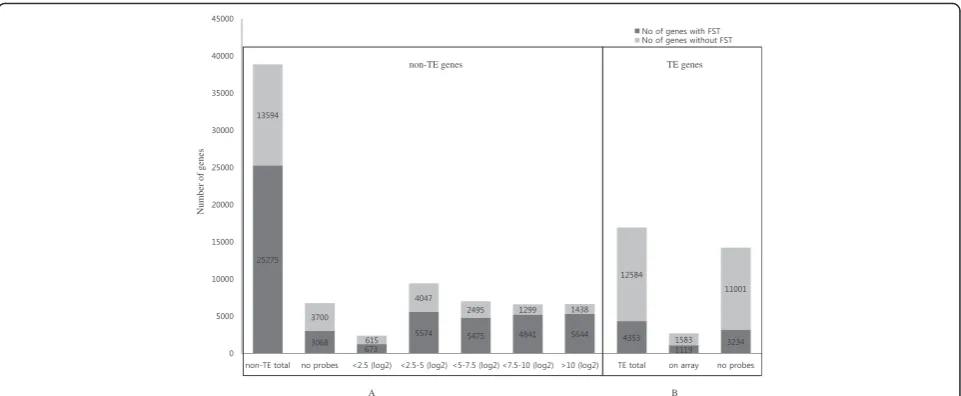
have been identified and mapped to the rice genome. In addition, we added the information on the identification and analysis of 29,624 FSTs with Ds insertions in Additional file 1: Table S1. Thus, 246,566 FSTs were analyzed in this study (Table 1). These FSTs indicate mutations in 29,624 (53.1 %) of 55,801 genes identified by the rice genome annotation project (RGAP) annotation version 7 (Fig. 1). We defined rice genes with FSTs as“rice FST genes.” The list of FST genes with related gene-indexed mutants is provided in Additional file 1: Table S1. A total of 16,937 loci had a transposable element (TE) based on RGAP annotation version 7, and we found that 4,353 of these TE genes were tagged by mutagen inser-tions, such as T-DNA, Ds, dSpm and Tos17. Therefore, the mutation ratio was 25.7 % (Fig. 1) for TE genes. In contrast, 25,275 of the 38,869 non-TE genes (65 %) were tagged by mutagen insertions (Fig. 1). Previous studies in-dicated that mutagens such as T-DNA and transposons preferentially integrates into the transcriptionally active regions (Kim and Veena 2007). Thus, the lower propor-tion of inserpropor-tion mutants for the TE genes suggests that a significant portion of TEs might not be actively expressed.
Integration of T-DNA or transposons in transcriptional active regions is evident from expression level of Agrobacterium infected calli samples
Agrobacterium mediated transformation is traditional method for transient and stable genetic transformation because of several advantages (Hiei et al. 1994). Time
series microarray experiment on Agrobacterium infected rice calli revealed high transformation efficiency of ja-ponica cultivars compared to that of indica (Tie et al. 2012). Transcriptome data generated by Tie et al. (2012) under the infection of rice calli using a super-virulent Agrobacterium tumefaciens strainEHA 105that contain-ing a binary vector pCAMBIA1301 with hygromycin-re-sistance gene (hpt) and the intron-gus in the T-DNA region provided a good source for analysis of T-DNA in-sertion behavior in the rice genome. Hence, we adopted the Tie et al. (2012) dataset for our investigation. We first analyzed the distribution of non-TE genes according to their expression levels in calli, corresponding to the co-cultivation stage of Agrobacterium tumefaciens-mediated transformation process from rice Affymetrix microarray data (Tie et al. 2012). For the co-cultivation, pre cultivated embryogenic calli of a specified size were infected with suspension of Agrobacterium with an optical density (OD) of 0.35–0.4 at 600 nm for 30 min (Tie et al. 2012). The distribution data of non-TE genes based on calli expres-sion levels are summarized in Fig. 1. The Affymetrix array has probes for 32,101 of 38,869 non-TE genes, which ex-cludes chloroplast, mitochondria and unmapped genes from the total TE genes, and 22,207 of 25,275 non-TE genes with FSTs were analyzed (Fig. 1). Of the latter, there are 1,288 genes with less than 2.5 average log2
inten-sity of which 52.25 % (673 genes) have gene-indexed mu-tants, 9,621 genes with average log2intensity from 2.5 to 5
of which 58 % (5,574 genes) have gene-indexed mutants, 7,970 genes with average log2 intensity from 5 to 7.5 of
which 68.7 % (5,475 genes) have gene-indexed mutants, 6,140 with average log2intensity from 7.5 to 10 of which
78.84 % (4,841 genes) have gene-indexed mutants, and 7,082 with more than 10 average log2intensity of which
79.7 % (5,644 genes) have gene-indexed mutants (Fig. 1). In addition, 3,068 (45.3 %) of the 6,768 non-TE genes not on the rice Affymetrix array had gene-indexed mutants (Fig. 1). This ratio is even lower than that of the least expressed non-TE genes (i.e., less than 2.5 average log2
in-tensity), indicating that non-TE rice genes not printed on the rice Affymetrix gene chip are generally expressed at very low levels. On the other hand, almost 80 % of highly expressed non-TE genes had insertion mutations. Our re-sults confirm that the more highly expressed genes in rice calli at co-cultivation stage are more likely to have muta-tions inserted by T-DNA, Ds, dSpm or Tos17(Kim and Veena 2007).
Transformation process involving T-DNA integration to the genome is a complex process and differs signifi-cantly depending on factors such as genotypes, tissue be-ing inoculated, vector and bacterial strains, marker genes and other related culture conditions (Tie et al. 2012). Plant genes facilitate the specific transformation steps including bacterial attachment, T-DNA transfer Table 1Summary of FST genes in rice according to the
individual institute in the International Rice Functional Genomics Consortium (IRFGC)
Institute No. of
FSTs
No. of mapped FSTs
No. of FSTs with insertion in genic region (55,986a)
No. of genes with FSTs in genic region
DJ-Ds-seq 32,459 32,009 22,002 6,841
Indica-Ds-seq 2,499 2,464 1,539 641
Affjp-Tos17 18,024 17,939 14,554 3,602
Cirad-T-DNA 29,262 27,870 17,709 5,629
csiro-Ds 611 585 398 286
Gsnu-Ds 1,072 1,050 732 484
Ostid-Ds 1,315 1,290 814 672
PFG_FSTs-T-DNA 107,171 105,739 59,707 20,889
rifgp-T-DNA 741 689 359 156
rmd-T-DNA 33,197 31,892 16,219 6,641
ship-T-DNA 12,614 9,385 4,808 1,340
trim-T-DNA 11,799 11,135 6,029 3,711
Ucd-Ds/Dspm 17,730 16,825 7,556 3,088
Total 268,496 258,872 152,426 29,664
a
and cytoplasmic trafficking and integration via nuclear targeting (Citovsky et al. 2007). Differentially expressed genes (DEGs) catalog of Agrobacterium mediated trans-formation calli to their corresponding non-treated sam-ples is helpful to identify candidate genes responsible for T-DNA or transposons integration into genome based on expression level. So, we analyzed DEGs of Agrobac-terium infected embryogenic calli of japonica cultivar Nipponbare and indica cultivar Zhenshan 97 at various time points post infection compared to uninfected calli (Tie et al. 2012). Subsequently, 4391, 4633, 3774 and 3606 probes showed differential expression with log2 fold changes > 2 andp-values <0.05 at 1 h, 6 h, 12 h and 24 h after infection, respectively for Nipponbare callus. Excluding multiple probes for single gene and un-mapped probes to rice genome, 3095, 3613, 2926 and 2774 unique DEGs were identified for Nipponbare callus. Similarly, 4220, 3906, 3013 and 2733 DEGs were identified for Zhenshan 97 cultivar. List of DEGs and re-lated details is presented in Additional file 2: Table S2.
Current understanding of diverse metabolic and regulatory pathways using 1,022 rice genes with known functions
Based on information from the Overview of Functionally Characterized Genes in Rice online database (OGRO, http://qtaro.abr.affrc.go.jp/ogro/table) (Yamamoto et al. 2012), we retrieved 1,022 functionally characterized RGAP loci and mapped them to MapMan overviews (Additional file 3: Figure S1). After mapping, 1,014 genes were assigned to different MapMan terms (bins), with some candidates assigned to more than one term, result-ing in 1,069 mappresult-ings (Additional file 4: Table S3). Of them, 863 genes have FSTs.
In terms of overviews, 163 genes were mapped to the metabolism overview, 455 genes to the regulation over-view, 125 genes to the cellular response overover-view, and 44 genes were classified under large enzyme families (Additional file 3: Figure S1). The remaining mapped genes were assigned to other type of functional categories (Additional file 4: Table S3). The main subclasses of metabolism-related genes are associated with photosyn-thetic components and carbohydrate metabolism, cell wall metabolism, lipid metabolism, N-metabolism, amino acid metabolism, nucleotide metabolism and secondary metab-olism. Among 455 genes in the regulation overview, 222 genes were assigned a role in transcription regulation. Others were related to post-transcriptional regulation, in-cluding 53 genes in protein post-translational modification, 41 genes in protein degradation, 59 genes in hormone me-tabolism and 64 genes assigned to various signaling events. The distribution of the characterized genes in different MapMan functional categories is provided in Additional file 3: Figure S1. In total, the functions of around 2.6 % (1,022) of non-TE rice genes (38,869) have been character-ized. Functional redundancy by gene duplication and com-pensating metabolic pathways as well as soma-clonal variations that occurred during Agrobacterium-mediated transformation might explain why such a small portion of rice genes were functionally characterized with gene-indexed mutants. In addition, not enough bio-logical information is available to further functionally characterize individual genes.
Identification of FST genes with unknown function using MapMan analysis
We classified all RGAP-annotated loci using MapMan terms and determined the relative proportion of FST
non-TE genes TE genes
Number of genes
A B
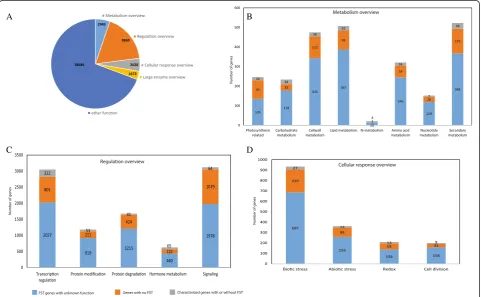
genes, non-FST genes and characterized genes (Fig. 2). Out of 55,801 RGAP-annotated genes, 9,869 genes fell under the regulation overview, 2,945 genes were assigned to the metabolic overview, 2,628 genes were under the cellular response overview, 1,673 genes were classified as large enzyme families and the remaining 38,686 fell either in a different MapMan overview or did not have assigned MapMan terms (Fig. 2a). In the metab-olism overview, 523 genes were assigned to a secondary metabolism-related function, including 30 characterized genes, 125 non-FST genes and 368 FST genes with no functional data. Including genes with multiple functional assignment, a higher proportion of genes were assigned to lipid metabolism (507 genes) and cell wall metabolism (475 genes) (Fig. 2b). Only 21 genes were assigned to N-metabolism-related functions, and the remaining assign-ments were amino acid metabolism (321 genes), nucleo-tide metabolism (152 genes), carbohydrate metabolism (234 genes) and photosynthesis-related events (246 genes). Among genes under the metabolism overview, 76.9 % can be analyzed using FST lines. From the regulation over-view, we identified 3,121 signaling, 3,050 transcription, 1,680 protein degradation, 1,172 protein modification and 627 hormone metabolism genes (Fig. 2c). Transcription (222/3050) and hormone metabolism (65/627) are more
studied than others, indicating that these are major targets for regulation processes. However, 95.3 % of regulation overview genes should receive more attention through further studies, and FST lines can be utilized for 71.4 %. The majority of cellular response overview genes were at-tributed to biotic stress (934 genes), abiotic stress function (361), redox (209) and cell division (200) (Fig. 2d). Among these, biotic and abiotic stress are more studied than others. However, functions for 95.3 % of genes in this cat-egory should be characterized through further studies, and FST lines might be useful for 75.2 % of them.
Functional classification of FST genes using MapMan analysis
The current understanding of the diverse metabolic and regulatory pathways with functionally characterized genes remains quite limited as shown in Additional file 3: Figure S1. Rice genes with FSTs are very useful resources for global functional genetic studies. Missing gaps in me-tabolism, transcription, protein modification, protein degradation, signaling and hormone pathways might be unlocked by functional genomic studies using FST mu-tants covering 65 % of non-TE genes. To systematically as-sign functions to 29,624 rice FST genes, we used the diverse overview tools installed in MapMan.
A B
C D
MapMan terms were assigned for 16,169 genes; no functional assignment was done for the other 13,455 genes due to a lack of matching MapMan terms. The in-formation for all genes mapped to different overviews and the relationship to FST lines is presented in Additional file 5: Table S4. This summarized information offers a useful source of categorized candidate genes for systematic func-tional analyses of common metabolic/biochemical path-ways or regulatory pathpath-ways, whereas genomic annotation in RAP-DB or MSU RGAP projects do not provide sys-tematic information associated with putative function assigned to a gene. If we can use all mutants with FST genes assigned to a pathway, we might quickly expand our understanding on the pathways.
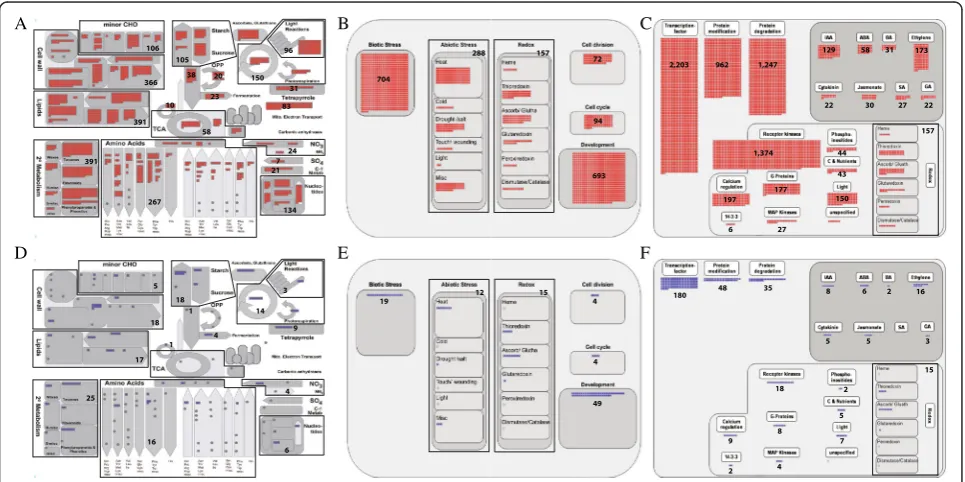
Among the classified genes, 2,228 FST genes were mapped to the metabolism overview, which consists of 2,927 genes; 7,104 to the regulation overview, which con-sists of 9,959 genes; 1,990 to the cellular response over-view, which consists of 2,643 genes; and 1,242 to the large enzyme families overview, which consists of 1,679 genes (Fig. 3; Additional file 5: Table S4). More than 70 % of these overviews can be analyzed by using FST genes.
Metabolism related genes are further divided as: 366 genes for cell wall metabolism, 391 for lipid metabolism, 391 for secondary metabolism, 267 for amino acid metabolism, 96 for light metabolism, 105 for major carbohydrate metabolism, 106 for minor carbohydrate metabolism, 150 for photosystems, 38 for glycolysis, 23
for fermentation, 10 for gluconeogenesis, 20 for oxida-tive phosphorylation, 58 for the tricarboxylic acid (TCA) cycle, 7 for S-assimilation, 134 for nucleotide metabolism, 21 for C1-metabolism, 16 for polyamine metabolism, 55 for co-factor and vitamin metabolism, 31 for tetrapyrrole synthesis, 83 for mitochondrial electron transport, 24 for N-metabolism, 48 for metal handling, and 53 for biodeg-radation of xenobiotics (Fig. 3; Additional file 5: Table S4).
Cellular response overview classified 704 genes for bi-otic stress, 288 for abibi-otic stress, 157 for redox, 693 for de-velopment, 72 for cell division, and 94 for the cell cycle (Fig. 3; Additional file 5: Table S4).
In the regulation overview, we identified 2,203 TFs, 962 genes for protein modification, 1,247 for protein degradation, 493 for hormone metabolism, and 2,038 signaling-related genes (Fig. 3; Additional file 5: Table S4). Hormone metabolism was further classified as 129 genes associated with IAA, 58 with abscisic acid (ABA), 173 with ethylene, 31 with brassinosteroid (BR), 22 with cytokinin, 30 with jasmonate (JA), 27 with salicylic acid (SA), and 22 with gibberelin (GA) (Fig. 3; Additional file 5: Table S4). The signaling-related genes were further classi-fied as 1,374 genes associated with receptor kinases, 197 with calcium regulation, 177 with G-regulation, 6 with 14-3-3 protein, 27 with MAP kinases, 150 with light regula-tion, 43 with sugar and nutrient physiology, 44 with phosphoinositides, and 157 with redox-related genes (Fig. 3; Additional file 5: Table S4).
A B C
D E F
Regulation pathways are coupled with transcriptional regulation; protein modification, including phosphoryl-ation; and protein degradation. We provided detailed in-formation on FST genes for transcriptional regulation using the transcription overview. Transcription overview consists of transcription factors and epigenetic regulation factors. For the transcription factors, family distribution of FST genes are: 270 MYB TFs, 116 basic helix-loop-helix (bHLH) TFs, 86 APETALA2/ethylene-responsive element binding protein (AP2/EREBP) TFs, 78 C2H2 TFs, 29 C2C2-CONSTANS-like TFs, 22 C2C2-GATA TFs, 19 C2C2-Dof TFs, 17 C3H TFs, 8 C2C2-YABBY TFs, 81 WRKY TFs, 84 homeobox TFs, 84 bZIP TFs, 54 MADS TFs, 35 NAC TFs, 40 G2-like/GARP TFs, 17 Arabidopsis response regulator (ARR) TFs, 4 pseudo-ARR TFs, 21 GRAS TFs, 28 auxin response factor (ARF) TFs, 19 Aux/ IAA TFs, 24 CCAAT TFs, 22 heat-shock transcription fac-tors (HSFs), 16 asymmetric leaves 2 (AS2), 10 TCP TFs, 10 B3 TFs, 10 alfin-like TFs, 10 zf-HD TFs, 10 AtSR TFs, 9 CPP1-related TFs, 7 ABI3/VP1-related B3-domain TFs, 6 Zn-finger (CCHC) TFs, 7 bromodomain TFs, 7 orphan TFs, 7 E2F/DP TFs, 6 forkhead-associated domain (FHA) TFs, 4 EIN3-like TFs, 4 GeBP like TFs, 2 AT-rich inter-action domain TFs, and 2 early flowering 3 (ELF3) TFs. We also identified FST genes related to epigenetic regula-tion factors such as argonaute, chromatin remodeling fac-tors, DNA methyltransferases, histone acetyltransferases, histone deacetylases, JUMONJIs, methyl binding domain
proteins, nucleosome/chromatin assembly factor groups, PHD finger TFs, polycomb groups, PWWP domain proteins, SET-domain TFs, silencing groups, SNF7, and triple-helix (Trihelix) TFs (Fig. 4; Additional file 5: Table S4).
For protein modification including phosphorylation, we used the receptor-like kinase (RLK) overview and identified FST genes for 382 DUF26 RLKs, 313 LRR kinases, 243 S-locus RLKs, 31 legume lectin RLK, 15 PERK-like, 3 LRK10-like, 1 Crinkly-like, and 319 receptor-like cytoplasmic kinases (Fig. 4). LRR kinases were further classified as 186 genes associated with LRR kinase XI, 56 with LRR kinase III, 44 with LRR kinase XII, 22 with LRR kinase VIII, 4 with LRR kinase X, an LRR kinase with LRR II, and an LRR kinase with LRR VI. In general, RLKs are surface localized and transmem-brane proteins consisting of an amino-terminal extracel-lular domains and carboxyl-terminal intracelextracel-lular kinase domains (Shiu and Bleecker 2001).
For protein degradation, we used the ubiquitin and au-tophagy dependent degradation overview and identified 34 ubiquitins, 8 E1 ligases, 35 E2 ligases, 539 E3 ligases, 36 ubiquitin proteases, 46 proteasome complex mem-bers, and 16 autophagy-related genes (Fig. 4). The E3 ligases were further divided into 306 genes with Ring/U-box; 152 with Skp, Cullin, and F-box containing (SCF) complex; 73 with bric a brac, tramtrack, and broad com-plex/DDB1- CUL4-X-box/anaphase promoting complex
A B C
D E F
(BTB/DCX/APC); and 7 with homologous to the E6AP carboxyl terminus (HECT).
Gene ontology assignment for FST genes
To provide putative function for some of 13,455 FST genes which have no MapMan terms and additional in-formation of FST genes, we assigned gene ontology (GO) terms to the rice FST genes using CARMO re-source (http://bioinfo.sibs.ac.cn/carmo/) (Wang et al. 2015) in terms of biological process, molecular function and cellular components. GO analysis revealed 685 Bio-logical process (BP) terms for 21,123 FST genes exclud-ing multiple GO term assignment. Among the BP, metabolic process (GO:0008152) is highly enriched term and other prominent GO terms were cellular process (GO:0009987), biosynthetic process (GO:0009058) and response to stress (GO:0006950). Similarly, GO assign-ment revealed 368 Molecular function (MF) terms for 20,383 FST genes including binding activity related enriched terms like protein binding (GO:0005515), nu-cleotide binding (GO:0000166) and catalytic activity (GO:0003824). 19,399 unique FST genes were assigned to 135 GO terms in the Cellular component (CC) and the term membrane (GO:0016020) is the most overrepre-sented in CC. Other enriched terms include plastid (GO:0009536), nucleus (GO:0005634), plasma membrane (GO:0005886), cytoplasmic membrane-bounded vesicle (GO:0016023) and mitochondrion (GO:0005739). All FST GO term detailed information is summarized in Additional file 6: Table S5.
Application of a rice FST gene to functional genomics study
In many cases, expression patterns of FST genes are use-ful indicators for further functional studies based on the analysis for known genes. Mutants with confirmed phe-notypes offer potentially valuable resources to expand the current knowledge and suggest new hypotheses re-lated to molecular mechanisms. Previously, we identified a number of mutants showing defects in light responses (Jung et al. 2008). Among them,DXRplays roles in the methyl-D-erythritol 4-phosphate pathway (MEP) and its mutation causes chlorine phenotypes, indicating its sig-nificance for light response in rice. In Arabidopsis, dxr
mutants are albinos with dwarf phenotype, and those mutants were abnormal in stomata closure in leaves, have less trichrome and are unbolted. It was also re-vealed in the study that disruption in the MEP pathway leads to deficiency in the biosynthesis of photosynthetic pigments and phytohormones GAs and ABA (Xing et al. 2010). Here, we analyzed and proposed possible regula-tory pathway for dxr dependent light response by inte-grating the transcriptome analysis and MapMan overview. Even in the absence of an in depth functional
validation of the mutant, the transcriptome based Map-Man analysis helps us to rapidly identify the potential candidate genes and pathways associated withDXR.
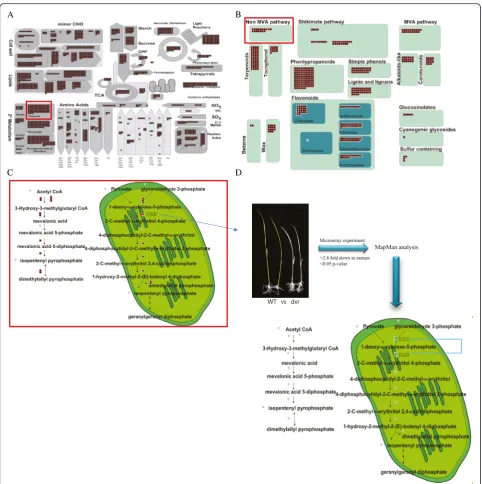
To do this, we first used MapMan metabolic overview analysis and identified thatDXRgene belongs to terpene class of secondary metabolism. More detailed analysis for secondary metabolism indicates that DXR functions in the second step of MEP pathway to produce the iso-pentenyl pyrophosphate (IPP) (Fig. 5a-c). Towards the identification of impaired downstream pathway and ele-ments, we carried out microarray experiments to compare this mutant and wild type controls using the Agilent 8X60K microarray. As a result, we found 756 genes showing at least 2.8 fold down-regulation in dxr
mutants (Additional file 7: Table S6). MEP pathway overview analysis using these downregulated candidate genes in the MapMan tool revealed that twoDXS genes in the first step of MEP pathway were down-regulated in thedxrmutant, indicating that first step pathway by the block of 2nd step pathway was feedback inhibited and both steps are critical for the production of the final product in the pathway (Fig. 5d). More interestingly, genes from photosynthesis pathways associated with light responses, such as the photosystems I and II, calvin cycle, and photorespiration pathways, were downregu-lated in dxr mutant. Secondary metabolisms were also significantly affected by the dxr mutant. Regulation overview suggests downstream regulator elements for
DXR-mediating light response in the class of transcrip-tion factors, protein modificatranscrip-tion and protein degrad-ation (Additional file 7: Table S6; Additional file 8: Figure S2). In addition, ethylene, auxin and jasmonic acid hormones were more related to DXR-mediating light response, suggesting candidate genes involved in the DXR-mediating cross-talk between light response and hormone regulation. These genes are good targets for further analysis, representing novel regulatory candi-date genes for light response. Interestingly, analysis of MEP pathway usingdxrmutant in Arabidopsis revealed that exogenous application of GA and ABA rescued the
dxr mutant phenotypes (Xing et al. 2010). The use of FST gene (DXR), relating gene indexed mutant (dxr), and genome-wide transcriptome analysis combined with MapMan tool will be an effective approach to quickly expand current understanding on the molecular and genetic function of FST gene which are well categorized.
Conclusion and prospects
characterization is still limited due to functional redun-dancy or a lack of guiding information for gene function. The functions of 863 of 1,022 known genes can be eval-uated by current FST lines which are useful resources for functional genomic studies. We assigned 16,169 out of 29,624 FST genes to 34 MapMan classes which pro-vide visual diagrams of diverse metabolic and regulatory
pathway. In addition, missing information not covered by MapMan terms is provided by assigning GO terms in the biological process and molecular function categories. Development of new technology and quick accumulation of high-throughput data such as whole genome rese-quencing, microarray, and RNA-seq data might provide more options for functional studies of genes of interest
A B
C D
Fig 5Strategy for the application of FST genes: A case study using FST mutant forDXRgene and transcriptome data.aMetabolism overview associated with FST genes (brown boxes) includingDXRgene (red box).bSecondary metabolism overview associated with FST genes including
DXRgene.cMEP pathway overview associated with FST genes includingDXRgene.dExperimental procedure to identify downstream metabolic pathway and regulatory elements ofDXRthrough microarray comparison ofdxrmutant vs wild type. As a result, 756 downregulated genes in the
or for improving agronomic traits. Integrating analysis tools of metabolic pathways and transcriptome data can help select key elements in a pathway. We applied tran-scriptome analysis result in the MapMan context to re-veal the possible regulatory elements and pathways associated with dxr mutant. Microarray analysis of dxr
mutant followed by MapMan assignment of pathways suggested a feedback inhibition mode of regulation in the MEP pathway, which still requires conformation by functional studies. In addition, mutation of DXR re-pressed photosynthesis and pathways of light reaction and diverse secondary metabolites. The use of gene-indexed mutants might enable us to carry out a system-atic analysis of selected downstream pathways, accelerat-ing the understandaccelerat-ing of mechanisms and providaccelerat-ing us with better options for application of the results. The Kyoto Encyclopedia of Genes and Genomes (KEGG) and RiceCyc databases (http://pathway.gramene.org/gramene/ ricecyc.shtml) also provide a catalog of known or pre-dicted rice biochemical pathways (Dharmawardhana et al. 2013; Sakurai et al. 2011).
Methods
Distribution analysis of FST genes using microarray data of callus samples during tissue culture and identification of DEGs
We downloaded Affymetrix microarray series GSE32426 consisting of rice embryogenic calli before and after Agrobacterium infection from NCBI GEO (http:// www.ncbi.nlm.nih.gov/geo/) (Tie et al. 2012). The data-set includes expression profiles from callus right before Agrobacterium infection; 1, 6, 12 and 24 h of callus in-fection. The raw signal intensity (CEL file) values were first normalized with MAS5.0 method usingaffypackage in R language (Gautier et al. 2004) and probes were mapped to Locus ids of RGAP. For genes with multiple probes, those with a high average expression level were considered. Genes with at least 2 fold change and
p-value <0.05 was considered as differentially expressed. K-means and KMC clustering from MeV software (http://www.tm4.org/mev.html) was used to analyze the microarray data.
Collection of flanking sequence tags and mapping flanking sequence tags to the rice genome
We downloaded all flanking sequence tag (FST) data from POSTECH-RISD (Jeon et al. 2000), UCD (Kumar et al. 2005), GSNU (Kim et al. 2004), CIRAD (http://ory zatagline.cirad.fr/), TRIM (http://trim.sinica.edu.tw/), NIAS (https://tos.nias.affrc.go.jp/), RMD (http://rmd.ncpgr.cn/), SHIP T-DNA (http://ship.plantsignal.cn/home.do), CSIRO (http://www.csiro.au/pi), EU-OSTID (http://orygenesdb.cir ad.fr/) and ZJU-T-DNA (http://www.genomics.zju.edu.cn/ ricetdna.html), and then used the BLAST program to map
FSTs to the rice genome annotation version 7.0 from the RGSP website (http://rice.plantbiology.msu.edu/). FSTs with more than a 100-bp match with aligned genes were assigned to a corresponding RGAP locus ID when the FST had more than 95 % identity with the genomic DNA. For FSTs with less than a 100-bp match, we assigned the RGAP locus ID when the identity was more than 99 %. The results are summarized in Additional file1: Table S1.
MapMan analysis
To identify metabolic pathways and regulation processes associated with FST genes in rice, we used metabolic_ov-erview and regulation_ovmetabolic_ov-erview installed in the MapMan tool (Thimm et al. 2004). MapMan provides the map-ping files for the rice (Degenkolbe et al. 2009; Howell et al. 2009), which can be retrieved locally on installation of the software. The use of MapMan for high through-put data in rice was described in our recent study (Jung and An 2012). Related mapping files for rice genes are available from MapMan software website (http://map man.gabipd.org/web/guest/mapmanstore). For classifying FST genes, the RGAP gene model of 29,624 rice FST genes was uploaded to the MapMan tool and 16,169 rice FST genes were mapped to MapMan terms. The remaining genes were not assigned to MapMan terms due to unknown function. To indicate downregulated gene pathways in thedxrmutant, genes were assigned a negative number and shown in green color. To check the feature of FST genes with a known function, we also used MapMan overviews as we analyzed all FST genes (Additional file 5: Table S4). FST and non-FST genes were distinguished using different color codes. In total, 1,022 functionally characterized RGAP loci have been summarized in the OGRO website (http://qtaro.abr. affrc.go.jp/ogro) (Yamamoto et al., 2012) and were mapped with MapMan overviews (Additional file 3: Figure S1; Additional file 4: Tables S3). MapMan me-tabolism includes photosynthesis pathways, carbohydrate metabolism, N-dependent pathways such as amino acid metabolism, cell wall metabolism, lipid metabolism and secondary metabolism. Various overviews installed in MapMan tool kits are described in Additional file 3: Figure S1, Additional file 4: Table S3 and Additional file 5: Table S4.
Microarray experiments and data analysis
Rice (Oryza sativa) seeds with T-DNA insertion inDXR
germination on MS media. We compared the leaves from thedxrmutant which causes a defect in photosyn-thesis and exhibits an albino phenotype, with leaves of wild type controls. Agilent 8x60K microarray platforms were used for these transcriptome analyses (Xuan et al. 2013).
Additional files
Additional file 1: Table S1. Summary of rice FST genes and number of related gene-indexed mutants collected from IRFGC and our Ds insertional mutants. (XLSX 1494 kb)
Additional file 2: Table S2.List of differentially expressed genes (DEGs) of Agrobacterium infected rice embryogenic calli at 1 h, 6 h, 12 h and 24 h forjaponicarice cultivar Nipponbare andindicarice cultivar Zhenshan 97. (XLSX 1579 kb)
Additional file 3: Figure S1.Functional classification of characterized genes using MapMan analysis. A) Metabolism overview, B) Cellular response overview, C) Regulation overview, and D) Large enzyme families. FST and non-FST genes are indicated using red and green colors, respectively. E) Proportion of characterized FST genes mapped to major MapMan overviews. Genes assigned to various sub-functional classes of main overviews for F) metabolism overview, G) regulation overview, and H) cellular response overview. (EPS 8995 kb)
Additional file 4: Table S3.Functional classification of 1022 characterized genes using MapMan analysis. (XLSX 54 kb)
Additional file 5: Table S4.Functional classification of FST genes using MapMan terms and assignment of related FST lines. (XLSX 2505 kb)
Additional file 6: Table S5. Functional classification of FST genes using GO terms in biological process and molecular function categories. (XLSX 1349 kb)
Additional file 7: Table S6.List of downregulated genes in thedxr
mutant and their MapMan classification. (XLSX 45 kb)
Additional file 8: Figure S2. MapMan analysis for 756 downregulated genes in thedxrmutant compared to wild type. A) Metabolism, B) Photosynthesis C) Secondary metabolism, and D) Regulation overview. (EPS 2683 kb)
Abbreviations
BP:biological process; CC: cellular component; DEGs: differentially expressed genes; Ds: dissociation; DXR: 1-deoxy-D-xylulose 5-phosphate reductoisomerase; FST: flanking sequence tags; IRFGC: the international rice functional genomics consortium; KEGG: kyoto encyclopedia of genes and genomes; MEP: methyl-D-erythritol 4-phosphate pathway; MF: molecular function; NCBI: national center for biotechnology information; OGRO: overview of functionally characterized genes in rice online database; RAP-DB: rice annotation project database; RGAP: rice genome annotation project; TFs: transcription factors; TE: transposable element.
Competing interests
The authors declare that they have no competing interests.
Authors’contributions
AKNC, GSL, YYH, UHY, BOA, DWY and JKH carried out the experiment. JKH, AKNC, GSL, JHK, HKC, GA, THK analyzed the data. AKNC, GSL and JKH wrote the paper. All authors read and approved the final manuscript.
Acknowledgement
This work was carried out with the support of the“Cooperative Research Program for Agriculture Science & Technology Development (Project No. PJ01100401 to KHJ)”Rural Development Administration, the RDA Agenda Research Project (Project No. PJ010086 to THK) Rural Development Administration, and Republic of Korea and Basic Science Research Program through the National Research Foundation of Korea (NRF) funded by the Ministry of Education, Science and Technology (NRF-2013R1A1A2006040 to KHJ).
Author details
1Graduate School of Biotechnology & Crop Biotech Institute, Kyung Hee University, Yongin 446-701, Republic of Korea.2Molecular Breeding Division, National Academy of Agricultural Science, RDA, Jeonju 560-500, Republic of Koreas.3Genomics Division, National Academy of Agricultural Science, RDA, Jeonju 560-500, Republic of Korea.4R&D Coordination Division, Research Policy Bureau, RDA, Jeonju 560-500, Republic of Korea.5Planning & Coordination Division, National Academy of Agricultural Science, RDA, Jeonju 560-500, Republic of Korea.6Department of Medical Bioscience, Dong-A University, Busan, Republic of Korea.
Received: 16 August 2015 Accepted: 4 March 2016
References
Briggs GC, Osmont KS, Shindo C, Sibout R, Hardtke CS (2006) Unequal genetic redundancies in Arabidopsis–a neglected phenomenon? Trends Plant Sci 11(10):492–498
Chandran AKN, Jung KH (2014) Resources for systems biology in rice. J Plant Biol 57(2):80–92
Citovsky V, Guralnick B, Simon MN, Wall JS (1997) The molecular structure of Agrobacterium VirE2-single stranded DNA complexes involved in nuclear import. J Mol Biol 271(5):718–727.
Degenkolbe T, Do PT, Zuther E, Repsilber D, Walther D, Hincha DK, Köhl KI (2009) xpression profiling of rice cultivars differing in their tolerance to long-term drought stress. Plant Mol Biol 69(1-2):133–53
Dharmawardhana P, Ren L, Amarasinghe V, Monaco M, Thomason J, Ravenscroft D, McCouch S, Ware D, Jaiswal P (2013) A genome scale metabolic network for rice and accompanying analysis of tryptophan, auxin and serotonin biosynthesis regulation under biotic stress. Rice (N Y) 6(1):15 Gautier L, Cope L, Bolstad BM, Irizarry RA (2004) affy–analysis of Affymetrix
GeneChip data at the probe level. Bioinformatics 20(3):307–315 Hiei Y, Ohta S, Komari T, Kumashiro T (1994) Efficient transformation of rice
(Oryza sativa L.) mediated by Agrobacterium and sequence analysis of the boundaries of the T-DNA. Plant J 6(2):271–282
Howell KA, Narsai R, Carroll A, Ivanova A, Lohse M, Usadel B, Millar AH, Whelan J (2009) Mapping metabolic and transcript temporal switches during germination in rice highlights specific transcription factors and the role of RNA instability in the germination process. Plant Physiol 149(2):961–80 Jeon J-S, Lee S, Jung K-H, Jun S-H, Jeong D-H, Lee J, Kim C, Jang S, Lee S, An G
(2000) T-DNA insertional mutagenesis for functional genomics in rice. Plant J 22(6):561–570
Jung KH, An G (2012) Application of MapMan and RiceNet Drives Systematic Analyses of the Early Heat Stress Transcriptome in Rice Seedlings. J Plant Biol 55(6):436–449
Jung KH, Lee J, Dardick C, Seo YS, Cao P, Canlas P, Phetsom J, Xu X, Ouyang S, An K, Cho YJ, Lee GC, Lee Y, An G, Ronald PC (2008) Identification and Functional Analysis of Light-Responsive Unique Genes and Gene Family Members in Rice. PLoS Genet 4(8):e1000164
Kim CM, Piao HL, Park SJ, Chon NS, Je BI, Sun B, Park SH, Park JY, Lee EJ, Kim MJ, C-d H (2004) Rapid, large-scale generation of Ds transposant lines and analysis of the Ds insertion sites in rice. Plant J 39(2):252–263 Kim SI, Veena GSB (2007) Genome-wide analysis of Agrobacterium T-DNA
integration sites in the Arabidopsis genome generated under non-selective conditions. Plant J 51(5):779–791
Kumar CS, Wing RA, Sundaresan V (2005) Efficient insertional mutagenesis in rice using the maize En/Spm elements. Plant J 44(5):879–892
Sakurai N, Ara T, Ogata Y, Sano R, Ohno T, Sugiyama K, Hiruta A, Yamazaki K, Yano K, Aoki K, Aharoni A, Hamada K, Yokoyama K, Kawamura S, Otsuka H, Tokimatsu T, Kanehisa M, Suzuki H, Saito K, Shibata D (2011) KaPPA-View4: a metabolic pathway database for representation and analysis of correlation networks of gene co-expression and metabolite co-accumulation and omics data. Nucleic Acids Res 39(Database issue):D677–684
Shiu SH, Bleecker AB (2001) Plant receptor-like kinase gene family: diversity, function, and signaling. Sci STKE 2001(113):re22
RW, Lonsdale D, O’Donovan CC, Whitfield EJ, Apweiler R, Koyanagi KO, Khurana JP, Raghuvanshi S, Singh NK, Tyagi AK, Haberer G, Fujisawa M, Hosokawa S, Ito Y, Ikawa H, Shibata M, Yamamoto M, Bruskiewich RM, Hoen DR, Bureau TE, Namiki N, Ohyanagi H, Sakai Y, Nobushima S, Sakata K, Barrero RA, Sato Y, Souvorov A, Smith-White B, Tatusova T, An S, An G, OO S, Fuks G, Fuks G, Messing J, Christie KR, Lieberherr D, Kim H, Zuccolo A, Wing RA, Nobuta K, Green PJ, Lu C, Meyers BC, Chaparro C, Piegu B, Panaud O, Echeverria M (2008) The Rice Annotation Project Database (RAP-DB): 2008 update. Nucleic Acids Res 36(Database issue):D1028–1033
Thimm O, Blaesing O, Gibon Y, Nagel A, Meyer S, Krüger P, Selbig J, Müller LA, Rhee SY, Stitt M (2004) MAPMAN: a user-driven tool to display genomics data sets onto diagrams of metabolic pathways and other biological processes. Plant J 37(6):914–39
Tie W, Zhou F, Wang L, Xie W, Chen H, Li X, Lin Y (2012) Reasons for lower transformation efficiency in indica rice using Agrobacterium tumefaciens-mediated transformation: lessons from transformation assays and genome-wide expression profiling. Plant. Mol Biol 78(1-2):1–18
Usadel B, Poree F, Nagel A, Lohse M, Czedik-Eysenberg A, Stitt M (2009) A guide to using MapMan to visualize and compare Omics data in plants: a case study in the crop species, Maize. Plant Cell Environ 32(9):1211–29 Wang J, Qi M, Liu J, Zhang Y (2015) CARMO: a comprehensive annotation platform
for functional exploration of rice multi-omics data. Plant J 83(2):359–374 Xing S, Miao J, Li S, Qin G, Tang S, Li H, Gu H, Qu LJ (2010) Disruption of the
1-deoxy-D-xylulose-5-phosphate reductoisomerase (DXR) gene results in albino, dwarf and defects in trichome initiation and stomata closure in Arabidopsis. Cell Res 20(6):688–700
Xuan YH, Priatama RA, Huang J, Je BI, Liu JM, Park SJ, Piao HL, Son DY, Lee JJ, Park SH, Jung KH, Kim TH, Han CD (2013)Indeterminate domain 10regulates ammonium-mediated gene expression in rice roots. New Phytol 197:791–804 Yamamoto E, Yonemaru J, Yamamoto T, Yano M (2012) OGRO: The Overview of
functionally characterized Genes in Rice online database. Rice 5:26 Yu J, Wang J, Lin W, Li S, Li H, Zhou J, Ni P, Dong W, Hu S, Zeng C, Zhang J,
Zhang Y, Li R, Xu Z, Li S, Li X, Zheng H, Cong L, Lin L, Yin J, Geng J, Li G, Shi J, Liu J, Lv H, Li J, Wang J, Deng Y, Ran L, Shi X, Wang X, Wu Q, Li C, Ren X, Wang J, Wang X, Li D, Liu D, Zhang X, Ji Z, Zhao W, Sun Y, Zhang Z, Bao J, Han Y, Dong L, Ji J, Chen P, Wu S, Liu J, Xiao Y, Bu D, Tan J, Yang L, Ye C, Zhang J, Xu J, Zhou Y, Yu Y, Zhang B, Zhuang S, Wei H, Liu B, Lei M, Yu H, Li Y, Xu H, Wei S, He X, Fang L, Zhang Z, Zhang Y, Huang X, Su Z, Tong W, Li J, Tong Z, Li S, Ye J, Wang L, Fang L, Lei T, Chen C, Chen H, Xu Z, Li H, Huang H, Zhang F, Xu H, Li N, Zhao C, Li S, Dong L, Huang Y, Li L, Xi Y, Qi Q, Li W, Zhang B, Hu W, Zhang Y, Tian X, Jiao Y, Liang X, Jin J, Gao L, Zheng W, Hao B, Liu S, Wang W, Yuan L, Cao M, McDermott J, Samudrala R, Wang J, Wong GK, Yang H (2005) The Genomes of Oryza sativa: a history of duplications. PLoS Biol 3(2), e38
Submit your manuscript to a
journal and benefi t from:
7Convenient online submission
7Rigorous peer review
7Immediate publication on acceptance
7Open access: articles freely available online
7High visibility within the fi eld
7Retaining the copyright to your article