E n e r g y F low s in D e e p I n e la s tic
S c a tte r in g a t H E R A
P h ilip B er n a r d K a z ie w ic z
University College London
submitted to the
University of London
fo r the degree of
D o c t o r o f P h ilo s o p h y
in
ProQuest Number: 10016774
All rights reserved
INFORMATION TO ALL USERS
The quality of this reproduction is dependent upon the quality of the copy submitted.
In the unlikely event that the author did not send a complete manuscript
and there are missing pages, th ese will be noted. Also, if material had to be removed, a note will indicate the deletion.
uest.
ProQuest 10016774
Published by ProQuest LLC(2016). Copyright of the Dissertation is held by the Author.
All rights reserved.
This work is protected against unauthorized copying under Title 17, United States Code. Microform Edition © ProQuest LLC.
ProQuest LLC
789 East Eisenhower Parkway P.O. Box 1346
A b s tr a c t
T he transverse hadronic energy flow has been m easured in DIS events detected in th e 1993 and 1994 running periods at Z E U S on the H E R A ring. T he flow
has been m easured in and y bins th ro u g h o u t th e kinem atic range available at
H E R A for diffractive and non-diffractive events. The flow m easurem ent has been m ade using th e Z E U S calorim eter w ith special atten tio n paid to th e very forward
region of th e com ponent: this is th e region which m aps to th e 'j*p central region at low X and low th e region where an energy flow m easurem ent is considered to be
an unam biguous signal for the presence of B FK L dynamics.
In th e m easurem ent of these flows, a geom etric unfolding procedure ra th e r th a n a bin-to-bin correction has been developed. Various sources of experim ental system
atic error are discussed and their effects estim ated. The level of transverse energy
flow is found to be generally well described by th e colour dipole m odel b u t not by
the m a trix elem ent p arto n shower sim ulation. T he shape of th e transverse energy
flow in th e current je t region at low x and low is not well described by any model
used.
An unam biguous signal for B FK L dynam ics has not been found in this analysis
A c k n o w le d g m e n ts
A big “ta ” to th e following people whose help at one tim e or another has been
v ital, directly or indirectly, to th e production of this thesis:
T .Jones, T .H aas, M .Lancaster, R .Saunders, K.Long, J.Shulm an, A.Doyle, N.Brook,
J .a n d S .B utterw orth, G.Feild, D.Miller, P.Newman, D .K ant, A.W ilson, T.M avroidis,
S.R obertson, W .M atthew s, J.W ard, Sid, Tom, J.Tom pkins, C.W illiams, PPA R C ,
th e HERA staff, and m any others who, if I ’ve forgotten to m ention them , my apolo
gies.
An especially large “t a ” to all th e members of my family who’ve m ade all of this possible and to Vick who knows how much larger th e thanks should be.
C o n te n ts
1 H E R A a n d t h e Z E U S D e t e c t o r 9
1.1 I n tr o d u c ti o n ... 9
1.2 H E R A ... 9
1.2.1 T he injection s y s t e m ... 10
1.2.2 Design param eters ... 11
1.3 Z E U S ... 11
1.3.1 T he V X D ... 15
1.3.2 T he C T D ... 15
1.3.3 T h e U C A L... 17
1.3.4 T he lum inosity m o n i t o r s ...21
1.3.5 T he S R T D ...2 1 1.3.6 T he C 5 c o u n t e r ...22
1.3.7 T he C 4 c o llim a to r... 22
- 1.3.8 T h e veto waU...22
1.3.9 T he Z E U S trigger s y s t e m ... 22
2 D e e p I n e l a s t i c S c a t t e r i n g a t H E R A 25 2.1 T h e kinem atics of the ep in te ra c tio n ... 25
2.2 Triggering and event s e l e c t i o n ... 31
2.2 . 1 T he triggering of DIS e v e n t s ... 31
2.2.2 Electron f in d in g ... 32
2.2.3 R econstructing th e kinem atic v a r i a b l e s ... 34
2.2.4 Event preselection ... 35
2.2.5 DIS background rejection . ... 36
6 C O N T E N T S
3 Q C D M o d e ls an d M o tiv a tio n 43
3.1 T he quark-parton m o d e l ... 43
3.2 QCD corrections to th e Q P M ... 44
3.2.1 T he DGLAP p i c t u r e ...45
3.2.2 T he BFKL p i c t u r e ... 47
3.3 T he M EPS m o d e l... 48
3.4 T he colour dipole m o d e l ... 50
3.5 H a d ro n is a tio n ... 51
3.6 S u m m a r y ...52
4 E x tr a c tio n o f th e F ar-F orw ard Ey F lo w s 53 4.1 Introduction to energy f l o w s ... 53
4.2 Principle of correcting d etecto r o b s e rv a tio n ...54
4.3 M easuring energy flow in th e forward region... 55
4.3.1 T he observed energy flow...55
4.4 D etector sim ulation at angles ^ < 10° ...59
4.4.1 G eom etry description ... 60
4.4.2 Interactions in dead m a te r ia l... 63
4.4.3 Response to particles outside th e geometrical acceptance . . . 64
4.5 Corrections to th e observed energy...6 8 4.5.1 Low energy b ack g ro u n d...6 8 4.5.2 Energy asy m m etry ... 70
4.5.3 Cerenkov effect in wavelength shifter b a rs...73
4.5.4 Tim ing and im balance cu ts...76
4.6 Geom etric unfolding...87
4.7 System atic errors... 90
4.7.1 Errors on th e observed energies...90
4.7.2 Errors on th e geom etric unfolding... 91
4.7.3 Energy correction factors... 93
C O N T E N T S 7
5 E n e r g y flow s t h r o u g h o u t p h a se sp a c e. 99
5.1 M otivation and m eth o d ...99
5.1.1 System atic error checking ...103
5.2 Diffractive e v e n t s ... 104
5.2.1 D escription ...104
5.2.2 Diffractive energy flo w s ... 106
5.3 R esults of th e 1994 a n a l y s i s ...109
5.4 Com parison of 1993 and 1994 r e s u l t s ... 114
5.5 Energy flows versus x ... 115
6 A lte r in g th e c o n v e n tio n a l m o d e l 119
A b s tr a c t
T he transverse hadronic energy flow has been m easured in DIS events detected in th e 1993 and 1994 running periods a t Z E U S on th e H E R A ring. T he flow
has been m easured in and y bins thro u g ho u t th e kinem atic range available at
H E R A for diffractive and non-diffractive events. The flow m easurem ent has been m ade using th e Z E U S calorim eter w ith special atten tio n paid to th e very forward
region of th e com ponent: this is th e region which maps to th e 'y*p central region at low X and low th e region where an energy flow m easurem ent is considered to be
an unam biguous signal for the presence of B FK L dynamics.
In th e m easurem ent of these flows, a geom etric unfolding procedure ra th e r th a n a bin-to-bin correction has been developed. Various sources of experim ental system
atic error are discussed and th eir effects estim ated. The level of transverse energy
flow is found to be generally weU described by th e colour dipole m odel b u t not by
the m a trix elem ent p arto n shower sim ulation. The shape of th e transverse energy
flow in th e current je t region at low x and low is not well described by any model
used.
An unam biguous signal for B FK L dynam ics has not been found in this analysis
A c k n o w le d g m e n ts
A big “ta ” to th e following people whose help at one tim e or another has been
v ital, directly or indirectly, to th e production of this thesis:
T .Jones, T .H aas, M .L ancaster, R .Saunders, K.Long, J.Shulm an, A.Doyle, N.Brook,
J.a n d S .B utterw orth, G.Feild, D.Miller, P.Newman, D .K ant, A.W ilson, T.M avroidis, S.R obertson, W .M atthew s, J.W ard , Sid, Tom, J.Tom pkins, C.W illiams, PPA R C ,
th e HERA staff, and m any others who, if I ’ve forgotten to m ention them , my apolo
gies.
An especially large “ta ” to all th e m embers of my fam ily w ho’ve m ade all of this
possible and to Vick who knows how much larger the th an ks should be.
C o n te n ts
1 H E R A a n d th e Z E U S D e te c to r 9
1 . 1 I n tr o d u c tio n ... 9
1.2 H E R A ... 9
1.2.1 T he injection s y s t e m ... 10
1.2.2 Design param eters ...1 1 1.3 Z E U S... 11
1.3.1 T h e V X D ...15
1.3.2 T he C T D ...15
1.3.3 T he U C A L... 17
1.3.4 T he lum inosity m o n i t o r s ...21
1.3.5 T he S R T D ...2 1 1.3.6 T h e C 5 c o u n t e r ...2 2 1.3.7 T he C 4 c o llim a to r...2 2 1.3.8 T he veto wall...22
1.3.9 T he Z E U S trigger s y s t e m ... 22
2 D e e p I n e la s tic S c a tte r in g a t H E R A 25 2.1 T he kinem atics of th e ep in te ra c tio n ... 25
2.2 Triggering and event s e l e c t i o n ... 31
2.2.1 T h e triggering of DIS e v e n t s ... 31
2.2.2 Electron f in d in g ... 32
2.2.3 R econstructing th e kinem atic v a r i a b l e s ... 34
2.2.4 Event preselection ... 35
2.2.5 DIS background rejection . ... 36
6 C O N T E N T S
3 Q C D M o d e ls and M o tiv a tio n 43
3.1 T he quark-parton m o d e l ... 43
3.2 QCD corrections to th e Q P M ... 44
3.2.1 T he D G L A P p i c t u r e ... 45
3.2.2 T he B F K L p i c t u r e ... 47
3.3 T he M EPS m o d e l... 48
3.4 T he colour dipole m o d e l ... 50
3.5 H a d ro n is a tio n ...51
3.6 S u m m a r y ...52
4 E x tr a c tio n o f th e F ar-F orw ard Ey F lo w s 53 4.1 Introduction to energy f l o w s ... 53
4.2 Principle of correcting d etecto r o b s e rv a tio n ...54
4.3 M easuring energy flow in th e forward region...55
4.3.1 T he observed energy flow...55
4.4 D etector sim ulation at angles 6 < 10° 59 4.4.1 G eom etry description ... 60
4.4.2 Interactions in dead m a te r ia l... 63
4.4.3 Response to particles outside th e geometrical acceptance . . . 64
4.5 Corrections to th e observed energy...6 8 4.5.1 Low energy background...6 8 4.5.2 Energy asym m etry... 70
4.5.3 Cerenkov effect in wavelength shifter b ars... 73
4.5.4 Tim ing and im balance cu ts...76
4.6 Geom etric unfolding... 87
4.7 System atic erro rs...90
4.7.1 Errors on th e observed energies... 90
4.7.2 Errors on th e geom etric unfolding... 91
4.7.3 Energy correction facto rs... 93
C O N T E N T S 7
5 E n e r g y flow s t h r o u g h o u t p h a se sp a c e. 99
5.1 M otivation and m eth o d ...99
5.1.1 System atic error checking ...103
5.2 Diffractive e v e n t s ... 104
5.2.1 D e s c r i p t i o n ...104
5.2.2 Diffractive energy flo w s ...106
5.3 R esults of th e 1994 a n a l y s i s ... 109
5.4 Com parison of 1993 and 1994 r e s u l t s ... 114
5.5 Energy flows versus x ...115
6 A lte r in g th e c o n v e n tio n a l m o d e l 119
C h a p te r 1
H E R A a n d t h e Z E U S D e te c to r
1.1
I n tr o d u c tio n
In 1991 H E R A , th e w orld’s first electron-proton collider, was commissioned. T he first ep interactions were observed by two detectors, Z E U S and H i , in M ay 1992.
For a longer beam lifetim e, electrons were replaced by positrons for m ost of th e running period of 1994.
T h e analyses presented in this thesis have come from d a ta collected by th e Z E U S d etecto r in th e 1993 and 1994 running periods.
1.2
H E R A
T he construction of th e Hadron Elektron Ring Anlage ( H E R A ) began in April 1984
w ith work done by m em bers of an intern ation al collaboration.
T he site chosen was close to th e Deutsches Elektronen Synchrotron (D E S Y )
lab o rato ry in H am burg, Germ any. By August 1987 th e 6.34km beam tunnel had
been finished and in th e a u tu m n of 1990, the electron ring, equipped w ith nor
m al m agnets, and the proton ring, equipped with superconducting m agnets, were
commissioned.
M achine tests continued w ith th e separate acceleration of the electrons and pro
tons until O ctober 1991, when one bunch of electrons was collided w ith one bunch
10 C H A P T E R 1. H E R A A N D THE ZEUS D E T E C T O R
1 .2 .1
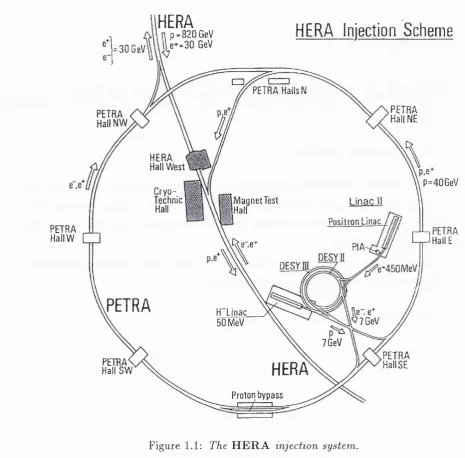
T h e in je c tio n s y s te m
HERA
, n p - 8 2 0 G e V \\1 e + = 3 0 GeV
HERA Injection S c h e m e
■=30GeV
PETRA Hails N
PETRA Hall NE PETRA
H allN W
HERA '
Hall W est
p = 4 0 GeV C
ryo-Technic
Hall iHallM agn etT est Linac H
Positron Linac PETRA I I
HallW O O n a l l E
e ' e PIA
DESY II DESY
in
PETRA
H~L(nac7 GeV 5 0 M e V
7 GeV
PETRA HallSE PETE A S
H a llS W
HERA
Proton b ypass
Figure 1.1: The H E R A injection system.
Protons are accelerated as H~ ions in the proton linear accelerator (L IN A C ) to an
energy of 50MeV. These are in tu rn accelerated to 7.5GeV by the D E S Y - I I I proton
synchrotron and finally to 40GeV in the P E T R A storage ring. At this energy, they
are injected into H E R A where they are accelerated to the design operating energy
1.3. Z E U S 11
Electrons and positrons are accelerated by L IN A C s I & I I to 220 and 460MeV respectively. T hey are transferred to D E S Y - I I for fu rth er acceleration to 7.5GeV;
then P E T R A accelerates these to 12GeV a t which point they are injected into H E R A . T h e final stage of acceleration gives th em an energy of 26.7GeV (1993) / 27.52GeV (1994).
1 .2 .2
D e s ig n p a r a m e te r s
Design value electrons protons
Injection energy 14GeV 40GeV
Beam energy 30GeV 820GeV
Particles p er bunch 3.5 X lO ^o 1.0 X 10^^
N um ber of bunches 2 1 0 2 1 0
C entre of mass energy 314GeV
C urrent 60mA 160mA
Lum inosity 1.5 X 10^^cm“ ^s“ ^
Bunch distance 28.8m
Bunch crossing tim e 96ns
Bunch length (1<j) 7.8mm 110150m m
B unch w idth 0.3mm 0.32mm
Beam height 0.04mm 0.1m m
Energy loss per revolution 70.38MeV ~ 0
Filling tim e 15min 2 0m in
Eventually, using the designed specific luminosity, 100pb“ ^ per year is expected.
In 1992, th e Z E U S experim ent collected 30nb~^. This had increased to 540nb~^ in 1993 and by 1994 th e integrated lum inosity collected by Z E U S was 3.2pb~^. For 1995 running, a lum inosity 15pb“ ^ is expected.
D uring 1993 running, 84 paired bunches were fiUed for each beam . An additional
1 0 unpaired electron bunches and 6 unpaired proton bunches were fiUed to stud y
backgrounds. M ean currents in b o th beam s were typically around 10mA. In 1994, 153 bunches were paired w ith an additional 15 unpaired electron bunches and 17
unpaired pro to n bunches. Electron beam currents were ~ 20mA and proton currents
were often in excess of 40mA. [1, 2]
1.3
Z E U S
12 C H A P T E R 1. H E R A A N D T H E Z E U S D E T E C T O R
respectively. T h e detector was approved in November 1986 and Z E U S was allocated
th e south experim ental hall of H E R A .
There are over 600 physicists in th e collaboration and about th e same num ber of
technical staff who come from over 50 in stitu tes in 11 different countries: th e UK,
th e USA, C anada, Germ any, Israel, Italy, Jap a n , Poland, th e N etherlands, R ussia
and Spain.
Final installation of th e detector was com pleted in th e au tu m n of 1991 following
extensive testin g of prototypes and the core com ponents of Z E U S were operational
for the first running period in 1992. Upgrades in th e detector including th e addition of new com ponents have happened during each of th e shutdow n periods since th en .
The Z E U S detecto r is a m ulti-purpose m agnetic detector and in 1994 consisted
1.3. Z E U S 13
D etector N am e Acronym Purpose D etector T ype Vertex
detector
V X D M easurem ent of
prim ary vertex position
Drift cham ber fiUed w ith dim ethylether C entral tracking
detector
CTD 3D track reconstruction and ÿ m easurem ent
Cylindrical drift cham ber fiUed w ith A r, C O2, C2Hq
U ranium calorim eter
(U)CAL F/B/RCAL
Energy m easurem ent of lepto n s/h ad ro n s
Depleted U ra n iu m / Plastic scintillator sampling calorim eter Luminosity
m onitor
LUMI Lum inosity m easurem ent and detection of photo production and radiative 7
Lead scintillator ca lorim eter w ith Si pads
H adron-Electron separator
H E S Identify electrons w ithin
dense je ts
Silicon pads
Backing calorim eter
BAG C ontainm ent of particles escaping GAL. Shower tail catcher.
Fe yoke absorber w ith A1 prop ortional tubes Leading proton
spectrom eter
IPS D etect rem n an t particles 6 Si detectors
in rom an pots Veto wall V E T O Veto interactions away
from interaction region
Fe wall w ith 2 scintillator plates either side
M uon cham bers F/B/RM UG Muon detection Stream er tubes w ith planar drift cham bers for FMUG Transition
radiation det.
TRD* Particle identification 4 cham bers, poly propylene fibres and Xe filled cham bers Small angle
rear tracking detector
SRTD* Improve pos” m eas urem ent of charged particles entering RGAL
Scintillator strips in two planes
Forw ard/R ear tracking det.
F/RTD* 3D track reconstruction 3(FTD),1(RTD) drift cham bers The 0 5
counter
0 5 Veto interactions away from interaction region
Si detector
Table 1.1: List of the active Z E U S components in 199f. Refer to the text fo r
14 C H A P T E R 1. H E R A A N D THE ZEUS D E T E C T O R
CTD
BCAL
FDET
Figure 1.2: View o /Z E U S as shown by the detector simulation program [6]
1.3. Z E U S 15
T he RTD and SRTD were not operational in th e 1993 running period. Im ple
m entation of th e SRTD occurred in 1994.
T he collective term for th e FTD and th e TRD com ponents which are sandw iched together is th e FDET. This has recently been fully installed and will be tracking
particles during th e 1995 running period b u t was no t available for 1993 or 1994 d a ta analyses.
P a rts of th e detector essential for th e analyses presented in this thesis are d e
scribed in m ore detail below. A m ore com plete description of Z E U S is available in
[5].
T he coordinate system of Z E U S is defined as a right-handed system w ith th e
origin a t th e nom inal interaction point (NIP) of Z E U S . T he Z-axis points in th e direction of th e incoming proton, also known as th e forward direction, i.e. tow ards th e FCAL. T h e Y-axis points upw ards and th e X -axis towards the centre of th e
H E R A ring. T he proton beam polar angle is 0° and th e electron beam polar angle
is 180°.
1 .3 .1
T h e VXD
The vertex detecto r is a cylindrical drift cham ber whose inner radius is 10.9cm and outer radius is 15.9cm surrounding th e NIP of ZEUS. It is divided azim uthally into 120 drift cells, each cell therefore occupying 3° in azim uth.
Each cell contains 12 sense wires lined up betw een th e inner and o u te r radii. These alte rn ate betw een 13 field wires and 25 drift wires are placed on each side of this plane. All of th e wires are parallel to th e beam axis. T he entire d etecto r is fiUed w ith dim ethylether (DM E) gas to provide a slow drift velocity which gives accurate particle tim e resolution.
T he VXD operates in a m agnetic field of 1.43T which is provided by a supercon ducting SOLENOID. This sits radially betw een th e CTD and th e BCAL.
T he VXD has a design perform ance of ~ 9 x 10“ ^p (when used in conjunction
w ith th e CTD) and an error on th e prim ary vertex radius of ~ bOfim.
1 .3 .2
T h e CTD
16 C H A P T E R 1. H E R A A N D TH E ZEUS D E T E C T O R
operates in the 1.43T m agnetic field provided by the superconducting SOLENOID. The polar angle coverage of the CTD is 15 < ^ < 164° is the polar angle from the Z E U S NIP with respect to the proton beam direction).
Zeus Run 1 0 0 0 7 Event
1 0 - 0 c t - 1 9 9 4 21i27i16-374 File -a /d o to /m ln l9 4 /r0 1 0 0 0 7 .z
3 4
E= 45 9 Et= 7 S p t= 1.5 p z — 4 0 5 E -p z = 5.4 Ef= 42 5 Eb= 1.2 Er= 2 2
T f- 2.4 T r- - 1 .4 L a - 0.0 L g - 0 5 FNC- - 8 BCN-134 FLT-A99BC82B 00000000
e - x=.Q004 y=.936 Q2= 33 DA x=.0026 Q2» 170 JB y=.033 phi [ 0.180]
,ZEUS
ZR
Figure 1.3: Part of the CTD as drawn by the event-dispîay program LAZE [9]. Each
of the CTD cells contains eight sense wires evenly-spaced down the centre of the cell.
The CTD consists of 4608 sense wires grouped into 8-wire cells. An azim uthal
distribution of angled cells forms a superlayer and there are 9 such superlayers in the chamber as indicated in figure 1.3.
The sense wires in the CTD are kept at voltages between 1.26kV and 1.31kV. These wires are separated by ground wires (OV) and planes formed by the sense and ground wires alternate with planes formed by field-shaping wires which are m aintained at voltages between 1.63 and 2.74kV [10].
1,3. Z E U S 17
Two m ethods are used to determ ine th e ^-po sitio n of a track elem ent. The Z-by-tim ing m eth o d exploits th e tim e difference of a signal arriving a t th e two
ends of a wire [13] whereas th e Z-by-stereo m ethod takes advantage of th e even- num bered superlayers. Signals on axial superlayers, when projected onto th e end
of th e cham ber, can be aligned to form a track . Hits from th e same track in th e stereo layers, however, are ro ta te d due to th e stereo angle. An extrapolation of this
projection along th e Z of th e cham ber until th e track m atches th a t from an axial layer gives th e ^-p o sitio n of th a t track [7]. T he Z-by-tim ing m ethod alone achieves
a Z position resolution of 4.5cm b u t is by far th e faster system (several nanoseconds versus several hundred milliseconds). The %-by-stereo m ethod achieves Z position
resolution of % 2mm.
A 50%Ar, 50%(72-^6 m ix was th e designed gas for th e CTD. However, m ainly
for safety reasons, the m ix tu re used to fill th e CTD for 1993 and 1994 running was
85%Ar,5%(72-£f6j 10%CO2 [11]. A slight increase in th e proportion of C2H6 to C O2
has been m ade for th e 1995 run period.
In 1994 running, th e CTD had achieved a tracking resolution of 180/im and ^ % (0 .0 0 5 ) % ± (0.016)^ [12].
1 .3 .3
T h e UCAL
The m ost im p o rtan t p a rt of Z E U S for th e analyses to be presented in this thesis
is th e uranium calorim eter. The calorim eter contains electrom agnetic and hadronic calorim eter sections. A large effort was m ade to m ake th e energy resolution as good as possible. It was seen th a t such a calorim eter m ust have equal responses to b o th
the electrom agnetic and hadronic deposits { e/ h = 1, where e and h are th e responses
for electrons and hadrons). Such a calorim eter is said to be compensating.
E lectrom agnetic showers are produced by incident electrons, positrons and pho tons and their n a tu re is well-understood [14]. H adronic showers, on the o ther hand,
cannot be analytically described. They can contain b o th hadronic and electrom ag netic com ponents even though the showers are hadron-initiated. The proportion of
these com ponents varies from one shower to an o ther even if th e incident energy is th e same.
18 C H A P T E R 1. H E R A A N D THE ZEUS D E T E C T O R
m aterial and by varying the relative thickness of alternating layers of absorber and scintillator (the “sandwich” ), full compensation can be achieved over a very wide range of energies [5].
C o n s tr u c t io n
The UCAL is divided into three parts corresponding to different ranges of polar angle
coverage: the forward calorimeter (FCAL), the barrel calorimeter (BCAL) and the rear calorimeter (RCAL).
The energy which the calorimeter is required to absorb is a function of the polar angle. It ranges from approxim ately the proton energy (820GeV) in the forward direction to the electron energy (27GeV) in the rear. The mean particle energies are somewhat lower, however, and a simulation of 1 0 0 0 typical deep inelastic scattering
events using the physics generator ARIADNE and detector simulator GEANT (both described in later chapters) reveals the particle energy spectrum of figure 1.4.
Particle Energy versus Particle Angle in sim ulated DIS events
S' "
%
I " FCAL BCAL RCAL
-0 .5
1.5
2
) 120 140 160
laboratory angle (degrees)
Figure 1.4: Monte Carlo simulation of energy deposits in the Z E U S calorimeter for 1000 D IS events.
1.3. Z E U S 19
T he polar angle coverage of th e F CAL is 2.3 < 0 < 36.7°. It is divided into 23 vertical modules num bered w ith increasing X . Each m odule has a w idth of 20cm.
Each of these modules is in tu rn segm ented into 20 x 20cm towers num bered w ith
increasing Y [51]. One m odule is divided up into th ree sections in Z , an inner electrom agnetic p art ( F E M C ) and two hadronic p a rts ( F H A C l and F H A C 2 ) . T he
F E M C p a rt is fu rth er subdivided into four 20 x 5cm sections. Each of th e sections
is called a calorim eter cell. (T he central m odule has a 20 x 20cm hole in th e middle
to accom odate the H E R A beam -pipe.)
T he polar angle coverage of th e R CAL is 129.1 < 6 < 176.5°. T he stru c tu re of th e R C A L is very similar to th a t of th e F C A L except th a t R E M C is subdivided into
tw o 20 X 1 0cm cells instead of four. The R C A L has only one hadronic section.
T he B C A L covers th e angles betw een th e FC A L and th e R C A L . It contains 3 2
wedge-shaped modules and, in a similar way to th e F C A L , has an electrom agnetic p a rt, B E M C , and two hadronic p a rts, B H A C l and B H A C 2 . Each of these m odules
has 1 4 towers with th e E M C p a rt containing four cells per tower.
AU of th e calorim eter towers are m ade w ith a sandwich of alte rn ate layers of
3.3m m -thick depleted uranium and 2.6m m -thick plastic scintiUator. This thickness provides an e //i ratio of 1.00 ± 0.02 in th e energy range 10 to lOOGeV [16, 17].
C harged particles traversing th e scintiUator produce Ught which travels by in te r
nal reflection to wavelength shifters. The Ught is converted to a longer w avelength by wavelength shifters and travels to th e photom ultipUers (PM Ts) at th e back of th e tower. An electrical signal is produced by these and passed out of th e detector.
T h ere are two PMTs for each ceU (one at each side in X ) as indicated in flgure 1.5. This provides some redundancy and an indication of th e A -position of a deposit.
P e r f o r m a n c e
To take advantage of th e high resolution achievable by th e calorim eter, an accurate
caUbration m ust be perform ed. An ongoing procedure is th e d eterm ination of th e caUbration for aU of th e calorim eter channels.
T he principal m ethod for this is th e use of th e naturaU y-occuring radiation from
th e depleted uranium (energy ~ 2.3MeV). In com bination w ith this, a point-Uke
20 C H A P T E R 1. H E R A A N D THE ZEUS D E T E C T O R
Modules from the RCAL and FCAL have been calibrated at C E R N using test-
beams with various particles at known energies. The results from these tests show th a t there is a linear response of the calorimeter to incident energy at the level
of ~ 1%. The energy resolution is found to be 1 7 .5 % (± l% )/\/Ê for electrons and
3 5% (±2% ) /\/ E for hadrons and the tim e resolution b etter than Ins for E > 15GeV.
At lower energies, this resolution is somewhat degraded by noise [16].
Photomultiplier tubes
Wavelength last
shifter scintillator
DU plate
scintillator plate
End reflector
Side reflector
1.3. Z E U S 21
1 .3 .4
T h e lu m in o s ity m o n ito r s
Two small lead-scintiUator calorim eters are placed at -34.7m (LUMI-e) and -106.0m (LUMI-7 ) from th e NIP. These form th e lum inosity m onitors which serve two im por
ta n t roles.
Firstly, th e lum inosity provided by H E R A is m easured based upon th e Bethe- H eitler process ep —> e'jrf where a photon is em itted by th e electron at very low angles [19].
T he cross-section for this process is high and very well known. A signal detected in either of th e lum inosity m onitors whose energy sum is th a t of th e incoming electron is a detection of this process.
Secondly, th e two m onitors serve as tagging devices for collisions occuring at very low (photoproduction processes) and for initial state brem sstrahlung in n eu tral current deep inelastic scattering events (ISR-DIS).
In tagged photoproduction, a signal is encountered in th e LUMI-e m onitor w ith no corresponding signal in th e LUMI- 7 detector. In ISR-DIS events, no signal is
encountered in the LUMI-e m onitor bu t th e em itted photon is seen in th e LUMI- 7
detector.
B oth of th e LU Ml detectors have been designed w ith an energy m easurem ent resolution of 0 .1 6 /\/Ê .
1 .3 .5
T h e SRTD
T he small angle rear tracking detecto r ( S R T D ) aims to im prove th e calorim eter energy resolution for single particles and je ts by recognising particles showering in th e dead m aterial in front of th e R C A L and correcting for th e energy lost.
T he S R T D covers an area of 6 8cm x 6 8cm around th e beam -pipe (minus th e
beam pipe hole) and sits ai Z = —1.46m.
It consists of two planes of scintillator strips, each plane sectioned into four 24cm
X 44cm pieces. The strips have a 1cm w idth and are arranged either in th e X or the
Y directions, th e X and T -strip s being alternately positioned along th e Z direction.
T here are 272 strips in to ta l which are read out via light fibres and photom ultipliers. Each of the planes is 0.5cm thick and they are separated by a support plane which reduces cross-talk.
22 C H A P T E R 1. H E R A A N D TH E Z E U S D E T E C T O R
1 .3 .6
T h e C5 c o u n te r
T he C5 counter, so called because it is attach ed to H E R A collim ator num ber 5,
is a lead plate sandwiched betw een two scintillator plates w ithin th e beam -pipe.
It is placed perpendicular to the beam s at Z = —315cm w ith an inner radius of
which varies from 12mm to 30mm depending on w hether th e collimator is “closed”
or “open” .
T he counter m easures th e ra te of interactions produced by the beam , gives infor
m ation about th e beam shapes and helps to reduce th e proton-beam -gas background.
It has a tim e resolution of ~ Ins.
1 .3 .7
T h e C4 c o llim a to r
Collimators and absorbers are used to reduce the synchrotron radiation em itted
from th e beam s. This protects th e central p a rts of th e detector from high radiation rates.
A lthough these devices are not detectors, H E R A collimator num ber 4 is found to
be especially im p o rtan t in th e analyses presented in this thesis. Since this collimator sits in th e beam -pipe hole of th e FCAL at a Z of 2 2 0cm, it is found th a t forward-
going particles can shower and sca tte r from it. This scattered energy can often be detected by th e calorim eter.
A m uch more thorough description of th e C4 collimator is contained in section 4.4.1.
1 .3 .8
T h e v e t o w a ll.
T he veto wall is an 87cm-thick Fe wall placed around th e beam -pipe aX Z = —7.5m.
Two planes of scintiUator counters are attach ed to either side. The veto wall detects
and absorbs particles from proton-beam -gas collisions and veto-triggers such an event if hits are detected on both sides of th e wall.
1 .3 .9
T h e Z E U S tr ig g e r s y s t e m
T here exist two m ajor constraints on experim ents using the H E R A beam s. Firstly,
th e beam-crossing interval is only 96ns. Secondly, there is a very high background
1.3. Z E U S 23
beam -pipes. T he com bination of effects leads to a signal in th e region of lOOkHz, of
which only ~ 2 — 3Hz are interesting ep events.
A multi-layered trigger system a t Z E U S helps to remove this background whilst
keeping ep events [2 0].
• The first-level trigger (FLT) reduces th e signal to ~ IkH z. Since m ost compo
nents cannot make a useful trigger decision in th e 96ns beam crossing interval,
d a ta from com ponents is “pipelined” . T he CAL, for exam ple, uses a switched
capacitor array to pipeline its (analogue) d a ta whereas th e C T D uses a digital
pipeline to store its hit inform ation which is already digitised. A “sub-trigger”
decision can be m ade by each com ponent participating in th e FLT w ithin 5/xs
(96nsX 52, th e beam crossing interval tim es th e pipeline length). Such a de
cision from each of th e com ponents is passed to th e global first level trigger
(G FLT) where an overall decision is m ade. An exam ple is th e use of th e C T D
to pattern-recognise w hether or not an event has produced a prim ary vertex
in th e expected region. If such a vertex has been found th en th e C A L can be
used to add an \ E t \ cut. F u rth er clustering inform ation from th e analogue
calorim eter can be ex tracted . T he GFLT then decides which events are likely
to be ep interactions. At th e end of this stage, approxim ately 98% of the
events passed are background events.
• The second-level trigger (SLT) reduces th e in p u t from th e FLT ( ~ IkH z) to
~ lOOHz and has 1ms to m ake a decision. As w ith th e FLT, sub-triggers from
com ponents are passed to th e global trigger (GSLT) where an event decision is
m ade. Since th e tim e allowed for th e decision to be m ade is much longer th an
in th e FLT, charged particle tracking, b e tte r vertex position determ ination,
m uon, je t and scattered electron finding is used in th e event decision.
• T he GSLT sends events which have passed its criteria to th e event builder
(EV B ). This collects all th e d a ta from th e various com ponents for these events,
merges th e d a ta into a ZEBRA bank [21] , reform ats this according to the
AD AMO package [22] and sends it to th e next trigger stage. (ZEBRA and
24 C H A P T E R 1. H E R A A N D T H E Z E U S D E T E C T O R
• The th ird level trigger (TLT) is a farm of very fast processors which view th e
event as a whole. T h e TLT can use m ore elaborate vertex fitting and track
finding algorithm s th a n th ere is tim e for at th e SLT stage. T he final ra te after
th e decision of th e TLT is ~ 5Hz. A fter a positive decision, all th e d a ta from
an event is p u t on to th e mass storage devices.
Once th e events have been passed from th e TLT, software is ru n which fuUy
reconstructs th e events using inform ation from all available com ponents. T he subset
of these events which correspond to n eu tral current deep inelastic scattering events,
those events useful for th e analyses presented in this thesis, can th e n be selected
C h a p te r 2
D e e p In e la stic S c a tte r in g at
H E R A
2.1
T h e k in e m a tic s o f th e
e p
in te r a c tio n
Outgoing lepton Incoming lepton
Final hadronic s y s t e m Incoming proton
Figure 2.1: Inelastic neutral current ep scattering
A lthough th ere are m any interesting areas of physics a t H E R A , only th a t of deep
inelastic scattering (DIS) will be covered in this thesis. Deep inelastic scattering
involves a high m om entum transfer (> iG eV ^) from th e lepton to th e proton. This
m om entum is carried by an exchanged v irtu al boson.
T h e analysis contained in this thesis is not concerned w ith charged-current (CC)
DIS interactions where th e incoming lepton becomes a scattered neutrino as a result
26 C H A P T E R 2. D E E P I N E L A S T I C S C A T T E R I N G A T H E R A
of the exchange of a v irtu al boson.
All other DIS interactions are of th e n eu tral current (NC) ty p e where th e typ e of
th e scattered lepton is identical to th a t of th e incoming lepton. Such NC interactions
are th e result of th e exchange of a virtu al photon (7*) or v irtu al boson betw een
th e lepton and th e p articipating p a rto n w ithin th e proton.
The n eu tral current scattering process e(k) + p{P ) —^ + a n y th in g is rep
resented to first order by figure 2.1. This is th e representation given by th e quark-
p arto n model (Q P M ) and does not include any quantum -chrom odynam ic correc
tions. These corrections are discussed in th e next chapter.
Since th e final sta te of a NC interaction is not affected by th e ty p e of exchanged
boson, this te x t wiU refer to th e vitual photon as m eaning either th e 7* or
Few events in itiated by a exchange are expected in th e d a ta sample used in th e
analyses presented in this thesis because of th e suppression factor associated w ith
th e propogator [42].
During 1993 running, Z E U S collected 538nb“ ^ of e~p collisions of those which
H E R A provided and a fu rth er 287nb~^ of e~p collisions during th e first m onth of
running in 1994. For th e rem ainder of th e 1994 ru n period, Z E U S collected 2.9pb“ ^
of e"*"p collisions [1].
The change in lepton ty p e does not affect th e final-state of th e NC DIS process.
H enceforth, th e incom ing and scattered lepton will be referred to as th e incoming
and scattered electron.
In th e following analyses, 180nb“ ^ of the DIS events seen in 1993 and 2.0pb~^ of
th e e'^p DIS events in 1994 have been used. N ot all th e d a ta has been used since, as
win be seen la te r, th e m easurem ent of energy flows is dom inated by th e system atic
(as opposed to th e statistical) errors.
The kinem atics of th e DIS process is described by th e following variables:
• 5, the centre of mass energy squared.
« = (A + P)2 = (E . + - ( ? , +
2
^)' «4E,E^
(2.1)where E^^Ep and are th e energies and th ree m om enta of th e incoming
2.1. T H E K I N E M A T I C S OF T H E E P I N T E R A C T I O N 27
• th e negative of th e squared 4-m om entum tran sfer carried by th e v irtu al
photon.
= — 9^ = — ( ^ — — —{ F e — E'^Y + ( £ e “ ( 2 . 2 )
{9e = 180° — ^ in Z E U S coordinates.)
• æ(0 < æ < 1), the Bjorken scale variable.
In th e Q PM , x can be in terp reted as th e fraction of th e p ro to n ’s m om entum
carried by th e struck parton.
• W ^ , th e square of th e centre-of-mass energy of th e 'y*p system = th e square
of the hadronic final s ta te ’s invariant mass.
W ^ = {P + q f = P ‘‘ + q^ + 2q.P = ^ ?» — (2.4)
X X X
where M is th e rest mass of th e proton. The last approxim ation is valid at low X.
• 3 / ( 0 < 1/ < 1), the variable which describes th e energy transfer to th e hadronic
final sta te in th e p ro to n rest system .
^ " I
t"
Now since
2 k .P - (fc + P)2 - _ p2 ^ 5 - m l - (2.6)
where m^ is th e rest mass of the lepton, s, z and y are related by th e equation
% s x y (2.7)
To a very good approxim ation at H E R A th e proton rest mass can be neglected,
since th e hadronic masses involved are m uch bigger th a n th e proton mass. Since
th e beam energies of th e electron and proton are known, only two of th e kinem atic
28 C H A P T E R 2. D EE P I N E L A S T I C S C A T T E R I N G A T H E R A
An additional variable to consider is 6h. In th e Q PM approxim ation, 6h is th e
scattering angle of th e struck parton. It can be found using th e above variables [23]
as follows:
Also, it is useful to introduce th e quantity rapidity which is defined for each
particle by its energy and m om entum components:
1
1 ( E PparaA
,
( E -\- Ppara( 2 . 9 )
H Ppara J \P p e r p
where M is the rest m ass of th e particle.
R apidity has a useful quality: when a longitudinal boost from th e laboratory
fram e to another fram e is perform ed upon particles, th eir relative rapidities rem ain
th e same. It is Lorentz invariant.
Ignoring the masses of th e particles, rapidity approxim ates to th e quantity pseu
dorapidity which is related to the polar angle of th e particle by
‘I'Pp/lTfl \ . I ^
In ' = - I n t a n I
-Pperp
( 2.10)
At Z E U S , ^ = 0 is in th e direction of the F C A L from th e nom inal interaction
point (N IP ), th e e v en t’s p rim ary vertex, when th e tra je cto ry of th e incident proton
is extrapolated. W ith this definition, the following tab le can be constructed:
Oh V W here in Z E U S ?
0 180 90 2.3 -t-oo —oo 0 3.9
incident proton direction incident electron direction
perpendicular to th e colliding beam s b o tto m face of FCAL
At H E R A , th e incoming electron energy in 1994, Eg, was 27.52GeV and th e
incoming proton energy, Ep, was 819.9GeV. From th e above equations, s = 90264.5
G eV ^(\/â = SOOGeV). Using these num bers, it is possible to construct the following
tab le which gives th e scattering angles and energies when collisions occur in various
p a rts of th e kinem atic phase-space available at H E R A . (AU angles are quoted rel
ative to th e proton direction). Note the proxim ity of th e electron scattering angle
2.1. T H E K I N E M A T I C S OF T H E E P I N T E R A C T I O N 29
Position in phase-space Q ' X y W E ' Oe
Low-æ, low-Q^ 6 9.5E-5 0.7 251 8.3 179.2 176.0
High-a;, low-Q^ 6 1.7E-3 0.04 60 26.4 179.8 85.1
Low-æ, medium- 40 6.3E-4 0.7 251 8.3 174.9 169.7 High-æ, medium- 40 l.lE -2 0.04 60 26.4 178.4 39.1 Low-æ, high-Q^ 500 7.9E-3 0.7 250 8.3 108.7 144.7 High-æ, high-Q^ 500 1.4E-1 0.04 58 26.4 160.1 11.5
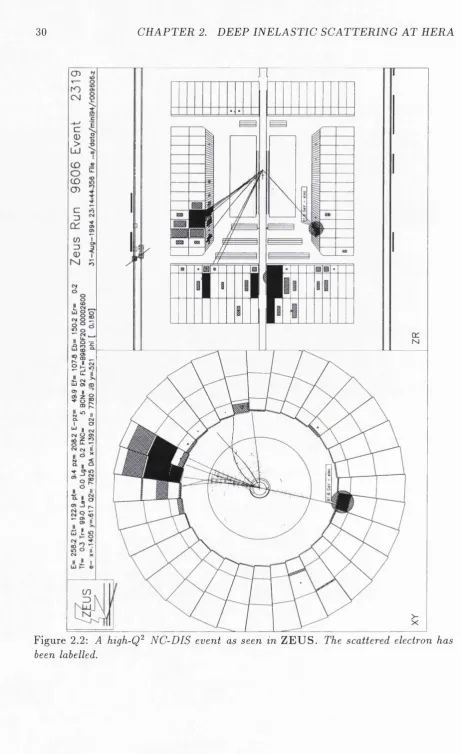
An exam ple of a NC DIS event which has been reconstructed in Z E U S by th e
30 C H A P T E R 2. DEEP I N E L A S T I C S C A T T E R I N G A T H E R A
w o>
2.2. T R I G G E R I N G A N D E V E N T S E L E C T I O N 31
2.2
T rig g erin g and e v e n t s e le c tio n
2 .2 .1
T h e tr ig g e r in g o f D IS e v e n t s
The trigger system described in th e previous ch ap ter reduces beam-gas backgrounds considerably. From th e set of events which this trigger system provides, a subset,
corresponding to n eu tral current DIS events, is required.
T he obvious signatures for NC-DIS events are as follows:
1. An isolated electrom agnetic cluster is deposited in th e calorim eter (possibly
m atched w ith an isolated track originating from th e interaction region). T he
basic trigger criterion is therefore an isolated energy deposit (i.e. not w ithin a je t) in th e E M C section of th e B C A L or R C A L . An isolated deposit in th e E M C
section of th e F C A L only is not considered to be sufficient. This is th e first
indication of th e presence of a scattered electron. The energy of this cluster m ust be above some threshold to reduce th e background from calorim eter noise and photons produced from non-DIS events. The thresholds chosen are
E i^ B C A L )e m c > 5GeV or E { R C A L ^ e m c Z> 2GeV.
2. Studies have shown th a t th e proportion of beam-gas events w ithin a sample can be significantly reduced by employing a calorim eter tim ing cut [20]. This calorim eter tim e is th e average tim e for th e first energy deposits to signal in
th e calorim eter after th e interaction has occured. An event is flagged as ep if
I R C A L time] < 8ns and | F C A L tim e — R C A L time] < 12ns (see flgure 2.3). A
p u rer sam ple of events is selected w ith a tightening of this cut. DIS events are selected only if th e la tte r tim e difference is < 8ns.
3. T he transverse m om entum in a n e u tra l current DIS event m ust be balanced.
From conservation of m om entum , th e kx of th e struck quark je t(s ) m ust equal
th e kx of th e scattered electron. In a charged current event, th e scattered
lepton is a neutrino which is not seen in th e detector. D etected transverse
m om entum is therefore not balanced. N eutral current DIS events are triggered if missing kx < 9GeV.
4. T he q u an tity E — pz^ also known as 6, is an im p o rtan t kinem atic variable in th e
32 C H A P T E R 2. DEEP I N E L A S T I C S C A T T E R I N G A T H E R A
V)
I
20 1 0
- 1 0 - 2 0
Figure 2.3: Calorimeter times for beam-gas background events (larger spike) and ep physics events (smaller spike to the right).
purposes, the TLT requires a ^ > 20GeV to qualify an event as NC-DIS. A
tighter cut is made later to provide an even purer NC-DIS sample.
Monte Carlo studies have shown th a t the Z E U S trigger system, whilst reducing the num ber of input events by 1 0^ — 10^ tim es, accepts 97% of DIS events.
2 .2 .2
E le c tr o n fin d in g
Z E U S D a t a
D I S
P H P E 200
c5 (G e V )
2,2. T R I G G E R I N G A N D E V E N T S E L E C T I O N 33
Finding th e scattered electron and m easuring its energy is necessary for recognizing
and selecting NC DIS events.
Presently, th ere are 4 electron finders used a t Z E U S . All four are used in th e
setting of D ST bits, described in section 2.2.4, b u t only two are used in this analysis.
The preferred finder in 1994, due to th e p u rity w ith which electrons are found, is th e
algorithm SIN ISTR A [24]. This finder is based on a cone-algorithm which groups
candidate calorim eter cells into clusters. It subsequently uses neural netw ork-based
p a tte rn recognition techniques to select th e m ost probable scattered electron cluster.
The oth er electron finder used, and th e m ain one used in the 1993 analysis, is
an algorithm which groups electrom agnetic deposits in th e calorim eter in to islands.
Islands are energy-weighted surfaces derived from isolated groups of electrom agnetic
cells. This electron finder is called E E X O T IC [26].
T he m ain an d m ost im p o rtan t source of background to DIS events is th a t of
photoproduction where, in general, th e scattered electron disappears throu g h th e rear beam -hole and another particle is identified in its stead [27].
A useful experim ental variable, 6, is defined as
8 = E - pz = ^ ( E i - p^i) (2.11)
i
which is calculated w ith respect to th e incom ing electron direction. T h e sum m a tion is over all calorim eter ceUs and includes th e energy deposit of th e “found”
electron. For fully-contained events, energy-m om entum conservation requires th a t
6 = 2Ee ~ 54GeV. The loss of particles thro u g h th e forward beam -hole has only a
small effect on 8 b u t th e loss of th e scattered electron reduces 8 significantly. This
can occur if th e scattered electron continues down th e RCAL beam -pipe w ithout
interacting w ith th e calorim eter. A dditionally, th e electron finder m ay not be able
to recognise th e calorim eter cluster which correctly contains th e scattered electron.
The value of 8 cannot be significantly higher th a n 2Ee for genuine ep events
(plus a smaU am ount ( ~ 3GeV) to account for th e m easurem ent error caused by th e
finite resolution of th e calorim eter). Higher values are indicative of events triggered
by cosmic muons passing through th e detector. T he 1993 DIS sam ple collected by
Z E U S for the stru c tu re function F2 analysis [38] has a 8 distribution which is shown
34 C H A P T E R 2. D E E P I N E L A S T I C S C A T T E R I N G A T H E R A
At high th e scattered electron has a high energy and angle. It is hkely to have caused an isolated signal in th e BCAL and m ay have m ade a track in th e CTD. Such electrons are easily found by th e finding algorithm s. At low and low æ, th e less-energetic scattered electron can overlap w ith deposits m ade by th e struck-quark current je t. It is much m ore difficult to isolate these electrons and th e p u rity of th e
algorithm s diminishes. This reduces th e acceptance of DIS events, defined as those events found in a kinem atic region divided by those produced in th a t region. The lower th e acceptance of a region, th e greater th e chance of a q u an tity derived for th a t region being inaccurate.
2 .2 .3
R e c o n s t r u c t in g t h e k in e m a tic v a ria b le s
To obtain the kinem atics of an event, four param eters can be used: th e scattered electron energy, th e scattered electron angle, 9 (as defined in equation 2.2), th e Q PM struck quark angle, $h and th e energy contained in th e je t form ed by the struck quark, F .
However, only two of th e kinem atic variables are independent. Therefore, the experim ental determ ination of th em can in principle be derived from two of these param eters. There are m any ways to combine th e two param eters to reproduce th e kinem atic variables. Those m ethods used in this analysis are described here and are derived fully in [23].
• Using th e electron variables:
F .'
(1 - c o s ^ ) , (2.1 2)
and (2.13)
2/e/ — 1 - — — 1 2E,
Ql, = 2Ee K ( l
E . (
^el —
E , \2 E ,
E'^[l A cos 9)
(2.14)
Using th e Jaquet-B londel m ethod:
yjB =
(
2
-
15
)
Q3b = +
(T-iVyif
(2.16)1 - yjB
x jB = (2.17)
s.yjB
2.2. T R I G G E R I N G A N D E V E N T S E L E C T I O N 35
Using th e “double-angle” m ethod:
_ sin 0 ( 1 — cos
sin 6h + sin 0 — sin( 0 -f 0/i) ’
<-»>
_ ^ / sin $h + sin 0 + sin( 0 + Oh) \ , .
Ep \s in 9h + sin 0 — sin( 0 + 0/i)/
K in e m a tic r e so lu tio n
Using th e com ponents installed for th e 1993 analysis, th e best m ethod thro u gh o u t
phase-space for reconstructing th e kinem atic variables is th e double-angle m ethod
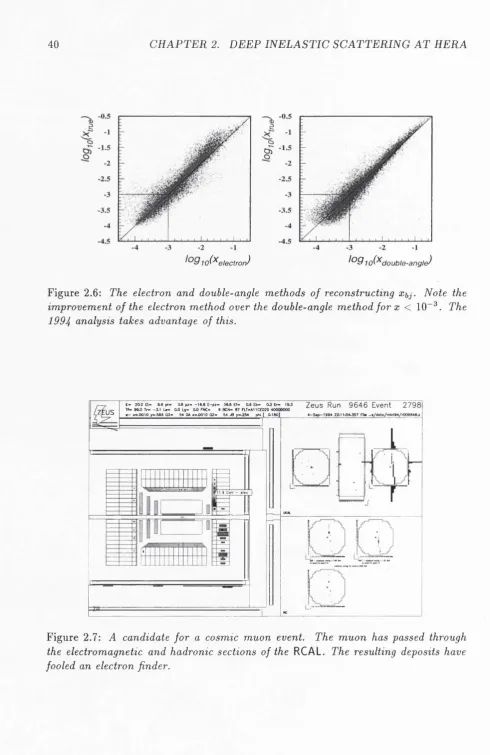
[23]. W ith th e addition of th e SRTD, th e 1994 analysis uses th e electron m ethod for all events w ith Xei < 10~®. This mixed m eth o d of reconstruction will be denoted
Xmix^Qmix^ymix- Figure 2.6 shows th e resolution of b o th reconstruction m ethods
as determ ined from a M onte Carlo sim ulation. T h e details of th e sim ulation are discussed in th e following chapters.
2 .2 .4
E v e n t p r e s e le c tio n
Before the m ain body of an ev ent’s d a ta is loaded onto an analysis m achine, th e
event header is scanned. To save a great deal of tim e, a scheme has been developed which allows a user to select w hether or not an event is used, prior to its loading.
Using inform ation collected online, certain flags are set or reset in th e event header
which depend on p articu lar conditions found in th e event. T he flags are known as th e DST (d a ta sum m ary ta p e) selection bits.
For 1993 d a ta , only events which had bit 14 set were analysed further. B it 14 is
defined in 1993 d a ta as th e so-called “JD IS ” or “golden” DIS bit. This is set only when all of th e following criteria are satisfied:
• The 5 of th e event is greater th a n 35GeV
• E ither EE X O T IC or SINISTRA finds a scattered electron w ith E'^ > 5GeV
• The electron is found outside th e “B ox-cut” (see section 2.2.5) of 16cm. T he
“B ox-cut” refers to a square on th e face of th e F C A L centred at th e beam -pipe
36 C H A P T E R 2. D EE P I N E L A S T I C S C A T T E R I N G A T H E R A
w ithin this square, events whose only electron is “found” in this region are
removed.
• yjB > 0.02 to ensure th a t th e event has deposited sufficient energy in Z E U S
to reconstruct th e event
• T he cosmic muon rejection routine, based on event topology (see also section
2.2.5, does not disallow th e event
• T he beam -halo rejection routine, also based on event topology, does not dis
allow th e event
• T he routine, which removes events triggered by random calorim eter PMT noise
(sparks), does not disallow th e event
For 1994 d ata, th e full release of th e SRTD software took place after th e setting
of th e DST bits. Therefore, a “loose” selection of events is used and th en th e new
software is run which takes advantage of this com ponent. Each event from 1994
is firstly selected when b o th bits 9 and 11 are set. B it 9 is set in 1994 d a ta set
when any of four available online electron finders believes it has found an electron
w ith Eg > 4GeV. Bit 1 1 is set in 1994 d a ta when th e event passes a loose 6 cut
(> 25GeV) .
To make sure th a t th e relevant Z E U S components were in a state sufficient for
th e accurate reconstruction of event qualities, a d a ta quality routine is called. This
routine removes ~ 20% of 1994 events.
2 .2 .5
D IS b a c k g r o u n d r e je c tio n
Since only NC DIS events are w anted for the analysis of energy flows, much care is
taken in th e event selection. M ajor sources of background exist to these events, even
after triggering and preselection; notably, beam-gas and photoproduction. More
over, only events whose kinem atic variables can be adequately reconstructed are
selected.
2.2. T R I G G E R I N G A N D E V E N T S E L E C T I O N 37
1. Event prim ary v ertex cuts are m ade in an effort to reduce beam -gas back ground events. B o th th e 1993 and 1994 analyses use events only when —50 < vertex Z < 4-40cm and vertex radius R < 8.5cm. T h e 1994 analysis uses a
tigh ter vertex Z < -f 25cm to remove any satellite events^ since th e sim ulation of their contribution is inadequate. Typically, 5% of events are rem oved by
these cuts [29].
2. A tig h ter calorim eter tim ing cut is used th a n th a t in th e DIS trigger. For
b o th th e 1993 and 1994 analyses, th e event is accepted if | R C A L time] < 3ns
and I F C A L tim e — R C A L time] < 8ns. These cuts remove beam -gas back
ground events. A pproxim ately 5% of events triggered by th e DIS trigger and
preselected in 1994 are rem oved by this cut.
3. To reduce th e beam -gas background, photoproduction background and cosmic m uon events, a tig h te r cut is m ade on 8. Only events w ith 35 < 6 < 60GeV are
accepted. The lower limit of 35GeV removes photoproduction and beam-gas background events. The u p p er Limit of 60GeV removes events which cannot
have been the result of an ep collision; for exam ple th a t of a cosmic muon passing through Z E U S .
4. T he scattered electron m ust be found by the m ain electron finder (E E X O T IC or SINISTRA ) w here E'^ > lOGeV (to enhance p u rity ). In addition, a “box c u t” is placed on th e position of this electron. In 1993 d a ta , th e event is
allowed to pass if \Xgi\ > 16cm and > 16cm m easured from th e centre of th e beam hole in th e RC A L . In 1994 d a ta, w ith th e addition of th e S R T D , the box cut is reduced to 13cm.
5. T he resolution of certain kinem atic quantities becomes poor at th e extrem es of the H E R A phase-space [23]. Additionally, photoproduction background becomes significantly higher at very high values of y. O f course, photoproduc
tion background also increases w ith a decrease in m easured . The following broad kinem atic cu ts are m ade on th e DIS events: yjB > 0.04, yd < 0.95,
> 10GeV^(1993), Q L , > 6GeV^(1994).
38 C H A P T E R 2. D E E P I N E L A S T I C S C A T T E R I N G A T H E R A
6. Initial state radiative DIS events are characterised by a low energy photon
being detected by th e LUMI- 7 m onitor. High energies in this m onitor distort
th e reconstruction of kinem atic variables and are rem oved. Only events w ith
Æ?(LUMl7) < 5GeV are accepted.
7. A certain class of events, diffractive events, which are discussed in section 5.2,
are isolated from th e other NC DIS events. In th e 1993 analysis, a cut is m ade
on events which have no energy at 77 > rjmax = 1 5 . In th e 1994 analysis, th e
diffractive events are separated by a cut on Xpom (defined in section 5.2 and
roughly proportional to 7max) < 1 0“ ^.
8. A call is m ade to a m uon rejection algorithm [28] which looks at various
com ponents and th e event topology to establish w hether th e event trigger is due to a cosmic m uon which has passed through th e detector. These account
for ~ 0.1% of triggered DIS events.
9. C om pton QED events can fool th e DIS trigger. Such events are characterised
by very little activity in th e detector. If 1 or 2 isolated electrom agnetic conden sates are found in th e calorim eter b u t nothing fu rth er, th e event is classified
as a C om pton event. A bout 0.8% of events are of this type.
10. T he LU Ml m onitors set flags when electron and proton bunches have collided.
2.2. TR IG G E R IN G A N D E V E N T SE L E C TI O N 39
( N 1 0
a
• 1994 shifted vertex
• 1994 nominal vertex
Am#:
,Figure 2.5: The kinematic distribution of reconstructed N C D IS events in 1994 data. The shifted vertex points refer to 32nh~^ [2] of ep interactions at a primary vertex
of Z ^ + 6 5 cm. Shown also are the kinematic ranges of some earlier experiments.
40 C H A P T E R 2. DEEP I N E L A S T I C S C A T T E R I N G A T H E R A
lo (^ e le c tr o n )
-4 -3 -2 -1
^ ^ 91 o (^ d o u b le-a n g le)
Figure 2.6; The electron and double-angle methods of reconstructing x^j. Note the
improvement of the electron method over the double-angle method fo r x < 10“ ^. The
1 9 9 4 analysis takes advantage of this.
E - 20.2 D - a.6 p t - ^ p2- - 1 0 .0 E - p z - 30.0 ET- 0.0 E b - O J C r-T t- 99X> T r - - i 1 L » - 0.0 L g- OX) F>C- 6 0C N - 87 a T -A 11C E 020 4000( e - * - .0 0 1 0 y - S O S Q 2» 54 DA « « 0010 02 - 54 J6 y - .2 S 4 phi [ O.IOO]
ZEUS
? l 1 -9 C«V - elee |
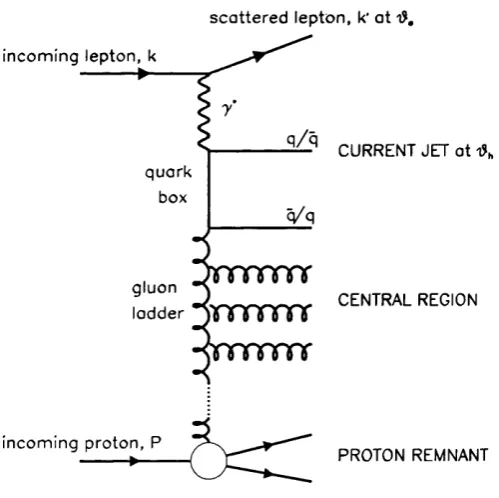
Figure 2.7: A candidate fo r a cosmic muon event. The muon has passed through
the electromagnetic and hadronic sections of the RCAL. The resulting deposits have

![Figure 2.5: The kinematic distribution of reconstructed NC DIS events in 1994 data. The shifted vertex points refer to 32nh~^ [2] of ep interactions at a primary vertex of Z ^ +65cm](https://thumb-us.123doks.com/thumbv2/123dok_us/8644191.1433899/46.596.118.557.45.643/figure-kinematic-distribution-reconstructed-shifted-interactions-primary-vertex.webp)