1535 |
P a g e
ELEMENTAL ANALYSIS OF SOIL SAMPLES USING
ENERGY DISPERSIVE X-RAY FLUORESCENCE
TECHNIQUE
Vandana Sharma
1, J.K.Sharma
2, Shatrugun Olla
3 1,2,3Physics Department Maharishi Markendeshwer University, Mullana, Ambala, Haryana (India)
ABSTRACT
The work presented in this paper deals with the elemental analysis of soil samples, by using a method based
upon Energy Dispersive X-Ray Fluorescence(EDXRF) technique. The soil pollution is a major global problem
affecting the physio-chemical properties of the soil. The assessment of pollutant elemental levels and
identification of their sources are prerequisite for understanding of their effect on humans, plants and animals.
Particularly in the areas near industries there is an urgent need to determine the concentration of heavy metals.
The main objective of the present work is to determine the concentration of various elements present in soil in
the vicinity and away from industries. In order to check the level of pollutants the determined amounts of
elements are compared with their maximum admissible limits. The results of the study show that iron and
calcium concentration in soil varies from 8.97 gm/kg - 83.69 gm/kg and from 17.82 gm/kg - 108.0 gm/kg
respectively. The present study also reveals that concentration of Fe and Ca is maximum near the industries. However the concentration of these elements decreases as the distance from the industries increases.
Key words:
EDXRF, Elemental Analysis, Soil pollution.
I. INTRODUCTION
Soil nutrients are important for plant growth and development. Therefore, the chemical composition of soil,
particularly concentration of metal contents is environmentally important. The earth crust contains trace and
major elements such as Cs, Cd, Pb, Fe, Mg, Mn, etc. The concentration of all these elements depends on the
geology of a local environment as well as on other natural and anthropogenic processes [1]. Small amounts of
these elements in soil are necessary for good health, but higher concentrations (more than recommended values)
may cause chronic toxicity and disturb the biological balance of organisms in soil and may lead to soil pollution.
Soil pollution may be defined as the build-up of persistent toxic compounds, chemicals, salts, radioactive
materials, or disease causing agents in soils, which have adverse effects on plant growth and animal health. The
most important sources of heavy metals in environment are anthropogenic activities such as mining, steel and
iron industry, chemical industry, traffic and domestic activity which may release higher concentrations of these
elements relative to normal values and has unfavorable effects on physio-chemical properties of soil [2]. The
presence of heavy metals above their recommended values in soil can affect the quality of food, ground water,
micro- organism activity and plant growth [3].
The chemicals released by industrial wastes [4], decomposed and partially decomposed chemicals like
cadmium, chromium, lead, arsenic, selenium products are likely to be deposited in underground soil and, their
1536 |
P a g e
organisms. These can damage the normal activities and ecological balance in the underground soil. Therefore,there is dire need to determine the concentration of heavy elements in the areas nearby the industries when the
industrial effluents may affect the concentration of heavy metals in soil.
The aim of the present study is to determine the concentration of heavy metals in soil in the vicinity and within
a radius of 1.5Km from the industries using a method (5) based upon EDXRF technique and to compare their
concentration with the maximum admissible limits. EDXRF is a rapid, non-destructive multi-elemental analysis
technique. The energies of emitted X-rays are the characteristics of elements presents in a sample and thus
provide the knowledge about nature of element, hence measurements of energies form the basis of qualitative
analysis. Whereas the measurement of the intensities of X-rays provide an information about concentration of
elements and thus form the basis of quantitative analysis. Qualitative and quantitative analysis by XRF
techniques are performed without digestion and a great number of elements can be determined simultaneously in
short time [5-10].
Yamuna Nagar District in Haryana is an industrial town having nearly 2500 small scale and large scale
industries. It is second biggest industrial town in Haryana (India) after Faridabad. The main industries in
Yamuna Nagar are metal, sugar and paper etc. The industrial waste from these industries may go into the soil
and hence can affect the concentration of heavy elements in soil in regions around these industries. Therefore to
check the pollutant levels, elemental analysis of soil samples collected from the places close to industries and at
a distance 1 to 1.5 Km away from industries had been carried out using a method based upon EDXRF
technique[5]. The details of the collection of soil samples, experimental set up, procedure used for elemental
analysis, determined amounts and inferences drawn from the study are discussed in this paper.
II. SAMPLE COLLECTIONS
2.1 Sampling
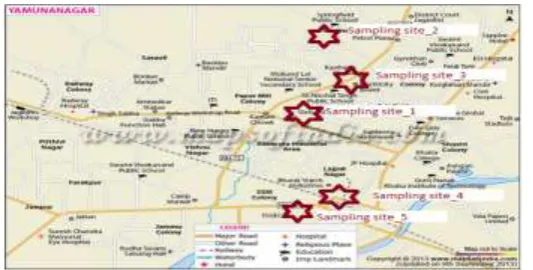
The soil samples from ten different locations of industrial regions of Yumnanagar were collected. Out of ten
samples, five samples were taken from close to industries and remaining five samples were taken at distance 1
to1.5Km away from the industries. The various steps involved in collection of samples and target preparation
are discussed below:
Ten soil samples:
Five from the vicinity of Metal, Wine, Paper, Sugar and ISGEC spare part manufacturing industries,
And five samples within a radius of 1 to 1.5 km from these industries have been collected.
The metal industry was referred to as sampling site_1 and the soil samples collected from vicinity and at
distance 1 to 1.5 Km from metal industry were referred as Sample_1(sample close to industry) & Sample_1D
(sample at a distance of 1 - 1.5Km) for the sampling site_1 in the subsequent discussion. Similarly Wine, Paper,
Sugar and ISGEC spare part manufacturing industries, were referred as sampling site_2, sampling site_3,
sampling site_4 and sampling site_5 respectively. The soil samples taken from the vicinity of these sites were
labeled as Sample_2, Sample_3, Sample_4, Sample_5 and samples collected at distance about one Kilometer
from the industries were labeled as, Sample_2D, Sample_3D, Sample_4D, Sample_5D, respectively. Each
sample was taken at a depth of 0-10 cm. The samples were collected with a hand auger (a plastic screw) and
hand spade and were placed in a clean polyethylene bags to avoid contaminations. The locations of sampling
1537 |
P a g e
Fig 1: Map of Yamunanagar Showing The Different Sampling Locations2.2Traget Preparation
The soil samples were air dried for about a week. All the samples were placed in an oven at 80◦C for 3-4 hours.
Then samples were grinded in china dish. Each sample was pulverized and homogenized into a very fine
powder by passing through 85 micron mesh sieve. Accurately weighed amount of all the soil samples, in the
range 3 gm to 5 gm with electronic weighing machine (CPA-225D Sartorius) was pressed in the die of diameter
2.7 cm. The infinitely thick pellets of soil samples were prepared by pressing the die with a hydraulic press
(Ankit Hydraulics) and applying pressure in the range 100 to 300 KN. The thicknesses of these pellets were in
the range 0.613 to 1.04 in gm /cm2.
III. EXPERIMENTAL SETUP FOR ELEMENTAL ANALYSIS
The elemental analyses of samples were performed using a method based upon EDXRF technique [5]. The
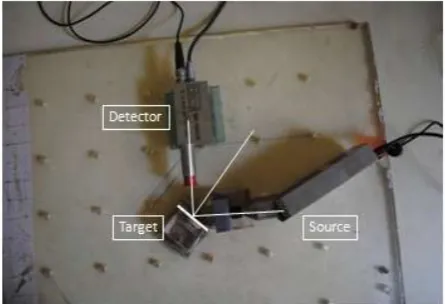
experimental setup used for elemental analysis of samples is shown in Fig. 2(a).
Fig. 2(A): Single Reflection Experimental ArrangementD- Si PIN Detector, S-Source Of Excitation
Miniature X-Ray Tube (With Silver (Ag) Transmission Target And A Beryllium Window) And T-
Targets Under Investigation.
The EDXRF spectrometer consists of
Self-contained miniature X-ray tube with silver (Ag) transmission target and a beryllium window, a portable
controller incorporating the power supply and control electronics. The controller generates all the voltage
needed to operate the X-ray tube and provides both voltage (kV) and current (mA) display and control.
1538 |
P a g e
X-ray detector Model XR-100 CR(purchased from M/s. TENKINS-ELECSYS, LLC, San Diego, USA) TheX-ray detector is ( Model XR-100 CR) high performance thermoelectrically cooled Si-PIN photodiode, with
a preamplifier.
The detector is powered by the PX2 CR power supply. The detector system has a resolution of 150 eV
FWHM, for the 5.9 keV peak of 55Fe. Detector is coupled to MCA8000 A multichannel analyzer for signal
processing and data acquisition.
3.1 Elemental Analysis of Samples
The elemental analysis of the soil samples were carried out by irradiating sample pellets with 22.16 keV Ag K
x-ray in a single reflection geometrical set up (Fig 2(b)).
Figure 2(b): Single reflection Experimental arrangement of Detector, Source and Targets
under investigation.
The method used in present measurements requires the selective excitation of KX-rays of the element under
investigation in
a. Sample target under investigation(i.e in soil samples)
b. Some known compound of element under investigation referred as first standard
c. Sample prepared by mixing known amounts of samples under investigation and first standard referred as
second standard
Thick targets of soil samples, first standard and second standard were irradiated with tube photons in single
reflection geometrical set up.The inetensity of the characteristic X-rays emitted by the elements in soil samples,
first standards and second standards werenoted from their spectra These measured values of intensities are used
in following relation to calculate the amount of element present in the sample.
Each sample pellet was irradiated for 300 seconds at 10 keV and 110 mA. The characteristic x-rays emitted
from the targets were recorded with Si PIN detector. Si PIN spectrometer being used in the present
... (1)1539 |
P a g e
measurements was calibrated using the sources of 55Fe and 241Am . The back ground spectra was also recordedby replacing the sample targets with borax target.
3.2Qualitative Analysis
The qualitative analysis of samples requires the identification of elements present in the sample. It can be
carried out quite conveniently by determing the energies of the fluorescent x-rays emitted by elements present in
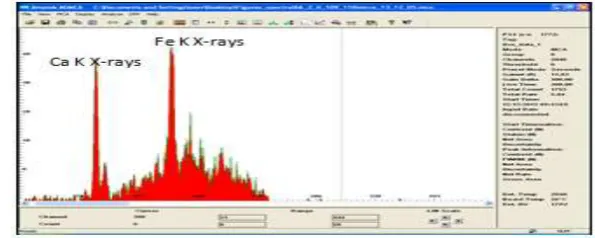
samples. Typical spectra of the radiation emitted from soil samples Sample_1 and Sample_2, as recorded by Si
PIN Detector were shown in Fig 3(a) and 3(b) respectively. In these spectra, peaks were found at those
channels which correspond to the K X-ray energy of calcium and iron. The energies of the peaks appearing in
these spectra also correspond to the L X-ray energies of the elements in the 63≤ Z ≤ 70. To check whether the
peaks observed in spectra correspond to K X-ray energies of iron/calcium or L X-rays energies of the elements
in the range 63≤ Z ≤ 70, the sample pellets were, irradiated with 59.57 keV gamma rays from 241Am . The
resulting spectra were recorded with Si PIN detector and search for K X-ray energies of the elements in the
range 63≤ Z ≤ 70 was made.
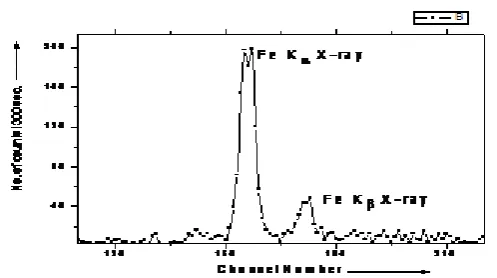
Fig 3(A): Spectrum of The Radiation Emitted When Soil Sample_1 Is Irradiated By Ag K
X-Rays Emitted By MINI-X-Ray Tube As Recorded By Si PIN Detector In Single Reflection
Geometrical Setup
The net spectra for different samples showed no peaks in the K X-rays energy region of elements 63≤ Z ≤ 70.
This rules out the possibility of the presence of L X-rays of the elements with 63≤ Z ≤ 70 in the energy range
1—7 keV.
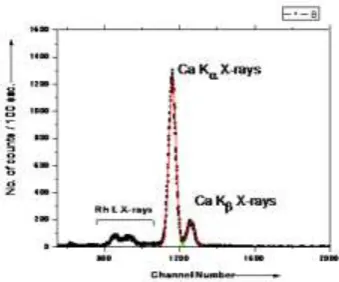
Fig 3(b): Spectrum of the radiation emitted when soil sample_2 is irradiated by Ag K -rays emitted by
MINI-X-ray tube as recorded by Si PIN detector in single reflection geometrical set up
Thus the peaks observed in spectrum correspond to K X-rays energies of calcium and Iron. So, all these
1540 |
P a g e
3.3 Quantitative Analysis
To determine the amounts of iron/calcium in different samples, selective excitation of K X-rays of iron/calcium
in samples and its two standards was carried out in single reflection geometrical set up.
3.3.1 Estimation of Iron
For iron determination the pellets of Fe2O3 were chosen as first standards and known mixtures of sample and
Fe2O3 were used as second standards. The weights of the 1st standard materials to be mixed with the sample was
estimated from comparison of intensities of characteristics X-rays in the spectra of sample and 1st standard, so
that the intensity of the emitted X-rays from 2nd standard pellet increases considerably. The sample pellets and
their two standards were irradiated with tube photons. As the K edge of iron is 7.1 KeV, hence for selective
excitation of Fe K rays in samples, first standard and second standard the voltage and current of MINI
X-tube was kept 10Kv and 110A. The resulting spectra of K X-rays were recorded. The recorded spectra also
show background. The background spectra with borax were also recorded by irradiating the targets of borax
with Ag K X-rays from X-ray tube. The background spectra of borax were subtracted from the spectra of soil
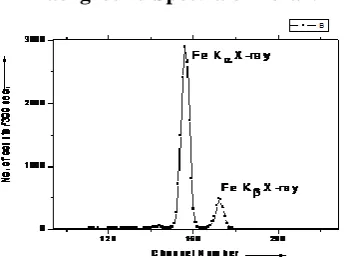
samples, first standards and second standards. Typical net spectra of K-X-rays after subtracting the background
from soil sample_2, its first standard and second standards, sample_2d Sample_3,are shown in Fig. 4(a-e) . The
counts under Fe K, K peaks in samples under investigation, their first standards second standards were
calculated and used in the relation (1) to determine the concentration of Fe in soil samples. The determined
amounts of Fe in soil samples taken from the vicinity and at a distance 1 to 1.5 km were tabulated in Tables 1 &
2 respectively.
Fig 4(A): Net Spectrum of The Fluorescent KX-Rays From Sample_2 After Subtracting The
Background Spectra of Borax.
Fig 4(B): Net Spectrum of The Fluorescent K X-Rays Emitted, When Sample of Fe
2O
3(First
Standard For Iron Determination) Is Irradiated With X-Ray Tube (10 Kv & 10microampere)
1541 |
P a g e
Fig 4(C): Net Spectrum of The Fluorescent K X-Rays From Sample_2+Fe
2O
3After Subtracting
The Background Spectra of Borax.
Fig 4(D): Net Spectrum of The Fluorescent K X-Rays From Sample_2D After Subtracting The
Background Spectra of Borax.
Fig. 4(E): Net Spectrum of The Fluorescent K X-Rays From Sample_3 After Subtracting The
Background Spectra of Borax.
3.3.2 Estimation of Calcium
The pellets of CaCO3 were chosen as first standard for calcium determination and known mixtures of sample &
CaCO3 were used as second standards. In order to determine the amount of Calcium in the presence of Iron, the
present method requires selective excitation of Ca K X-rays. The selective excitation of Ca K X-rays can be
carried out by keeping the voltage of Mini X-ray tube at about 5V (close to K-edge of Calcium). But the
thresh-hold operating voltage of Mini X-ray tube is 10 kV, below 10 kV it does not function. Therefore the
determination of Calcium was carried out using Rh K X-rays by keeping the voltage and current at 5kV and
1542 |
P a g e
determine the amount of Calcium, the sample pellets and their two standards were irradiated with Rh K X-raysfrom low power Neptune X-ray tube of Oxford instruments, USA with cooling based Rh target as anode and
2mA / 50 kV. The resulting spectra of K X-rays were recorded with solid state PIN detector (APTEK, USA).
The K X-rays spectra for the first and second standard were also taken in the same way by irradiating the targets
of first standards and second standards to Rh K X-rays from X-ray tube The recorded spectra also show
background. The background was also recorded with borax. The net spectra of the emitted X-rays from the
samples, sample_2, first standard and second standards after subtracting background spectrum recorded with
borax are shown in Fig. 5(a-c). The counts under Ca K and K peaks in samples under investigation, their first
standards and second
standards were
calculated. These counts are used in relation (1) to find the amount ofCa present in samples.
Fig 5(A): Net Spectrum of The Fluorescent KX-Rays From Sample_2 After Subtracting The
Background Spectra of Borax
.
Fig 5(B): Netspectrum of The Fluorescent K X-Rays Emitted, When Sample of Caco
3Is
Irradiated With X-Ray Tube (5V & 0.2ma) Recorded With Solid State PIN Detector.
Fig 5(C): Net Spectrum of The Fluorescent K X-Rays From Sample--2+Caco
3after Subtracting
1543 |
P a g e
IV. RESULTS AND DISCUSSION
4.1 Iron (Fe)
The determined values of the Fe concentrations in samples taken from the vicinity of industries and at a
distance of about 1-1.5 Km away from industries are given in Tables (1) and (2). Present study indicates that
Fe is one of the important constituent of soil in Yamuna Nagar region. It is clear from the Tables (1) and (2),
that the concentration of Fe for all samples, was found to vary in the range of 8.96 mg/g to 83.69 mg/g. The
variation of Fe concentration with the different sampling sites is also shown in Figure(6).
Table (1):Mass Concentration (In Mg /G) Of Iron (Fe) In Soil Samples Taken From Close To
The Industries.
Sr. No. Samples Iron (Fe) conc. in mg /g
1. S 1 83.69
2. S 2 33.85
3. S 3 32.11
4. S 4 25.36
5. S 5 26.56
Mean value of Fe concentration= 40.31 mg /g
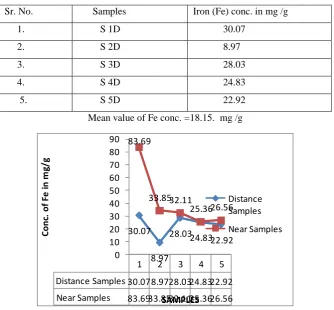
Table (2) :Mass concentration (in mg /g) of iron (Fe) in soil samples taken from distance (1 to 1.5 km
radius) from the main industries.
Sr. No. Samples Iron (Fe) conc. in mg /g
1. S 1D 30.07
2. S 2D 8.97
3. S 3D 28.03
4. S 4D 24.83
5. S 5D 22.92
Mean value of Fe conc. =18.15. mg /g
1 2 3 4 5
Distance Samples 30.078.9728.0324.8322.92
Near Samples 83.6933.8532.1125.3626.56
30.07 8.97 28.0324.8322.92 83.69 33.8532.11 25.3626.56 0 10 20 30 40 50 60 70 80 90 C onc . of Fe in m g/ g SAMPLES Distance Samples Near Samples
Fig 6: Comparison of Fe Concentration For Samples Taken From Vicinity & Away From
1544 |
P a g e
Max. Permissible conc. of iron (Fe) according to CCME 1999 =38.00 mg/g [11]It is observed from Tables (1) and (2) and Fig. 6:
1.The soil samples, sample_1 and sample_1D show the highest value of iron content. The concentration of Iron
decreases from sample_1,to sample_5. The same trend is also observed for the samples collected from the
sites which are at distance of 1 to 1.5 Km away from industries.
2.The measured values of Iron concentrations in different samples were found to be well within the range of
recommended value which is 38 mg /g (as recommended by CCME 1999) [11] except for sample_1. The
concentration of Iron found in sample_1 is 83.69 mg/g which is higher than the recommended value 38 mg/g.
The concentration of iron in soil sample collected from a distance of 1km i.e. sample_1D, is 30.07 mg/g
which is below the threshold value.
3.The concentration of Iron decreases as the distance from the industries increases. The average concentration
of iron for samples taken at a distance from the industries is 18.15 mg/g and comparatively lower as compared
to the average concentration of iron 40.31mg/gm for samples close to industries.
4.Also it has been found from figure(6) that the values of Iron concentration in samples (Sample_4, Sample_5
and Sample_4D, Sample_5D) close to each other.
Observation (1) i.e Sample_1 has the maximum values of iron content, can be attributed to the fact that
sampling site_1 is a large scale metal industry and it is near Rampura industrial area. It manufactures heavy
spare parts, pipes and makes use of iron as major raw material. Thus, the industrial activity has effect on the
concentration of iron on soil in the vicinity of industry.
Observation (2) i.e. highest concentration of iron in sample_1 more than the recommended value indicates the
soil in the vicinity of metal industry is contaminated with iron. The determined amounts of Fe in the soil
samples taken from sampling site_2,_3,_4,_5 are well in the range of recommended value, thereby indicating
that soil near these industries is not so polluted.
Observation (3) i.e. smaller values of Iron content away from the industries indicate that effect of industrial
activity on the concentration of element present in soil decreases as the distance from the industries increases.
The studies carried by Antoaneta et al [10] also indicate the similar results that heavy metals are present in
greater concentration in the vicinity of industrial region as compared to their concentration in soil at a distance
away from the industries. The larger values of Iron content close to industries indicate that industrial activity
certainly has some effect on the concentration of element present in soil in the vicinity of industries.
The sampling site_4 and sampling site_5 are close to each other Figure(1) that is why measured iron contents
in Sample-4, Sample-5 and Sample-4D, Sample-5D do not show much variation Fig. 6.
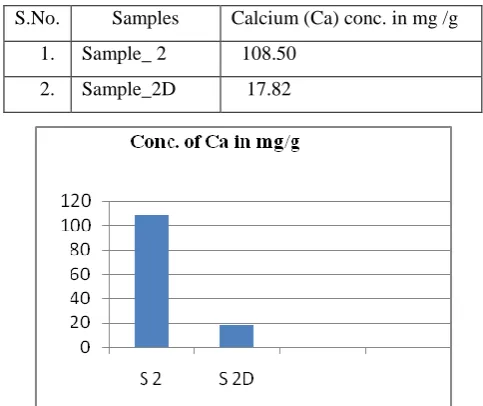
4.2 Calcium (Ca)
The present study shows that Calcium (Ca) (in measurable concentrations) was present in two soil samples with
Sample-2 and Sample-2D. The values of Calcium are found to be108.500 mg/g and 17.820 mg/g respectively,
given in table (3) and Fig. 7. The sampling site-2 from where these soil samples are collected was a small scale
wine industry. The raw material used in this industry was fruit e. g. grapes.
The greater amounts of Calcium in sample-2 indicate industrial activity has also some influence on the soil in
1545 |
P a g e
decreases with distance. The results indicate that concentration of element decreases with increase in distancefrom the industry (10).
Table (3):Mass Concentration (In Mg /G) of (Ca) In Soil Samples
Figure (7): Comparison of Ca Concentrations for Samples Taken From Vicinity & Away From
Industries
V. CONCLUSIONS
Iron and Calcium are most essential minerals that are required for human and plants life for their growth. Small
amounts of these elements are necessary for good health, but higher concentrations (more than recommended
values) may cause chronic toxicity and disturb the biological balance of organisms in soil. The determined
amounts of Iron in the soil samples in the vicinity of industries are greater than those for soil samples taken at a
distance away from industries.The determined amounts of Iron in the soil samples in the industrial complexes
of Yamuna Nagar are well within the range of recommended values except for one site (Sampling location for
sample-1).The determined amounts of Calcium in the soil sample collected from sampling site -2 in the vicinity
of industry are greater than those for soil sample taken at a distance away from industries.
Thus conclusions drawn from the present study are:
The determined amounts of Iron in the soil samples in the vicinity of industries are greater than those for soil
samples taken at a distance away from industries.
The determined amounts of Iron in the soil samples taken at a distance away from industries of Yamuna
Nagar are well within the range of recommended values except for one site (Sampling location for sample-1).
The determined amounts of Calcium in the soil sample collected from sampling site -2 in the vicinity of
industry are greater than those for soil sample taken at a distance away from industries.
The greater values of Fe/Ca contents in the soil samples in the vicinity of industries implies that industrial
activities in Industrial region of Yamuna Nagar, do have certain effect on the soil nearby region. However,
this effect decreases with increasing distance from the industries.
Thus the present investigations indicate that soil in the vicinity of metal industry (sampling site-1) is polluted
with iron and also soil in the vicinity of wine industry (sampling site-2) shows more value of calcium
.However the soil from the regions at a distance 1-1.5 Km. away from the industries is not contaminated. S.No. Samples Calcium (Ca) conc. in mg /g
1. Sample_ 2 108.50
1546 |
P a g e
VI. ACKNOWLEDGEMENTS
The authors are grateful to Dr. Raj Mittal Singla , Professor Punjabi University Patiala for allowing to use the
experimental facilities at Nuclear Science Laboratory, Department of Physics, Punjabi University Patiala.
REFRENCES
[1] Mihaela Ulmanu, Ildiko Anger, Eugenia Gamenţ, M. Mihalache, Georgiana
Plopeanu, L. Ilie, Rapid determination of some heavy metals in soil using an X-ray fluorescence portable
instrument, Research Journal of Agricultural Science, 43 (3) ( 2011)235.
[2] Tripathi, D. R. Misra, A study of physico-chemical properties and heavy metals in contaminated soils of
municipal waste dumpsites at Allahabad, India, International journal of environmental sciences 2, (2012).
[3] Koranteng Addo , Owusu Ansah, L.K. Boamponsem, J. K Bentumand J. K S. Arthur, Levels of zinc,
copper, iron and manganese in soils of abandoned mine pits around the Tarkwa gold mining area of Ghana,
Advances in Applied Science Research, 2 (1), (2011): 280-288.
[4] A. Ene, A. Bosneaga, L. Georgescu, Determination of heavy metals in soils using XRF technique
Rom. Journ. Phys. 55 (2010) 815-820.
[5] Vandana and Raj Mittal, Effect of calcium and potassium fertilizers on calcium and potassium contents of
rice saplings, Ecol. Env. & Cons. 5(4) (1999) 373-380.
[6] Kanan Deep, Preeti Rao, Himani Bansal, Raj Mittal, Matrix effects for calcium and potassium K-X-rays, in
fenugreek plants grown in iron rich soils, Appl. Radiation& Isotopes, 90C (2014) 109-116.B.
[7] Kanan Deep, Raj Mittal, Macronutrient k variation in mung bean sprouts with lunar phases, European
Scientific Journal 10(9) (2014) 295-306.
[8] Michael Mantier, Manfred Schreine, X-ray fluorescence spectrometry in art and archaeology, X-Ray
Specrom. 29 (2000) 3-17.
[9] Antoaneta Ene, Alina Bosneaga, L. Georgescu, Determination of heavy metals in soils using XRF
technique, Rom. Journ. Phys, 55 (2010) 815-820.
[10]Antoaneta Ene, Ana Pantelica, Carmofreitas, Alina Bosneaga, EDXRF and INAA Analysis of soils in the
vicinity of a metallurgical plant, Rom. Journ. Phys, 56 (2011) 993-1000.
[11]Vandana Partha,N.N.Murthy and Parveen Raj Sexena, Assessment of heavy metal contamination in soil
around hazardous waste disposal sites in Hyderabad city (India): natural and anthropogenic implications, E3
Journal of Environment and Management 2(2) (2011) 027-034.