Page | 308
CONTENT BASED IMAGE RETRIEVAL USING COLOR
AND TEXTURE FEATURE
Vanitha R
1, Premananda R
2 1Assistant Professor, Department of Electronics & Communication Engineering, Bapuji Institute of
Engineering and Technology, Davangere, Karnataka, India
2
Assistant Professor, Department of Electronics & Communication Engineering, Government
Engineering College, Haveri,, Karnataka, India
ABSTRACT
The content based image retrieval using color and texture featureis aninteresting concept in the color based image
retrieval. The color descriptor combines the compactness of Dominant Color Descriptor (DCD) and the accuracy of
Color Structure Descriptor (CSD) which enhance the retrieval performance in a highly efficient manner. The
feature extraction and similarity measures the descriptor and are designed to address the problems of the existing
descriptors such as color inaccuracy of DCD and redundancy of CSD. Texture feature of Edge Histogram
Descriptor (EHD) can be efficiently utilized for image matching. In order to increase the matching performance of
global, semi- global and local histogram, two images are compared to evaluate the similarity measure. The
algorithm is tested for color images such as butterfly, satellite, flower, waterfalls and extra images with total 450
database images.
Keywords—
HMMD Color Space,Color Histogram, Fuzzycmeansclustering,Edge Histogram &EqulideanDistance
I. INTRODUCTION
1.1Content Based Image Retrieval
Content-Based Image Retrieval (CBIR), also known as Query By Image Content (QBIC) or Content-Based Visual Information Retrieval (CBVIR) is the application of computer vision to the image retrieval problem, that is, the problem of searching for digital images in largedatabases. Content based means that the search will analyze the actual contents of the image. The term 'content' in this context might refer colors, shapes, textures, or any other information that can be derived from the image itself. Without the ability to examine image content, searches must rely on metadata such as captions or keywords. Such metadata mustbe generated by a human and stored alongside each image in the database.
Content Based Image Retrieval is an application for retrieving the images from a hugeset of image databases based on the image features such as color, texture and some otherattributes. Here we take image feature as the index to that image and retrieve that particularimage. The surrounding world is composed of images. Humans are using their eyes obtainingimages from the surrounding world in the visible portion of the electromagnetic spectrum(wavelengths between 400 and 700 nanometers).
Page | 309
the computer screen can display 28 or 256 differentshades of gray. For color images this makes 2 (3x8) = 16,777,216 different colors. The RGB image could be presented as a triple(R, G, B) where usually R, G,and B take values in the range [0, 255]. It is the base for the color television standard. Imagesare presented in computers as a matrix of pixels. They have finite area. If we decrease thepixel dimension the pixel brightness will become close to the real brightness.
1.2 objectives
The main objective of this work is to develop a technique to detect the contents ofthe image based on color features, texture features. It gives similar images of the queryimage.
Objectives are:
Retrieve images that are similar to query image from a large database.
We use content- based search, for high accuracy multiple features like color, texture isincorporated.
Color feature extraction are used in two features CSD(Color Structure Descriptor) and DCD(Dominant Color
Descriptor) is done through “Global Color Histogram (GCH)”and Texture feature extraction are used in EHD(Edge Histogram Descriptor) is done through “Global and Local Color Histogram (GCH &LCH)”.
II. SYSTEM DESIGN AND IMPLEMENTATION
Content Based Image Retrieval is the retrieval of images based on visual features such as colour, texture and shape. In CBIR, each image that is stored in the database has its features extracted and compared to the features of the query image. It involves two steps:
Feature Extraction: The first step in the process is extracting image features to a distinguishable extent.
Matching: The second step involves matching these features to yield a result that is visually similar.
2.1 BLOCK DIAGRAM OF SYSTEM
Below figure shows the block diagram of content based image retrieval using color and texture features. The process of retrieving desired images from a large collection on the basis feature (such as color and texture) that can be automatically extracted from the image themselves. The features used for retrieval can be either primitive or semantic, but the extraction process must be predominantly automatic.
Fig2.1: Block Diagram of CBIR System
The block diagram as shown in Figureidentifies the CBIR use cases:
Query by Image: The query image of JPEG format instead of query by text etc.
Page | 310
Database Images: It contains a large list of images with which the query image is compared to extractrelated images.
Feature Extraction of query image: The features of the query image are extracted and stored in the
temporal storage.
Feature Extraction of database images: The features of the database images are extracted and stored in the
temporal storage
Similarity Measurements: The task of comparing the query image features with the database images
individually and the matched result is obtained.
Retrieve Images: The images related to query image in serial form.
Creating database
CBIR database contains 450 images collected. The database images of size 85×128 or 128×85 in dimension, which means each has a total pixel size of 10880 if we place them in a single array row.
The local database has some categories - butterfly images, flower images, waterfalls images, food images, satellite images. The images are in jpg format.
2.2 Feature Extraction
Feature extraction is the process of measuring or calculating the features from the image samples such that which are sufficient to distinguish between one type of image from another type. Feature extraction is to obtain color features and texture features to retrieve similar images. Color features are CSD and DCD used. Texture feature are EHD is used.
2.2.1 Color Features
A. Color Structure Descriptor
Color structure descriptor [1] is based on color histogram, but aims at providing a more accurate description by identifying localized color distributions of each color. CSD is identifying localized color distribution using a small structuring window. To guarantee inter-operability, the Color Structure Descriptor is bound to the HMMD color space. CSD is characterized by a color structure histogram for M quantized color, cm, and is
expressed as
h(m), m = 1 to M
Where M belongs {128, 32} and the bin value h(m) is the number of structuring elements containing one or more pixels with color cm.Unlike the conventional histogram, the color structure histogram is extracted from an image by
Page | 311
structuring element. With the structuring element scanning the image, the color histogram bins are accumulated according to
h (m)←h(m) +1, m →S
Thus, the final value of h (m) is determined by the number of positions at which the structuring element contains cm.
Similarity matching: A Euclidean (pair wise) distance measure is used to compute the dissimilarity between CSDs. CSD provides more accurate similarity retrieval because of the inclusion of spatial color information. This representation is more closely related to the human perception and, thus, is more useful for indexing and retrieval. Although the color structure histogram contributes to the high retrieval accuracy of CSD, the fixed color space requirement of the histogram results in redundancy in the representation.
Algorithm
step1: First conversion of RGB to HMMD color space must be selected.
Step2: Color space quantization will be done.
Step3: Extraction Of the color features.
Step4: The calculation of the distance between two CSD is done to get similar images.
B. Dominant Color Descriptor
The DCD [1] provides a compact description of the representative colors in an image or image region. The main target application of similarity retrieval in large image database, dominant color descriptor extracts the features from an image by clustering the colors in an image into a small number of Colors and is defined as
F= {(ci. pi, vi), s}. (i=1… N)
The descriptor consists of the representative colors ci, their percentages pi, the optional color variances for each
dominant color vi, and the optional spatial coherency s of the dominant colors. The distance D2 (F1, F2) between
the two descriptor can be computed as:
D2 (F1, F2) = 1i2+ 2j2- i,jp1i, p2j
ai,j= <Td >Td
where F1 = {{c1i, p1i}, i= 1,..., N1} and F2 ={{c2i , p2i}, i=1,...,N2} are two DCD descriptors with N1 and N2
dominant colors, respectively. The dominant color and its percentage value are denoted by ciand pi. The sum of
percentages is normalized to 1. The similarity coefficient, ai,j, is used to take into account the closeness between the
two dominant colors c1i and c2j. Tdis a threshold for determining the similarity between two colors and α is used for
adjusting the importance of color distance. With this simple and compact representation, DCD allows efficient indexing for similarity retrieval while sacrificing retrieval accuracy due to lack of spatial information of the description.
Algorithm
Page | 312
Step2: Clustering method will be done
Step3: Extract the dominant color features
Step4: The calculation of the distance between two DCD is done to get similar images.
2.2.2 Texture Feature (Edge Histogram Descriptor)
The edge histogram descriptor [2] captures the spatial distribution of edges. The distribution of edges is a good texture signature that is useful for image to image matching even when the underlying texture is not homogeneous. The computation of this descriptor is fairly straightforward. A given image is first sub-divided 4×4into sub-images, and local edge histograms for each of these sub-images is computed.
To compute the edge histograms, each of the 16 sub-images is further subdivided into image blocks. The size of these image blocks scale with the image size and is assumed to be a power of 2. The number of image blocks per sub-image is kept constant, independent of the original image dimensions, by scaling their size appropriately. A simple edge detector is then applied to each of the macro-block, treating the macro-block as a 2×2pixel image. The pixel intensities for the2×2 partitions of the image block are computed by averaging the intensity values of the corresponding pixels. The edge-detector operators include four directional selective detectors and one isotropic operator (Fig.). Those image blocks whose edge strengths exceed a certain minimum threshold are used in computing the histogram.
Fig3.2: filters for edge detection
Five edge strengths for the image block ( i,j) as follows.
Ver_egde_stg( i , j) = (1)
hor_egde_stg( i , j) = (2)
dia45_egde_stg ( i , j)= (3)
dia135_egde_stg ( i , j)= (4)
nond_egde_stg( i , j)= (5)
If the maximum value among five edge strengths obtained from equations (1) to (5) is greater than a threshold (Thedge) as in equation (6), then the image-block is considered to have the corresponding edge in it.
max{ver_edge_stg(i,j),hor_edge_stg(i,j),dia45_edge_stg(i,j),dia135_edge_stg(i,j),
Page | 313
Similarity Matching: Note that there are a total of 80 bins, 3 bits/bin, in the edge histogram. One can use the 3-bit number as an integer value directly and compute the distance between two edge histograms. An interesting variation is to compute an extended histogram from these 80 bins.The extended histogram is obtained by grouping the image blocks (and the corresponding bins). The extended bins are referred to as the global and semi-global histograms. The global histogram is obtained by combining all the 16 image blocks. The semi-global histograms are computed by pooling the image blocks/bins by rows (four rows), columns (four columns) and in groups of (five groups). This results in five bins for the global histogram and for the semi global histograms from the 80 local histogram bins. The total number of bins is 150.The edge histogram descriptor is found to be quite effective for representing natural images with the primary application being image-to-image matching.
III. RESULTS
CBIR Using color and Texture features are as follows: Color features are CSD and DCD used. Texture feature are EHD is used. The Fig. 4.1 shows the snapshot of the GUI designed for the output of the project using the MATLAB 7.12. Database [14] contains 450 collected images. The database images of size 85×128 or 128×85 in jpg format. Fig 3.1: shows snapshot of the Query image (flower). Fig3.2: shows snapshot of the retrieved similar images.
Fig 3.1: Snapshot of the Query image (flower)
Fig 3.2: Retrieved Similar Images
Page | 314
The database contains 450 images with different classes such as butterflies, flowers, satellite, food and waterfalls images. Feature of Query image is extracted and tested against features of database images.
The corresponding results are shown in Fig 3.2. Fig3.3: shows the Performance analysis of CBIR using Color Features of Query image and corresponding retrieved similar images. Fig 3.4: shows the Performance analysis of CBIR using Color and texture features of Query image and corresponding retrieved similar images. Table I indicates the performance of CBIR using color features retrieves 40%-75 %( i.e. the average of 57.5%) accuracy. Table II indicates the performance of CBIR using color and texture features retrieves 65%-98% (i.e. the average of 81.5%) accuracy. Table III indicates the comparison of performance analysis of various images.
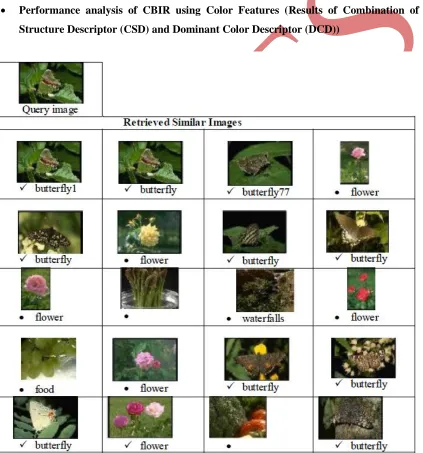
Performance analysis of CBIR using Color Features (Results of Combination of Color
Structure Descriptor (CSD) and Dominant Color Descriptor (DCD))
Fig 3.3: Performance analysis of CBIR using Color Features (CSD&DCD)
Page | 315
Retrieve Relevant Images =10Performance Results= (Retrieve Relevant Images/ Total images) or Performance Results = (10/20) = 0.5 =50%
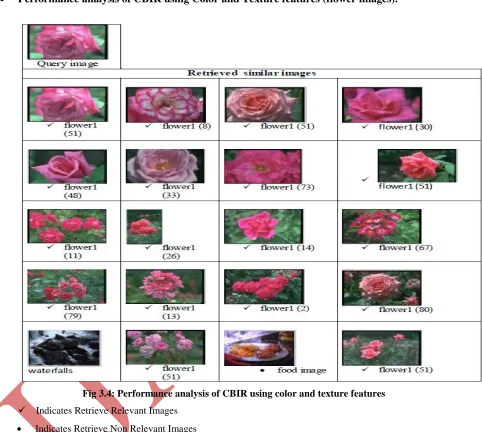
Performance analysis of CBIR using Color and Texture features (flower images).
Fig 3.4: Performance analysis of CBIR using color and texture features
Indicates Retrieve Relevant Images
Indicates Retrieve Non Relevant Images
Page | 317
Fig 3.7: Comparison of performance analysis bar chart (i). Color features and (ii) color and texture features
IV. CONCLUSIONS
The color features using color descriptors include two histogram-based descriptors, The Color Structure Descriptor (CSD), the Dominant Color Descriptor (DSD). The histogram descriptors capture the global distribution of color where as the dominant color descriptor represents the dominant Color present. An efficient color structure features, dominant color features, for color image representation. The descriptor inherits the compactness of Dominant Color Descriptor (DCD) and the retrieval accuracy of Color Structure Descriptor (CSD).
The texture features using texture descriptor include the Edge Histogram Descriptor (EHD). These features can support search and retrieval based on content descriptions. These features provide an overall performance in both speed and accuracy.
REFFERENCES
[1] Ka-man wong, Lai-man Po,and Kwok-waicheung “A compact and efficient Color Descriptor for Image Retrieval” Department of Electronic Engineering, City University of Hong Kong,
[2] Dong Kwon Park, Yoon SeokJeon and Chee Sun Won “Efficient Use of Local Edge Histogram Descriptor” Dep. of Electronic Engineering, Dongguk Univ.
[3] B.S.Manjunath “Color and Texture Descriptors” B. S. Manjunath, Member, IEEE, Jens- Rainer Ohm, Member,
Page | 318
[4] United states Patent. Patent no:US 7,180,634,B2 “Color quantization and method thereof and searching method using the same”
[5] Murthy V.S.V.S1, E.Vamsidhar1, P. Sankara Rao2 and G.SamuelVaraprasadRaju “Application ofthe
Hierarchical and K-Means Techniques in Content Based Image Retrieval” International Journal of Engineering Science and TechnologyVol. 2(3), 2010, 209-212
[6] Rahul Mehta, Nishchol Mishra and Sanjeev Sharma “Color-Texture based Image Retrieval system
[7] John Eakins, Margaret Graham, “content based image Retrieval” JISC technology application programme. October 1999
[8] Text Book BhabatoshChanda, Dwijesh Dutta Manjumder“Digital image processing and analysis” [9] Text Book Rafel C. Gonzalez,Richarad E. Woods, “Digital image processing using matlab” [10] Text Book Rafel C. Gonzalez ,Richarad E. Woods, “Digital image processing”
[11] Text Book Timothy J.Ross (text book) “Fuzzy Logic With Engineering Application. [12] Text Book Earl Gaose. Richard Johnsonbaugh “Pattern Recognition and Analysis”
[13] Thesis of “Feature Selection for CBIR Using Statistical Discriminant Analysis” Master of Science (Computer
Science)