Volume-6 Issue-2
International Journal of Intellectual Advancements
and Research in Engineering Computations
Multimodel Document Summarization K-SVM
Algorithm
1
P. Agalya,
2T. E. Ramya,
3R. Vishnu raaj,
4Mr. P. Manimaran
1-3UG Student, Department of Computer Science and Engineering,
K.S.Rangasamy College of Technology, Tiruchengode 1
Assistant Professor, Department of Computer Science and Engineering, K.S.Rangasamy College of Technology, Tiruchengode
Email id: [email protected], [email protected], [email protected]
A
bstractThe fully integrated text mining system is designed to support the complex and highly literature-dependent task of mining datasets assessment. The task is critical because IT Keywords play an important role in everyday life and their potential risk to technical results must be evaluated. With thousands of IT Keywords introduced every year, many countries worldwide have established increasingly strict laws governing their production and use. The efficient processing of document streams plays an important role in many information filtering systems. Emerging applications, such as news update filtering and social network notifications, demand presenting end-users with the most relevant content to their preferences. The user preferences are indicated by a set of keywords. A central server monitors the document stream and continuously reports to each user the top-k documents that are most relevant to her keywords. The improvement on the effectiveness of using and updating discovered patterns for finding relevant and interesting information. Substantial experiments on K-SVM Mining data collection and TREC topics demonstrate that the proposed solution achieves encouraging performance. The project is to prove an RSS resource lies with the client. These statistics on refresh frequency and volatility illustrate the challenge faced by a proxy in satisfying user needs. As the number of users and servers grow, service personalization through targeted data delivery by a proxy can serve as a solution for better managing system resources. In addition, the use of profiles could lower the load on RSS servers by accessing them only to satisfy a user profile.
Index Terms: Top-k document, Continuous query, Machine learning, User click movement pattern, Document stream, Reverse index ordering.
I. INTRODUCTION
The efficient processing of document streams plays an important role in many information filtering system. For the emerging applications like update filtering and social network notifications demands end-users with the most relevant content to their preferences. The user preferences are indicated by the set of keywords. A central server monitors the document stream and continuously reports to each user the top-k documents that are most relevant to their keywords.
The summarization of document streams supports large number of users and high stream rates while refreshing the top-k results almost instantaneously. The continuous top-k queries on documents (CTQDs) [12], [13], [14], a topic which has received a lot of attention recently. The central server monitors a document stream and hosts CTQDs from various users. Each CTQD specifies a set of keywords, as explicitly given by the [15],[16] issuing user or extracted from her online behaviour. The task of the server is to continuously refresh for every CTQD the top-k most relevant documents to the keywords, as new documents stream in and old ones become too stale to be of interest.
These systems either work in a semi-offline manner by delivering periodic updates or allow for coarse filtering only that is based on general topics, rather than sets of specific keywords. Another application domain for CTQDs [17], [18] are microblog real-time search services. Currently, these services allow the user to query (in an on-demand, one-off way) for posts that match a set of keywords. CTQDs could extend the functionality of these services by offering continuous monitoring /notifications about new posts that match the keywords. In traditional text search, there are snapshot top-k queries over static document collections. The inverted file is the standard index [19] to organize documents. It comprises a list for every term
in the dictionary; the list for a term holds an entry for each document that contains the term. By sorting the lists in decreasing term frequency, and with appropriate use of thresholding, a snapshot query can be answered by processing only the top parts of the relevant lists. Due to the said sorting, we refer to that paradigm as frequency-ordering. This common practice for snapshot queries has been followed by most approaches for continuous top-k search.
II. RELATED WORKS
Several research works has been carried out for clustering documents [2],[4] in large databases. Class identification in spatial databases are efficiently done with clustering algorithms. The papers would have involved with the DBSCAN algorithm for clustering the documents. The DBSCAN algorithm requires only one input parameter and helps the user in determining the actual value for it. Arbitrary shaped clustering is provided by this algorithm. For large spatial database DBSCAN algorithm are efficiently used for clustering the document. DBSCAN discovers all clusters and detects the noise points from all sample database. The main aim of this work is to demonstrate that DBSCAN is significantly more efficient in discovering clusters of arbitrary shape than well-known algorithms. DBSCAN outperforms by a factor of more than 100 in terms of efficiency.
In [1] Density-based spatial clustering Algorithm provides DBSCAN, which gives extremely good results in clustering for many datasets efficiently, if a dataset has a clusters of widely densities, DBSCAN is not able to efficiently handle it. If non-spatial attributes is used for clustering DBSCAN is not appropriate, because it is not consider non-spatial attributes in the dataset. DBRS aims to reduce the running time for dataset with various densities. DBRS can also deal with non-spatial attributes, by purity threshold, when finding the matching neighbour-hood.
Data mining refers to extracting useful information vast amount of data. It is the process of discovering interesting knowledge from a large amount of data stored either in database, data warehouses, or other information repositories. Clustering is important in data analysis and data mining applications. Clustering can be done by the different no. of algorithms such as hierarchical, partitioning, grid and density based algorithms. Hierarchical clustering is the connectivity based clustering. Partitioning is the centroid based clustering; the value of k-mean is set. Density based clusters are defined as area of higher density then the remaining of the data set. Grid based clustering is the fastest processing time that typically depends on the size of the grid instead of the data. The grid based methods use the single uniform grid mesh [7] to partition the entire problem domain into cells is revealed in work.
Finding maximal co-located events sets which concisely represent all co-location patterns. A preprocessor is used to convert input spatial data to sets of neighborhood transactions, [3] reduce examined
candidates and traverses the maximal search space in a depth-first manner with effective pruning mechanism.
In [10] the fuzzy set theory has been advanced to a powerful mathematical theory. In combination with classical approaches it has been applied in practice in various disciplines such as control, data processing, decision support, engineering, management, logistics, medicine and other. The work in Fuzzy C-means Clustering Algorithm Based on Cluster Density [11], the conventional fuzzy c-means clustering is suitable for the hyper-spherical clusters, an improved clustering approach based on cluster density (FCM-CD). FCM-CD has a good tolerance to different densities and various cluster shapes. FCM-CD shows a higher performance in clustering accuracy.
Join-index is a data structure used for processing join queries in databases. The I/O cost of join computation using a join-index with limited buffer space depends primarily on the page-access sequence used to fetch the pages of the base relation is revealed in the work [5]. In the work [6], the complexity in clustering a new approach for assigning rank value to each categorical attribute using K-means can be used in which categorical data is first converted into numeric by assigning rank. K-mean algorithm is better than Hierarchical Clustering Algorithm. OPTICS, DBSCAN are designed to find clusters of arbitrary shape.
The six different types of clustering techniques: K-means Clustering, Hierarchical Clustering, DBSCAN Clustering, Density Based Clustering, Optics, EM Algorithm [8] in which all these techniques are used to partition a data set into several groups are done with the work.
In the work of Improving DBSCAN Clustering method using fuzzy set theory [9], the detail about clustering the information from a dataset is furnished. Clustering is not only a boundary of grouping of same kind of objects in cluster, it would also be like to get or retrieve specific data by analysing clustering approach. This work focuses on current clustering techniques of data categorizing and retrieving as faster as possible from huge amount of data. Clustering and Classifying data is mostly applicable for science and technology in which data manipulation is required. As the clustering and classification of data in a dataset can be done by selecting a appropriate algorithm.
III. EXISTING SYSTEM
K-means is a very simple algorithm based on similarity. The measure of similarity plays an important role in the process of clustering. The similar points are assigned to a same cluster, and the dissimilar ones in different cluster. We usually use Euclidean Distance to measure the similarity between two data points.
The different metric method of similarity will not change the result, but the result of K-means is more sensitive to the initial centroids. The two factors are: the one is the value of K, and another is the initial selection of centroids. It implements the iterative technique. This process will not stop until the mean value of all the clusters not change. That is to say, the grouping is done by minimizing the sum of squared distances between the objects and the corresponding centroids.
In K-means algorithm, the choosing of initial center is the key to get precise result. If choosing the proper initial centroids will get a good result, but if it is not, the result will get worse, it may make a large and low density cluster divided into pieces, or merge two close clusters into a one group, etc. So we usually choose the initial centroids randomly, or use the prior knowledge to label some of them to achieve a good result.
The K-means will iterates between two steps until converge. The first step is assign each point to the closet cluster based Eucliean distance. The second step is updating the mean value of cluster or the cluster centroid. Note that each iteration needs N K× comparison, N is the number of the dataset, and K is the number of clusters that we desired to get.
K-means needs only one parameter that denoting the number of clusters. This illustrates that it is simple and effectively. It is a most common algorithm using an iterative refinement technique. Given a dataset of n-dimensional vectors, D= {x |i=1,2,...,N} where xi∈ Rn is the ith data point. Each point falls in one and only one partition, and it belongs to the nearest cluster. The algorithm is deemed to have converged when the state of assignments process keeps no change. As it is a heuristic algorithm, there is no guarantee that it will converge to the global optimum, and the result may depend on the initial clusters. As the result of K-means algorithm is uncertain, we usually run it multiple times, and cluster result is determined through vote mechanism. The steps of this algorithm are described as follows.
1. At the beginning we randomly choose K points in the database as the initial cluster centre.
2. Repeat
3. Each object is assigned to the most similar cluster based on the mean value of the objects in a cluster.
4. Update the mean value of a cluster
5. Until the mean values of clusters not change.
IV.PROPOSED SYSTEM
The goal of our algorithm is to shift the important samples to find the most important samples with massive information. The definition of Support Vectors (SVs), is commonly the boundary points
between clusters. However, the boundary points are easy to be misclassified in clustering. Inspired by this problem, our algorithm uses the clustering approach to select boundary points which are more likely to be SVs. Cluster assumption is our theoretical basis of selecting the most informative samples, it can be described as: if the distance between two samples is relatively close, then the samples are apt to have the same classification label. In other words, the intra-cluster distance is smaller than inter-intra-cluster distance. So the decision hyperplane between clusters should be located at the sparse region. In the premise of Cluster assumption, the learning algorithm could analyse the data distribution in feature space and tune the location of the decision boundary.
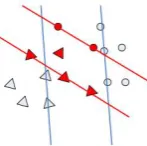
In order to find the decision boundary, we can search the points on or close to the boundary of clusters. The locations of these points determine the decision boundary. The points are difficult to be labelled, if the distance of one of them to the opposite cluster is close enough, and it is more easily to be misclassified in clustering process. For the binary classification problem the blue lines are the boundary hyperplanes of the maximal margin which we are going to find. They are determined by the six black points and they are located near or on the boundaries of two clusters, respectively. the goal of our algorithm is to select a small set which contains the six black points. So our approach aims to use the clustering algorithm to select the misclassified points and according to the difference of the labels of these samples and their neighbours to select some of them for training. Thus we can reduce the scale of the training set effectively.
Fig 1
The blue lines are the boundary hyperplanes, the margin is maximized, and the black points are the SVs. The black points in Figure 1. is the misclassified ones in the clustering process, we can use the information of them for training and building the prediction model. Suppose that we only consider the position of the misclassified points, it has several situations is shown in Figure 2..
Fig 2 b
Figure 2. is used to show the two situations that may occur. For the Figure 2. (a), it can be seen that the red misclassified points are mixed. If we use the information offered by them, the accuracy of the training model isworse. In order to solve the problem of this situation, these points can be removed from the original dataset, and use the rest to train the SVM model. But this approach is not efficient because the number of the misclassified points is few sometimes; training the rest data has a little significance.
The blue lines are the proper hyperplines, the red ones are the hyperlines built by red misclassified points. We can see that there has a great deviation compared with the original hyperplanes.
In order to solve those problems, we start it from the neighbors of misclassified points. In Figure 3. and Figure 4., the red points are the misclassified ones, and the black ones are their neighbors. We want to choose the neighbors whose true labels are different to the misclassified points that are shown in Figure 3., or the number of the points with the same label is equal to that with the different label which is shown in Figure 4.. We believe that those points have massive information.
Fig 3. the black points are which to be selected
Fig 4. The red misclassified points are the most uncertain ones that are selected.
According to the analysis above, the implementation process of our algorithm can be divided into two steps. In the first step, run the cluster algorithm on the original training set; as a result, each data point will get a cluster label. Then compare the cluster label of a data with its true label, if they are different, there is a reason to doubt that they may locate in the edge region of the two clusters. In the second step, check the labels of its N nearest neighbors; Choose some of them as the candidate training set.
Fig 5
The above figure illustrates the process of choosing the points from the misclassified points.
V. RESULTS AND DISCUSSION
The multimodal document summarization using KSVM-means is found to provide clustering of data streams with use of the entered query as keyword, which in turn provides the classification of clustered data is found to be the efficient access to the document streams.
VI. FUTURE SCOPES
Most importantly, observing about that clustering algorithms indeed tend to induce clusters formed by either relevant or irrelevant dictionary learning, thus contributing to enhance the expert examiner‘s job.
This method in applications shows that it has the potential to speed up the computer inspection process.
Efficient algorithms are given to support basic operations on interval lists, such as union and intersection without decompression.
Extensive experiments that evaluate the performance of K-SVM are conducted. Results show that PLSA not only reduces the index size but also improves the search performance on real datasets.
High performance and NMI indexVII. CONCLUSION
completely new task, not previously seen on the recorded data. K-SVM algorithm improves the search performance and the user experience.
The experiments show that it is possible to infer the interest from user click movements at least in a controlled laboratory experimental setting. One limitation of the experimental results is a small sample size. A larger study would be needed to better evaluate the retrieval performance. The models presented here are built of standard machine learning components, and the user click movements features were harvested from various psychological studies. Presumably, performance improvements could be achieved by tailoring the models and features to the task studied the problem of organizing search results in a user-oriented manner. To attain this goal, the rely on search engine logs to learn interesting aspects from users' perspective. Given a document clustering, retrieval of its related queries from past document clustering history has been done and learning the aspects by clustering the past queries and the associated click-through information, and categorize the search results into the aspects learning.
REFERENCES
[1] Xin Wang and Howard Hamilton J (2005),“ A Comparative Study of Two Density-Based Spatial Clustering Algorithms for Very Large Datasets”, Proceedings of the 18th Canadian Society conference on Advances in Artificial Intelligence, pp. 120-132. [2] Cheng-Fa Tsai and Chun-Yi Sung (2010), “DBSCALE: An Efficient Density-Based Clustering Algorithm for Data Mining in Large Databases”, 2010 Second Pacific-Asia Conference on Circuits, Communications and System (PACCS-2010), pp. 98 – 101.
[3] S and Chawla (2003), “S: Spatial Databases: A Tour, Prentice Hall”. for Discovering Clusters in Large Spatial Databases with Noise”, 2nd International conference on Knowledge Discovery and Data Mining (KDD-96), pp. 226 – 231.
[4] Martin Ester, Han-peter Kriegel and Jorg Sander et al,(1996) “A Density-Based Algorithm for Discovering Clusters in Large Spatial Databases with Noise”, 2nd International conference on Knowledge Discovery and Data Mining (KDD-96), pp. 226 – 231. [5] ShashiShekar and Sanjay Chawla (2003), “Spatial Databases a Tour”, (ISBN 013-017480-7), Prentice Hall.
[6] Ganga Swathi .K and Rajesh KNVSSK (2012), “Comparative analysis of clustering of spatial databases with various DBSCAN Algorithms”, International Journal of Research in Computer and Communication technology (IJRCCT), ISSN 2278-5841, Vol. 1, Issue 6, pp. 340 -344.
[7] PragatiSrivastava and Hitesh Gupta (2012), “A Review of Density-Based clustering in Spatial Data”, International Journal of Advanced Computer Research, ISSN (online): 2277-7970, Volume-2, Number-3, Issue-5, pp. 200 – 202.
[8] Manish Verma, Mauly Srivastava and Neha Chack et al (2012), “ A Comparative Study of Various Clustering Algorithms in Data Mining”, International Journal of Engineering Research and Applications (IJERA) ISSN: 2248- 9622, Vol. 2, pp.1379-1384, Issue 3.
[9] Smiti, Abir and Zied Eloudi et al (2013), "Soft DBSCAN: Improving DBSCAN Clustering method using fuzzy set theory." In the IEEE 6th International Conference on Human System Interaction (HIS- 2013), pp. 380-385.
[10] Zimmermann and H-J (2010), "Fuzzy set theory." Wiley Interdisciplinary Reviews: Computational Statistics, vol. 2, no. 3, pp. 317-332. [11] Xiaojun LOU, Junying LI and Haitao LIU et al (2012), “Improved Fuzzy C-means Clustering Algorithm Based on Cluster Density”, Journal of Computational Information Systems, vol. 8, issue 2, pp. 727- 737.
[12] P. Haghani, S. Michel, and K. Aberer, “The gist of everything new: personalized top-k processing over web 2.0 streams.” in CIKM, 2010, pp. 489–498. [13] K. Mouratidis and H. Pang, “Efficient evaluation of continuous text search queries,” IEEE Trans. Knowl. Data Eng., vol. 23, no. 10, pp. 1469– 1482, 2011.
[14] N. Vouzoukidou, B. Amann, and V. Christophides, “Processing continuous text queries featuring non-homogeneous scoring functions.” in CIKM, 2012, pp. 1065–1074.
[15] A. Hoppe, “Automatic ontology-based user profile learning from heterogeneous web resources in a big data context.” PVLDB, pp. 1428–1433, 2013. [16] A. Lacerda and N. Ziviani, “Building user profiles to improve user experience in recommender systems,” in WSDM, 2013, pp. 759–764.
[17] M. Busch, K. Gade, B. Larson, P. Lok, S. Luckenbill, and J. J. Lin, “Earlybird: Real-time search at twitter,” in ICDE, 2012, pp. 1360– 1369.
[18] L. Wu, W. Lin, X. Xiao, and Y. Xu, “LSII: an indexing structure for exact real-time search on microblogs,” in ICDE, 2013, pp. 482–493.