199
Evaluation Of Tolerance And Sensitivity Of
Selected Plant Species With Special Reference
To Gasoline Exhaust Pollution
Abhinav Garg, Pallavi Saxena, Chirashree GhoshAbstract: Emissions from motor vehicle exhausts have been shown to have deleterious effects on the physiology of plant species. Our present study focuses on evaluating the tolerance and sensitivity of selected plant species viz. Dracaena deremensis (good absorber of VOCs) and Dianthus caryophyllus (susceptible to ethylene and formaldehyde (VOCs)) at selected sites which are differentiated on the basis of high gasoline exhaust emission source (Site I) and less gasoline exhaust emission source (Site II & III). For this, Air Pollution Tolerance Index (APTI) and selected physiological parameters were taken into account i.e. total chlorophyll, ascorbic acid, pH, relative water content, total protein and Nitrate reductase (NR). The results showed that D. deremensis have high chlorophyll content, ascorbic acid content, protein content, with high NR activity as compared to D. caryophyllus at all the selected sites. As per Air Pollution Tolerance Index (APTI) D. deremensis has value of 60.60, 55.25 & 55.93 at Site I, II & III respectively which comes under tolerant range and D . caryophyllus has value of 14.82, 15.41 & 15.93 at Site I, II & III respectively which comes under sensitive range. Thus, study ends up with the conclusion that D. deremensis was found to be more tolerant than D. caryophyllus at all sites and thus D. deremensis can be used as a tool in mitigation of gasoline exhaust pollution and D. caryophyllus can be used as an bioindicator for indicating gasoline exhaust pollution.
Index Terms: Bioindicator, Chlorophyll, Gasoline Exhaust, Nitrate Reductase, Protein, Sensitive, Tolerant, VOCs
————————————————————
1
I
NTRODUCTIONIn general, the air pollution in cities has been dominated by CO2, CO, NOx, SO2, heavy metals, unburnt petrol, carbon particles and water vapour [1, 2, 3, 4, 5]. The major source of emission of these pollutants is from automobile exhaust. Automobile exhaust contributes significantly to atmospheric pollution especially in developing countries. It has deteriorated air quality and the degree of its contribution to air pollution depends on the traffic flow pattern [6]. The emissions from road traffic have been found to cause damage in vegetation growing in the vicinity of roads and highways [7, 8, 9, 10]. It has also been easy to recognize plant damage that results from high levels of air pollution, but very little is known about the physiological and biochemical effects on plants of long-term exposures to low levels of atmospheric pollutants [11]. There were some of the studies reported by some of the scientists focuses on damage to plant species from gasoline exhaust.
For example, spruce Picea abies L. showed a reduction in twig growth, transpiration, and net photosynthesis at roadside locations compared with unpolluted sites [12, 13] and suffered an increased degradation of the epistomatal waxes [10]. Fumigations under controlled conditions were performed by Fluckiger [14], who demonstrated an inhibition of the regulatory ability of the stomata of Populus tremula leaves. Similarly, Kammerbauer et al [12, 9] reported the impairment of photosynthetic capacity and stomatal regulation in Norway spruce (Picea abies L.) which was followed by fumigation. On the basis of various studies, a number of plant species have been proposed and used for biomonitoring of air pollutants from traffic and industries in tropical and subtropical countries [8, 15, 16, 17]. At the same time, very less studies have been reported on those plant species which can be used as a tool in mitigation of gasoline exhaust especially VOCs and also as bioindicator for the same. Hence, our present study focuses on evaluating the tolerance and sensitivity of selected plant species viz. Dracaena deremensis (good absorber of VOCs) [18] and Dianthus caryophyllus (susceptible to ethylene and formaldehyde (VOCs) [19] at selected sites which are differentiated on the basis of high gasoline exhaust emission source (Site I) and less gasoline exhaust emission source (Site II & III) by taking Air Pollution Tolerance Index (APTI) along with few physiological parameters viz. total chlorophyll, total protein, ascorbic acid, pH, relative water content and nitrate reductase.
2
M
ETHODOLOGYSelected plant species viz. Dracaena deremensis (VOCs tolerant) [18] and Dianthus caryophyllus (VOCs sensitive) [19] were taken at three sites (I, II & III) which are differentiated on the basis of high gasoline exhaust emission source (Site I : CNG-Petroleum Station, Civil Line) and less gasoline exhaust emission source {Site II : Near to traffic intersection area with dense vegetation, Yamuna Biodiversity Park (YBP) and Site III: Away from traffic intersection area with dense vegetation, Field Nursery, University of Delhi, North Campus} during winter season (Nov’10-Feb’2011). Selected two types of plant species
_____________________________
Abhinav Garg, Environmental Pollution Laboratory,
Department of Environmental Studies, University of Delhi, Delhi-110007, India
Pallavi Saxena, formerly Environmental Pollution
Laboratory, Department of Environmental Studies, University of Delhi, Delhi-110007, India
Present address: School of Environmental
Sciences, Jawaharlal Nehru University, New
Delhi-110067 Email Id: [email protected]
Chirashree Ghosh, Environmental Pollution
200 IJSTR©2015
www.ijstr.org
Fig. 1: Average variation of total chlorophyll of Draceana & Dianthus at selected sites
were grown in earthen pots (6 X 6 inch) which contains mixture of 3:1 soil and compost (~400 inch soil mixture). These plants were of same age, ~6 weeks old with stem height of ~6 inches for Dianthus caryophyllus and ~12 inches for Dracaena deremensis with ~10 leaves in each plant. Samples were exposed at each site in triplicate (one plant/pot). Sampling was done thrice a month and analyzed in triplicates for the authenticity of the data. Leaves from potted plants were collected in an ice box, and were tested for physiological parameters, like, total chlorophyll [20], ascorbic acid [21], pH [22], Relative water content [22], Protein [23] and Enzyme Nitrate reductase [24] after every seven days from the date of potting. On the basis of four physiological parameters i.e. total chlorophyll, ascorbic acid, pH and relative water content, Air Pollution Tolerance Index (APTI) was calculated to evaluate the tolerance and sensitivity of these selected plant species [22]. For statistical interpretation of data, one way ANOVA (Duncan’s Test) was used using SPSS 19.0 version.
3
R
ESULTS ANDD
ISCUSSIONSelected healthy plant species viz. Dracaena deremensisand Dianthus caryophyllus of similar age group were exposed in triplicate set at Site I (CNG-Petroleum Station) and simultaneously at Site II (Yamuna Biodiversity park) and Site III (Field Nursery, University of Delhi). The study was carried out in winter season (27th Oct’10 – 26th Feb’11) and plant samples were analyzed for total chlorophyll, total protein, nitrate reductase expression and Air Pollution Tolerance Index (APTI). No visible physical changes/injury was detected in the plant samples during exposure time. Compared with Site II & III, Site I showed lowest average chlorophyll content in both the plant species viz. Dracaena deremensis(1.24 mg/g f.w.) and Dianthus caryophyllus (0.83 mg/g f.w.) as compared to Site II (1.50 & 1.11 mg/g f.w.) and Site III (2.30 & 1.80 mg/g f.w.) respectively (Fig.1). It has also been clearly depicted from Fig.2(a-c), that the total chlorophyll content of Site I ranges between 0.7-1.89 mg/g f.w. and 0.3-1.4 mg/g f.w. of Dracaena and Dianthus respectively, at Site II 0.9-2.27 and 0.45-1.93 mg/g f.w. and at Site III 1.49 – 3.74 and 1.12 – 3.3 mg/g f.w. of Dracaena and Dianthus respectively. It has also been depicted from Fig.2 (a-c), among the four months in winter season, the lowest chlorophyll content was found in the month of January. According to Saxena and Ghosh [25] and Tiwari and Peschin [26], during winter season the concentration of air pollutants were found to be highest as compared to monsoon and summer season due to low mixing heights and low temperature inversion, there was high accumulation of pollutants. Moreover, it was also stated that among the winter months, January is the most coldest month therefore, it has highest rate of accumulation of air pollutants as compared to other winter months. Therefore, in our present study due to high pollution load in January month, lowest chlorophyll content was observed. From Table 1(a&b), 2(a&b) & 3(a&b) it was clearly depicted the data followed by different letters in a column are significantly different at P≤0.05 which clearly predicts that chlorophyll concentration are different and was lowest in January month followed by February, December and November. The data followed by different letters in a row are significantly different at P≤0.05 which clearly predicts that chlorophyll concentration are different and was found to
be less in all the four reported months in Dianthus as compared to Dracaena (Table 1(a&b), 2(a&b) & 3(a&b)). The lowest chlorophyll content was found at Site I which is CNG-petroleum station, near to traffic intersection, metro station, hospital and DU Campus nearby, therefore pollution load is much higher than other selected site (Site II & III).
Fig.2(a) Site I
Fig.2(b) Site II
Fig.2(c) Site III
TABLE 1(A)
VARIATION IN CHLOROPHYLL CONCENTRATION IN DIFFERENT MONTHS DURING WINTER SEASON (NOV’10-FEB’11) IN DRACAENA DEREMENSIS AT SITE I(PETROL PUMP),THE VALUES INDICATE MEAN ± STANDARD ERROR
Months Chl concentration (mg/g f.w.)
November 1.89 + 0.92a
December 1.25 + 0.54b
January 0.70 + 0.18c
February 1.13 ± 0.44bc
201 TABLE 1(B)
VARIATION IN CHLOROPHYLL CONCENTRATION IN DIFFERENT MONTHS DURING WINTER SEASON (NOV’10-FEB’11) IN DIANTHUS CARYOPHYLLUS AT SITE I(PETROL PUMP),THE VALUES INDICATE MEAN ± STANDARD ERROR
Months Chl concentration (mg/g f.w.)
November 1.40 + 0.9b
December 1.73 + 0.37a
January 0.30 + 0.14c
February 1.77 ± 0.21a
Each value represents mean of 18 replicates + standard error. Data followed by different letters in a column are significantly different but with same letters in a column are non-significant at P≤0.05.
TABLE 2(A)
VARIATION IN CHLOROPHYLL CONCENTRATION IN DIFFERENT MONTHS DURING WINTER SEASON (NOV’10-FEB’11) IN DRACAENA DEREMENSIS AT SITE II(YBP),THE VALUES INDICATE MEAN ± STANDARD ERROR
Months Chl concentration (mg/g f.w.)
November 2.27 + 1.23a
December 1.55 + 0.71b
January 0.90 + 0.43c
February 1.29 ± 0.94ab
Each value represents mean of 18 replicates + standard error. Data followed by different letters in a column are significantly different at P≤0.05.
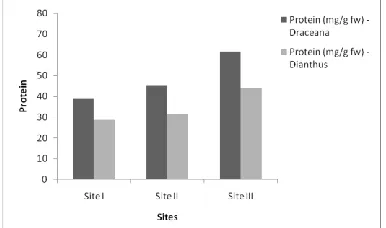
In Fig. 3, the protein content of selected plant species has also been taken into account. Similarly, in case of protein, Site I has observed lowest mean protein content in both the plant Species Dracaena (38.90 mg protein/g f.w.) and Dianthus (28.61 mg protein/g f.w.) as compared to Site II (45.4 & 31.63 mg protein/g f.w.) and Site III (61.58 & 43.90 mg protein/g f.w.) of both plant species respectively. In detail, Site I range between 29.75-50.13 and 23.8-35.68 mg protein/g f.w. of Dracaena and Dianthus respectively, at Site II 27.20-70.2 and 22.9-39.80 mg protein/g f.w and at Site III ranges from 50.6-77.39 and 29.99-61.91 mg protein/g f.w of both plant species respectively (Fig.4 (a-c)). It has also been depicted from Fig.4 (a-c), among the four months in winter season, the lowest protein content was found in the month of January. The reason has already been discussed above in chlorophyll section. From Table 4(a&b), 5(a&b) & 6(a&b), it was clearly depicted the data followed by different letters in a column are significantly different at P≤0.05 which clearly predicts that protein concentration are different and was lowest in January month followed by February, December and November. The data followed by different letters in a row are significantly-
TABLE 2(B)
VARIATION IN CHLOROPHYLL CONCENTRATION IN DIFFERENT MONTHS DURING WINTER SEASON (NOV’10-FEB’11) IN DIANTHUS CARYOPHYLLUS AT SITE II(YBP),THE VALUES INDICATE MEAN ± STANDARD ERROR
Months Chl concentration (mg/g f.w.)
November 1.93 + 1.07a
December 1.21 + 0.72b
January 0.45 + 0.34c
February 0.88 ± 0.83ab
Each value represents mean of 18 replicates + standard error. Data followed by different letters in a column are significantly different at P≤0.05.
TABLE 3(A)
VARIATION IN CHLOROPHYLL CONCENTRATION IN DIFFERENT MONTHS DURING WINTER SEASON (NOV’10-FEB’11) IN DRACAENA DEREMENSIS AT SITE III(DU),THE VALUES INDICATE MEAN ± STANDARD ERROR
Months Chl concentration (mg/g f.w.)
November 3.74 + 1.07a
December 2.11 + 0.53b
January 1.49 + 0.48c
February 1.87 ± 0.53bc
Each value represents mean of 18 replicates + standard error. Data followed by different letters in a column are significantly different at P≤0.05.
TABLE 3(B)
VARIATION IN CHLOROPHYLL CONCENTRATION IN DIFFERENT MONTHS DURING WINTER SEASON (NOV’10-FEB’11) IN DIANTHUS CARYOPHYLLUS AT SITE III(DU),THE VALUES INDICATE MEAN ± STANDARD ERROR
Months Chl concentration (mg/g f.w.)
November 3.30 + 1.08a
December 1.47 + 0.54b
January 1.12 + 0.38c
February 1.34 ± 0.41b
Each value represents mean of 18 replicates + standard error. Data followed by different letters in a column are significantly different but with same letters in a column are non-significant at P≤0.05.
202 IJSTR©2015
www.ijstr.org
Fig.4 (a) Site I
Fig.4 (b) Site II
Fig.4 (c) Site III
Fig.4 (a-c) Monthly average variation of Total Protein of Dracaena & Dianthus at Selected Sites
TABLE 4(A)
VARIATION IN PROTEIN CONCENTRATION IN DIFFERENT MONTHS DURING WINTER SEASON (NOV’10-FEB’11) IN DRACAENA DEREMENSIS AT SITE I (PETROL PUMP), THE VALUES INDICATE MEAN ± STANDARD ERROR
Months Protein concentration (mg/g f.w.)
November 50.13 + 8.21a
December 43.10 + 8.54a
January 29.75 + 5.92b
February 32.63 ± 8.40b
Each value represents mean of 18 replicates + standard error. Data followed by different letters in a column are significantly different but with same letters in a column are non-significant at P≤0.05
TABLE 4(B)
VARIATION IN PROTEIN CONCENTRATION IN DIFFERENT MONTHS DURING WINTER SEASON (NOV’10-FEB’11) IN DIANTHUS CARYOPHYLLUS AT SITE I(PETROL PUMP),THE VALUES INDICATE MEAN ± STANDARD ERROR
Months Protein concentration (mg/g f.w.)
November 35.68 + 6.43a
December 30.04 + 4.43a
January 23.80 + 4.01b
February 24.92 ± 6.54b
Each value represents mean of 18 replicates + standard error. Data followed by different letters in a column are significantly different but with same letters in a column are non-significant at P≤0.05.
TABLE 5(A)
VARIATION IN PROTEIN CONCENTRATION IN DIFFERENT MONTHS DURING WINTER SEASON (NOV’10-FEB’11) IN DRACAENA DEREMENSIS AT SITE II (YBP), THE VALUES INDICATE MEAN ± STANDARD ERROR
Months Protein concentration (mg/g f.w.)
November 70.20 + 6.90a
December 49.70 + 6.10b
January 27.2 + 3.5c
February 34.51 ± 3.61cb
Each value represents mean of 18 replicates + standard error. Data followed by different letters in a column are significantly different at P≤0.05.
TABLE 5(B)
VARIATION IN PROTEIN CONCENTRATION IN DIFFERENT MONTHS DURING WINTER SEASON (NOV’10-FEB’11) IN DIANTHUS CARYOPHYLLUS AT SITE II(YBP),THE VALUES INDICATE MEAN ± STANDARD ERROR
Months Protein concentration (mg/g f.w.)
November 39.79 + 5.0a
December 34.63 + 4.84a
January 22.90 + 3.07b
February 29.2 ± 4.24b
Each value represents mean of 18 replicates + standard error. Data followed by different letters in a column are significantly different but with same letters in a column are non-significant at P≤0.05.
TABLE 6(A)
VARIATION IN PROTEIN CONCENTRATION IN DIFFERENT MONTHS DURING WINTER SEASON (NOV’10-FEB’11) IN DRACAENA DEREMENSIS AT SITE III (DU), THE VALUES INDICATE MEAN ± STANDARD ERROR
Months Protein concentration (mg/g f.w.)
November 77.37 + 7.48a
December 64.61 + 7.34b
January 50.60 + 5.04c
February 53.70 ± 5.93c
Each value represents mean of 18 replicates + standard error. Data followed by different letters in a column are significantly different but with same letters in a column are non-significant at P≤0.05.
TABLE 6(B)
VARIATION IN PROTEIN CONCENTRATION IN DIFFERENT MONTHS DURING WINTER SEASON (NOV’10-FEB’11) IN DIANTHUS CARYOPHYLLUS AT SITE III(DU),THE VALUES INDICATE MEAN ± STANDARD ERROR
Months Protein concentration (mg/g f.w.)
November 61.91 + 8.29a
December 44.6 + 5.4b
January 29.98 + 4.82c
February 39.10 ± 3.14d
Each value represents mean of 18 replicates + standard error. Data followed by different letters in a column are significantly different at P≤0.05.
203 Dracaena (Table 4(a&b), 5(a&b) & 6(a&b)). From the above
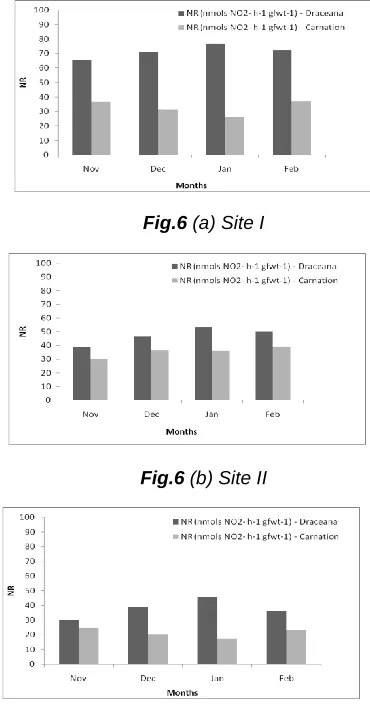
discussion, it has been also clearly observed that, Dracaena deremensisshowed higher chlorophyll as well as protein content than Dianthus caryophyllus irrespective of any of the three chosen sites. According to literature reported by NASA [18] that Dracaena deremensisis VOCs tolerant plant species and Dianthus caryophyllus is VOCs sensitive species. Interestingly at our selected sites, the response of the plant species recorded substantiate the observations about their sensitivity, Dracaena was more tolerant than Dianthus. In addition to this, the enzymatic activities of nitrate reductase accelerated in plants exposed to exhaust gases from motor vehicles were also determined. From the Fig.5 it was observed that Dracaena and Dianthus sp. at Site I has highest mean nitrate reductase activity (71.37 & 32.83 nmols NO2- h
-1 gfwt-1 respectively) followed by Site II (47.25 & 35.57 nmols NO2- h-1 gfwt-1) and Site III (37.93 & 21.61 nmols NO2- h
-1
gfwt-1). Moreover, it has also been clearly reported from Fig.6(a-c) that nitrate reductase activity at Site I ranges between 65.83 – 76.7 & 26.2 – 37.2, Site II has 38.75 – 53.43 & 30.29 & 39 and Site III with 30.25 – 45.91 & 17.34 – 25.1 of Dracaena and Dianthus respectively. From the figures, it has been clearly noted that Site I was showing highest nitrate reductase activity because it is comparatively more polluted sites than other selected sites (Site II & III) as Site I has high gasoline emissions. This activity increase is due to the NOx fraction present in the exhaust emissions, low nitrite values were detected in exposed plants. The function of NOx in gasoline exhaust is to cause acidification of the cytoplasm and may induce photo-oxidative processes, which may cause a disturbance of ionic balance and ATP synthesis [27, 28, 29]. Gaseous NOx is known to be absorbed through the stomata or enters the plant directly through the cuticle [30] and is rapidly converted into nitrate and nitrite [29] and assimilated. This is reflected here at Site I which was having higher total nitrogen content found under the pollution-intensive roadside growing conditions. This parameter of nitrate reductase is the most appropriate physiological parameter which is clearly stated about the effect of gasoline exhaust on plants or in more precisely, the effect of VOCs and NOx on plant species. It has also been depicted from Fig.6 (a-c), among the four months in winter season, the highest NR content was found in the month of January in Dracaena and lowest in case of Dianthus. This was due to the reason that has already been discussed in chlorophyll section that among the four months of winter season, January has got highest pollution load as compared to other months.
Fig. 5: Average variation of nitrate reductase of Dracaena & Dianthus at selected sites
Fig.6 (a) Site I
Fig.6 (b) Site II
Fig.6 (c) Site III
Fig.6 (a-c) Monthly average variation of Nitrate Reducatse of Dracaena & Dianthus at Selected Sites
TABLE 7(A)
VARIATION IN NR CONCENTRATION IN DIFFERENT MONTHS DURING WINTER SEASON (NOV’10-FEB’11) IN DRACAENA DEREMENSIS AT SITE I (PETROL PUMP),THE VALUES INDICATE MEAN ± STANDARD ERROR
Months NR (nmols NO2-h -1
gfwt-1)
November 65.83 + 8.65a
December 70.94 + 6.30a
January 76.70 + 7.82a
February 71.99 ± 7.55a
Each value represents mean of 18 replicates + standard error. Data followed by same letters in a column are non-significant at P≤0.05.
TABLE 7(B)
VARIATION IN NR CONCENTRATION IN DIFFERENT MONTHS DURING WINTER SEASON (NOV’10-FEB’11) IN DIANTHUS CARYOPHYLLUS AT SITE I(PETROL PUMP),THE VALUES INDICATE MEAN ± STANDARD ERROR
Months NR (nmols NO2-h-1gfwt-1)
November 36.85 + 2.20a
December 31.09 + 3.33a
January 26.20 + 1.93a
February 37.2 ± 2.85a
204 IJSTR©2015
www.ijstr.org
error. Data followed by same letters in a column are non-significant at P≤0.05.
Moreover, it has already been discussed above (in protein section) that Dracaena was VOCs tolerant that’s why it has high NR content and Dianthus was VOCs sensitive that’s why it has lowest NR content. From Table 7(a&b), 8(a&b) & 9(a&b), it was clearly depicted the data followed by different letters in a column are significantly different at P≤0.05 which clearly predicts that NR concentration are different and was highest in January month followed by February, December and November in case of Dracaena but lowest in January in case of Dianthus. The data followed by different letters in a row are significantly different at P≤0.05 which clearly predicts that protein concentration are different and was found to be less in all the four reported months in Dianthus as compared to Dracaena (Table 7(a&b), 8(a&b) & 9(a&b)).
TABLE 8(A)
VARIATION IN NR CONCENTRATION IN DIFFERENT MONTHS DURING WINTER SEASON (NOV’10-FEB’11) IN DRACAENA DEREMENSIS AT SITE II (YBP),THE VALUES INDICATE MEAN ± STANDARD ERROR
Months NR (nmols NO2-h-1gfwt-1)
November 38.75 + 4.31b
December 46.64 + 4.71a
January 53.43 + 6.08a
February 50.18 ± 4.78a
Each value represents mean of 18 replicates + standard error. Data followed by different letters in a column are significantly different but with same letters in a column are non-significant at P≤0.05.
TABLE 8(B)
VARIATION IN NR CONCENTRATION IN DIFFERENT MONTHS DURING WINTER SEASON (NOV’10-FEB’11) IN DIANTHUS CARYOPHYLLUS AT SITE II(YBP),THE VALUES INDICATE MEAN ± STANDARD ERROR
Months NR (nmols NO2-h
-1
gfwt-1)
November 30.28 + 5.53a
December 36.72 + 2.92a
January 36.24 + 5.63a
February 39.0 ± 5.24a
Each value represents mean of 18 replicates + standard error. Data followed by same letters in a column are non-significant at P≤0.05.
TABLE 9(A)
VARIATION IN NR CONCENTRATION IN DIFFERENT MONTHS DURING WINTER SEASON (NOV’10-FEB’11) IN DRACAENA DEREMENSIS AT SITE III (DU), THE VALUES INDICATE MEAN ± STANDARD ERROR
Months NR (nmols NO2-h-1gfwt-1)
November 30.25 + 3.74a
December 39.24 + 2.98a
January 45.91 + 3.90a
February 36.34 ± 7.70a
Each value represents mean of 18 replicates + standard error. Data followed by same letters in a column are non-significant at P≤0.05.
TABLE 9(B)
VARIATION IN NR CONCENTRATION IN DIFFERENT MONTHS DURING WINTER SEASON (NOV’10-FEB’11) IN DIANTHUS CARYOPHYLLUS AT SITE III(DU),THE VALUES INDICATE MEAN ± STANDARD ERROR
Months NR (nmols NO2-h -1
gfwt-1)
November 25.10 + 2.24a
December 20.38 + 2.63a
January 17.34 + 4.89a
February 23.65 ± 5.44a
Each value represents mean of 18 replicates + standard error. Data followed by same letters in a column are non-significant at P≤0.05.
205 that tolerance of plants to any of the pollutant may be linked
with synthesis or degradation of chlorophyll. Thus, plants having high chlorophyll content under field conditions are generally tolerant to air pollutants. In case of ascorbic acid content, it is a strong reductant and high amounts of this substance favours pollution tolerance in plants [33, 34]. The level of this acid declines on pollutant exposure [33]. Thus, plants maintaining high ascorbic acid level even under polluted conditions are considered to be tolerant to air pollutants. Ascorbic acid, through its reducing power, protects chloroplasts against SO2-induced H2O2, O2- and OH accumulation, and thus protects the enzymes of the CO2 fixation cycle and chlorophyll from inactivation [34]. Together with leaf pH, it plays a significant role in determining the SO2-sensitivity of plants [35, 36]. Its reducing power is more at higher and less at lower pH values. Thus, it may be possible that ascorbic acid protects chloroplasts and chlorophyll functions from pollutants through its pH-dependent reducing power. It has also been reported that, in the presence of an acidic pollutant, the leaf pH is lowered and the decline is greater in sensitive than that in tolerant plants [37]. Thus, a higher level of leaf-extract pH in plants under polluted conditions may increase their tolerance level to air pollutants. The last factor is relative water content, in which it has been reported that, RWC is associated with protoplasmic permeability [38], that air pollutants increase cell permeability [39], more so in the case of sensitive species [40]. Pollutant induced increased permeability in cells causes loss of water and dissolved nutrients, resulting in early senescence of leaves [41]. It is likely therefore that plants with high RWC under polluted conditions may be tolerant to pollutants. Thus, the A(T+ P) part of the formula represents the potential of chloroplast to combat pollutants after their entry inside the plant. The addition of RWC to A(T+ P) shows the capacity of the cell membrane to maintain its permeability under polluted conditions. Thus, this combination of four parameters is suggested as representing the best index of the susceptibility levels of plants under field conditions. The response of plants determined through the index values compared well with the susceptibility levels of these plants. On comparison of APTI of Site I II & III (Fig. 13), Dracaena deremensis was found to be tolerant plant species at all the three sites as compared to Dianthus caryophyllus which was found to be sensitive as per APTI index, therefore Dracaena deremensis can be recommended for good air purifier and also can be used as a tool in mitigation of gasoline exhaust pollution especially VOCs and D. caryophyllus can be used as an bioindicator for indicating gasoline exhaust pollution.
Fig.7: Variation of physiological parameters at Site I
Fig.8: Variation of APTI at Site I
Fig.9: Variation of physiological parameters at Site II
Fig.10: Variation of APTI at Site II
206 IJSTR©2015
www.ijstr.org
Fig.12: Variation of APTI at Site III
Fig.13: Variation of APTI in Dracaena and Dianthus at Site I, II & III
4
C
ONCLUSION1. Dracaena deremensis was found to have higher chlorophyll, protein, Nitrate reductase, ascorbic acid and as per APTI index, it comes under tolerance range at all the three selected sites whereas, Dianthus caryophyllus have lower chlorophyll, protein, nitrate reductase, ascorbic acid and it comes under sensitive range as per APTI index.
2. Dracaena deremensis was found to be tolerant plant species and Dianthus caryophyllus was sensitive plant species. According to NASA, 2010 study, Dracaena deremensis was regarded as good absorber of VOCs in a controlled study of indoor environment whereas Cape, 1997 study, Dianthus caryophyllus was susceptible to ethylene, benzene, formaldehyde etc. (VOCs) in controlled study of both indoor as well as outdoor environment.
3. Dracaena deremensis and Dianthus caryophyllus found to be tolerant and sensitive respectively as per APTI index range in outdoor environment. Hence, can be recommended for good air purifier and also can be used as a tool in mitigation of gasoline exhaust pollution and D. caryophyllus can be used as an bioindicator for indicating gasoline exhaust pollution.
5
A
CKNOWLEDGMENTSAuthors kindly acknowledge the funding agencies, Department of Science and Technology (DST), University Grant Commission (UGC), Govt. of India and Research and Development Fund, University of Delhi for supporting the study.
6
R
EFERENCES[1] G.L. Wheeler and G.L. Rolfe, ―The relationship between daily traffic volume and the distribution of lead in roadside soil and vegetation‖, Environ. Pollut, vol.18, pp. 265-274, 1979.
[2] J.V. Lagerwerff and A.W. Specht, ―Contamination of roadside soil and vegetation with Cd, Ni, Pb and Zn‖, Environ. Sci. Technol, vol.4, pp. 583-586, 1970.
[3] W. Burges, D.B. Berardinis and E.L. Speizer, ―Exposure to automobile exhaust III. An environmental assessment‖, Arch. Environ. Healt, vol. 26, pp.325-329, 1973.
[4] R.L. Solomon and Y.W. Hartford, ―Lead and cadmium in dust and soil in a small urban community‖, Environ. Sci. Technol, vol. 10, pp.773-777, 1976.
[5] B. Mankovska, ―The content of Pb, Cd and Cl in forest trees caused by the traffic of motor vehicles‖, Bio. Plantarum, pp. 414-419, 1977.
[6] J.G. Farmer and T.D.B. Lyon, ―Lead in Glasgow street dirt and soil‖, Sci. Total Environ, vol. 8, pp. 89-91, 1977.
[7] W. Flueckiger, S. Braun and J.J. Opertli, ―Effects of air pollution caused by traffic on germination and tube growth of pollen of Nicotiana sylvestris‖, Environ. Pollut, vol. 16, pp. 73-80, 1978.
[8] A. Banerjee, R.K. Sarkar and S. Mukherji, ―Reduction in soluble protein and chlorophyll contents in a few plants as indicators of automobile exhaust pollution‖, Int. J. Environ. Studies, vol. 20, pp. 239–243, 1983.
[9] H. Kammerbauer, H. Selinger, A. Ziegler-Joens, R. Ro¨mmmelt, D. Knoppik and B. Hock, ―Toxic components of motor vehicle emissions for spruce Picea abies‖, Environ. Pollut, Vol. 48, pp. 235–242, 1987b.
[10]J.J. Sauter, H. Kammerbauer, L. Pambor and B. Hock, ―Evidence for the accelerated micromorphological degradation of epistomatal waxes in Norway spruce by motor vehicle emissions‖, Eur. J. Forest Pathol, Vol. 17, pp.444– 448, 1987.
[11]R.K. Sarker, A Banerjee and S. Mukherji, ―Acceleration of peroxidise and catalase activities in leaves of dicotyledonous plants as an indication of automobile exhaust pollution‖, Environ. Pollut. Vol. 41, pp. 289–295, 1986.
[12]T. Keller, ―Auswirkungen der Strassenrandbedingungen auf physiologische Aktivitaeten der Fichte. Forstwiss‖, Centralbl, 104, 312–318, 1985.
[13]H. Kammerbauer, A. Ziegler-Joens, H. Selinger, D. Knoppik and B. Hock, ―Exposure of Norway spruce at the highway border: effects on gas exchange and growth‖, Experientia. Vol. 43, pp. 1124–1125, 1987a.
207 Blackwell Scientific Publications, pp. 331-332, 1987a.
[15]U. Arndt, C. Franz-Gerstein, D. Hinger, J. Schachner, J. Scherrieble, F. Flores and T. Strehl, ―Untersuchungen zur Eignung tropischer Planzen als Bioindikatoren in Entwicklungsla¨ndern‖, VDI-Berichte, Vol. 1, 559–575, 1991.
[16]A. Klumpp, G. Klumpp and M. Domingos, ―Plants as bioindicators of air pollution at the Serra do mar near the industrial complex of Cubatao‖, Brazil. Environ. Poll, Vol. 85, pp. 109–16, 1994.
[17]M.S. Can˜as, H.A. Carreras, L. Orellana and M.L. Pignata, ―Correlation between environmental conditions and foliar chemical parameters in Ligustrum lucidum Ait. exposed to urban air pollutants‖, J. Environ. Manag, Vol. 49, pp. 167– 181, 1997.
[18]NASA, ―Clean Air Study‖,
http://www.scribd.com/doc/1837156/NASA-Indoor-Plants. 2010.
[19]J.N. Cape, ―Photochemical oxidants-what else is in the atmosphere besides ozone?‖, Phyton-A. Rei. Bot. A, Vol. 37, pp. 45-57, 1997.
[20]J.D. Hiscox and G.F. Israelstam, ―A method for the extraction of chlorophyll from leaf tissue without maceration‖, Can. J. Chem, Vol. 57, pp. 1332-1334, 1979.
[21]M.Y. Law, S.A. Charles and B. Halliwell, ―Glutathione and ascorbic acid in spinach chloroplasts: The effect of hydrogen peroxide and of paraquat‖, Biochem. J. Vol. 210, pp. 899-903, 1983.
[22]Singh, S. and Rao, D.N, ―Evaluation of Plants for their Tolerance to Air Pollution‖, Proceedings on Air Pollution Control, A. K. Singh Ed., New Delhi, India, pp. 218–224, 1983.
[23]M.M. Bradford, ―Rapid and sensitive method for the quantification of protein utilizing the principle of protein-dye binding‖, Anal. Biochem. Vol. 72, pp. 248-254, (1976).
[24]G.R. Stewart, J.A Lee and T.O. Orebamjo, ―Nitrogen Metabolism of Halophytes‖, New Phytol, Vol. 72, pp. 539-546, 1973.
[25]P. Saxena and C. Ghosh, ―Variation in concentration of ozone at selected sites in Delhi‖, Int. J. Env. Sci. Vol. 1(7), pp. 1899-1911, 2011.
[26]V.S. Tiwari and S. Peshin, ―A Prominent Maximum in Surface Ozone Concentrations during Winter Months at Pune (India)‖, Mausam, Vol. 46(2), pp. 155-162, 1995.
[27]A.R. Wellburn, O. Majernik and F.A.M. Wellburn, ―Effects of SO2 and NO2 polluted air upon ultrastructure of chloroplasts‖, Environ. Pollut, Vol. 3, pp. 37–49, 1972.
[28]A.J. Zeevart, ―Some effects of fumigating plants for short periods with NO2‖, Environ. Pollut. Vol. 11, pp. 97–108, 1976.
[29]A.R. Wellburn, ―Why are atmospheric oxides of nitrogen usually phytotoxic and not alternative fertilizers‖? New Phytol, Vol. 115, pp. 395–429, 1990.
[30]K.J. Lendzian and G. Kerstiens, ―Sorption and transport of gases and vapors in plant cuticles‖, Rev. Environ. Contam. Toxicol, Vol. 121, pp. 65–128, 1991.
[31]D. J. Spedding and W. J. Thomas, ―Effect of Sulphur dioxide on the Metabolism of Glycollic acid by Barley (Hordeum vulgare) leaves‖, Aust. J. Biol. Sci. Vol. 26, 2, 1973.
[32]J. N. B. Bell and C. H. Mudd, ―Sulphur dioxide Resistance in Plants: A Case Study of Loliumperenne‖, Effects of Air Pollutants on Plants, T. A. Mansfield, Eds., Cambridge: Cambridge University Press, pp. 87-103, 1976.
[33]T. Keller and H. Schwager, ―Air Pollution and Ascorbic acid‖ Eur. J. Forest Pathol, Vol. 7, pp. 338-350, 1977.
[34]S.D. Lee, ―Evaluation of Scientific Basis For Ozone (oxidants)‖, Air Pollution Control Association Pittsburg, PA, 1985.
[35]K. Tanaka, T. Otsubo and N. Kondo, ―Participation of Hydrogen Peroxide in the Inactivation of Calvin-cycle SH Enzymes in SO2-fumigated Spinach Leaves‖, Plant Cell Physiol. Vol. 28, pp. 1009-1018, 1982.
[36]C. S. Choudhary and D. N. Rao, ―Study of Some Factors in Plants Controlling their Susceptibility to SO2 Pollution‖, Proceedings of the Indian National Science Academy, India, Vol. 43, 236-241, 1977.
[37]D.N. Rao, ―Use of plants as an indicators and monitors of SO2 pollution‖, Chemical Age India, Vol. 28, 655-671, 1977.
[38]F. Scholz and S. Reck, ―Effects of Acids on Forest Trees as Measured by Titration in Vitro, Inheritance of Buffering Capacity in Picea abies‖, Water, Air, Soil Pollut, Vol. 8, pp. 41-45, 1977.
[39]T. V. Oleinikova, ―The Effect of Drought on Protoplasm Permeability in Cells of Spring Wheat Leaves‖, Byull. Vses. Inst. Rasteniev, Vol. 14, pp. 25-30, 1969.
[40]M. Farooq and M.U. Beg, ―Effect of Aqueous Sulphur dioxide on the Membrane Permeability of Common Indian tree leaves‖, New Botanist, Vol. 7, pp. 213-217, 1980.