R E S E A R C H
Open Access
Profiling of patient-specific myocytes
identifies altered gene expression in
the ophthalmoplegic subphenotype of
myasthenia gravis
Melissa Nel
1, Sharon Prince
2and Jeannine M. Heckmann
1,3*Abstract
Background:While extraocular muscles are affected early in myasthenia gravis (MG), but respond to treatment, we observe a high incidence of treatment-resistant ophthalmoplegia (OP-MG) among MG subjects with African genetic ancestry. Previously, using whole exome sequencing, we reported potentially functional variants which associated with OP-MG. The aim of this study was to profile the expression of genes harbouring the OP-MG associated variants using patient-derived subphenotype-specific‘myocyte’cultures.
Methods:From well-characterised MG patients we developed the‘myocyte’culture models by transdifferentiating dermal fibroblasts using an adenovirus expressing MyoD. These myocyte cultures were treated with homologous acetylcholine receptor antibody-positive myasthenic sera to induce muscle transcripts in response to an MG stimulus. Gene expression in myocytes derived from OP-MG (n= 10) and control MG subjects (MG without ophthalmoplegia; n= 6) was quantified using a custom qPCR array profiling 93 potentially relevant genes which included the putative OP-MG susceptibility genes and other previously reported genes of interest in MG and experimental autoimmune myasthenia gravis (EAMG).
Results:OP-MG myocytes compared to control MG myocytes showed altered expression of four OP-MG susceptibility
genes (PPP6R2,CANX,FAM136AandFAM69A) as well as several MG and EAMG genes (p< 0.05). A correlation matrix of gene pair expression levels revealed that 15% of gene pairs were strongly correlated in OP-MG samples (r > 0.78,p< 0. 01), but not in control MG samples. OP-MG susceptibility genes and MG-associated genes accounted for the top three significantly correlated gene pairs (r≥0.98, p< 1 × 10⁻⁶) reflecting crosstalk between OP-MG and myasthenia pathways, which was not evident in control MG cells. The genes with altered expression dynamics between the two subphenotypes included those with a known role in gangliosphingolipid biosynthesis, mitochondrial metabolism and the IGF1-signalling pathway.
Conclusion: Using a surrogate cell culture model our findings suggest that muscle gene expression and co-expression differ between OP-MG and control MG individuals. These findings implicate pathways not previously considered in extraocular muscle involvement in myasthenia gravis and will inform future studies.
Keywords: Myasthenia gravis, Ophthalmoplegia, Gene expression, Transdifferentiation, Subphenotype, Myotranscriptome
* Correspondence:[email protected]
1Neurology Research Group, Division of Neurology, E8-30, New Groote
Schuur Hospital, Department of Medicine, Faculty of Health Sciences, University of Cape Town, Cape Town 7925, South Africa
3Division of Neurology, E8-74, New Groote Schuur Hospital, Department of
Medicine, Faculty of Health Sciences, University of Cape Town, Cape Town 7925, South Africa
Full list of author information is available at the end of the article
Background
Myasthenia gravis (MG) is a rare antibody-mediated neuromuscular disease in which predominantly acetyl-choline receptor (AChR) antibodies target the muscle endplate resulting in fatigable weakness of skeletal mus-cles. Antibody-mediated complement activation results in muscle endplate damage and ultrastructural changes in all muscle groups, including extraocular muscles (EOMs) [1]. EOMs, which are particularly susceptible to complement mediated damage in MG due to their rela-tive deficiency of complement inhibitors and other fac-tors, are commonly involved early in the disease but typically respond to therapy [2,3].
Though the incidence of MG in sub-Saharan Africa is comparable to world figures [4], we observe a high fre-quency of treatment-resistant ophthalmoplegia in this region characterized by severe, persistent eye muscle weakness, which we refer to as OP-MG [5]. In our clin-ical experience, OP-MG most commonly affects subjects with juvenile onset, but otherwise characteristic AChR antibody-positive MG (i.e. generalized muscle weakness which responds to treatment) [6]. The OP-MG subphe-notype results in significant impairment of visual func-tion and ranges from severe paresis of most EOMs to complete paralysis of all EOMs (complete ophthalmople-gia) with ptosis in severe cases. The pathogenesis of the OP-MG subphenotype remains unknown.
We hypothesize that OP-MG might result from exces-sive complement-mediated damage of muscle endplates coupled with impaired regeneration in the EOMs [5]. Previously we found that a subset of OP-MG individuals harbour functional regulatory region variants in the decay accelerating factor (DAF or CD55) [7] and trans-forming growth factor beta 1 (TGFB1) genes [8] which lower their respective expression levels. Impaired upreg-ulation of DAF, a complement regulatory protein which mitigates complement activation, and TGFB1, a promin-ent myokine which also upregulates DAF expression in the orbital environment [9], suggests that potentiated complement mediated injury and altered healing of the EOMs may contribute to OP-MG pathogenesis.
We also performed extended whole exome sequencing (WES) in a well characterized cohort of OP-MG and control MG individuals, all AChR antibody-positive and differing only by the responsiveness of their EOMs to standard therapy. This approach identified a number of potentially functional OP-MG associated regulatory re-gion variants which were more common in OP-MG compared to control MG individuals [10]. The gene list containing these candidate variants was filtered and putative OP-MG susceptibility genes were priori-tised based on whether their expression was detected in a RNA microarray of normal human extraocular muscle tissue [11].
Because of the difficulty in obtaining relevant EOM tissue, we developed a phenotype and MG disease spe-cific muscle cell culture model through transdifferentia-tion of primary dermal fibroblasts into myocytes. The focus of the present study was to compare the expres-sion of relevant genes in OP-MG vs control MG samples using this model of the myotranscriptome. Relevant genes included those harbouring OP-MG susceptibility variants and additional genes differentially expressed in MG or experimental autoimmune MG (EAMG) based on published studies.
Material and methods OP-MG and control MG definition
Sixteen individuals (10 OP-MG and 6 control MG) all with African-genetic ancestry (black or mixed-African ancestry as previously described [5, 10]) and generalized AChR-antibody positive MG with prolonged follow-up at the myasthenia gravis clinic at Groote Schuur Hospital, University of Cape Town, South Africa do-nated skin biopsies. OP-MG was defined as individuals with otherwise characteristic generalized MG, but in whom the EOMs remained treatment-resistant whereas control MG individuals may have had typical EOM weakness as part of their initial MG presentation, but responded to therapy and have since remained free of persistent extraocular muscle weakness [5, 8]. There was no significant difference (p> 0.05) in black and mixed-Afri-can ancestry proportions, age at MG onset, years of follow up or age at skin biopsy between the OP-MG and control MG groups. There was a higher proportion of female subjects in the control MG compared to the OP-MG group (100% vs 40%, p= 0.033) (Table 1).
Ethics and consent
The study was approved by the University of Cape Town Health Sciences Faculty Research Ethics committee (HREC 257/2012) and all individuals (or their parents if < 18 years) signed informed consent to participate.
Table 1Clinical characteristics of the 16 skin biopsy donors by subphenotype
control MG OP-MG pvalue
female n (%) 6 (1) 4 (0.40) 0.033
male n (%) 0 6 (0.60)
M/A n (%) 4 (0.67) 5 (0.50) 0.633
B n (%) 2 (0.33) 5 (0.50)
age at MG onset (yrs), mean (IQR) 21 (18–24) 18 (11–22) 0.576 years of follow up, mean (IQR) 13 (5–10) 15 (10–17) 0.679 age at skin biospy (yrs), mean (IQR) 31 (25–30) 30 (23–34) 0.947
M/Amixed-African ancestry,Bblack/indigenous African ancestry,yrs. years,IQR
Skin biopsies and primary dermal fibroblast culture
Skin punch biopsies (3 mm full thickness) were obtained from the scapular area of each donor. The epidermis and superficial dermal layer was separated from the sub-cutaneous tissue, manually minced with surgical blades and cultured under sterile coverslips (explant method) in 35 mm dishes with growth medium (high glucose Dulbecco’s modified Eagle’s medium (DMEM) + 10% foetal bovine serum + 1% penicillin/streptomycin (P/S)) until fibroblasts emerged.
Development of subphenotype-specific myocyte models
To compare gene expression between OP-MG and control-MG subphenotypes, we developed a muscle cell culture model for each subject. Briefly, 2 × 10⁵dermal fi-broblasts (passage 4) were seeded in 6 cm dishes coated with 0.1 mg/ml Matrigel® in 4 ml growth medium and incubated overnight at 37 °C and 5% CO2. The next day
the fibroblasts, at 80–90% confluency, were transduced with a RGD fiber modified adenovirus containing a human MyoD transgene and expressing a green fluorescent protein (GFP) reporter (Ad(RGD)-MyoD-GFP) (VectorBiolabs, Philadelphia, USA) at a multiplicity of infection (MOI) of 200. This achieved > 90% transduction efficiency (%GFP+ fibroblasts determined by FACS analysis) (data not shown). Transduced fibroblasts were maintained in differentiation medium (DMEM + 5% horse serum + 1% P/S) and differ-entiated for either 48 h (early muscle model) or 5 days (late muscle model) to generate myocytes.
After 5 days of differentiation, myocytes showed morphological features of myogenic differentiation in-cluding widespread immunostaining of cells with an MF-20 antibody that recognizes all isoforms of sarco-meric myosin (data not shown). However, contrary to the skeletal muscle differentiation program in vivo, not all trans-differentiated dermal fibroblasts exhibited branched, multinucleated myotube formation. The term
‘myocyte’ rather than ‘myotube’ was therefore used to refer to our muscle cell culture model since the morpho-logical features of complete terminal differentiation were not observed.
To mimic patient-specific MG-induced muscle pathway responses in vitro, we stimulated 48 h and 5 days differentiated myocyte cultures with 5% hom-ologous treatment-naïve AChR-antibody positive MG sera for 24 h before harvesting RNA (early and late MG model) (Fig. 1). The sera sample was sourced from an AChR antibody-positive, treatment-naive MG patient with generalized myasthenia and severe extraocular muscle involvement.
RNA extraction, quantification and quality control
RNA was extracted from myocytes (n= 64) using the HighPure RNA extraction kit (Roche) according to the
kit protocol. RNA concentration and purity were deter-mined using the Nanodrop® ND1000 spectrophotometer (Thermo Scientific). All RNA samples had concentra-tions > 40 ng/μl and ratios within the recommended ranges (A260/280 = 1.8–2.0; A260/230 > 1.7). RNA sam-ple integrity was determined using the Agilent Bioanaly-zer Eukaryote Total RNA Nano assay (Agilent). 57/64 samples had a RNA integrity number (RIN) > 7 while the remaining 7/64 samples had a RIN ≥5 which is still acceptable for downstream qPCR analysis [12].
Custom gene expression array
Gene expression profiling of 93 genes and 3 RNA quality controls using proprietary assays (primer sequences not available) was performed using custom 384 well RT2 Pro-filer PCR array plates (Qiagen) at the Centre for Prote-omic and GenProte-omic Research (CPGR), Cape Town, South Africa. Figure2shows the 93 genes profiled in the expres-sion array grouped according to various categories which is largely based on their association with the OP-MG sub-phenotype and/or their involvement in biological pro-cesses with potential relevance to OP-MG pathogenesis.
“Muscle markers”(n= 3) includes genes which are specific to the myotranscriptome. “OP-MG genes” (n= 17) in-cludes susceptibility genes containing variants suggestive of association with OP-MG (p< 0.055) previously identi-fied by WES [10]. “OP-MG pathways” (n= 20) includes genes which are functionally related to the OP-MG genes identified by WES. These pathway candidates were se-lected largely from panels of differentially expressed genes identified through muscle expression profiling studies in passive and active transfer animal models of MG [13,14], with a particular focus on genes with differential expres-sion patterns in EOM (as opposed to limb muscle).“MG/ autoimmune”(n= 23) includes genes harboring MG asso-ciated variants identified through candidate gene and gen-ome wide association studies and genes which were differentially expressed in muscle tissue from MG patients compared to healthy controls.“EAMG”(n= 11) includes a selection of genes which were shown to be differentially expressed in experimental autoimmune MG (EAMG) across all muscle groups while“EAMG EOM” (n= 9) in-cludes a selection of genes from EAMG studies which were differentially expressed in EOM as opposed to limb muscle.
“Reference genes” (n= 10) includes a gene panel included for normalization of target gene expression levels.
Quantitative real-time PCR
control (GDC), reverse transcription control (RTC) and positive PCR control (PPC) were included for each sam-ple. All the Cqvalues for these controls were within the
acceptable reference ranges.
Selection of reference genes
Given the heterogeneity of the RNA samples (OP-MG vs control MG subphenotype, potential variability in the degree of myogenic differentiation, untreated vs MG sera
exposure) and in accordance with the Minimum Infor-mation for Publication of Quantitative Real-Time PCR Experiments (MIQE) guidelines [15], we screened a panel of 10 reference genes for their expression stability in all 64 RNA samples. These included 5 reference genes commonly used in the literature in a wide variety of tis-sue contexts (TFRC, HPRT1, B2M, ACTB, GUSB)and 5 reference genes which have validated expression stability during normal and diseased cell culture models of
Fig. 2Genes profiled in the expression array grouped according to categories. Expressed genes (Cq < 35 in all samples) are indicated in bold. “OP-MG genes”refers to genes containing OP-MG susceptibility variants and“OP-MG pathways”refers to genes in OP-MG susceptibility pathways [10], MG = myasthenia gravis, EAMG = experimental autoimmune myasthenia gravis, EOM = extraocular muscle
myogenesis (RPLP0, TBP, PPIA, CSNK2A2, AP3D1) [16, 17]. Three methods were used to comprehensively assess the stability of each reference gene: 2-Cq method [18], geNorm [19] and BestKeeper [20]. While the expres-sion of all 10 candidate reference genes was similar across all 64 samples (Cq SD < 1), subgroup analysis enabled the identification of ideal candidates which is necessary to de-tect small differences in target gene expression. The early and late muscle models were used to assess the impact of differentiation on reference gene stability. The impact of MG sera treatment on reference gene stability was per-formed separately for the early (48 h) and late (5 days) models. The results of this analysis are summarized in Additional file 1: Table S1 and Figure S1. For subpheno-type comparisons in the muscle and MG models, target gene expression levels were normalized to RPLP0 and B2M for the early model and AP3D1and CSNK2A2 for the late model. For comparisons between the early and late muscle models, target gene expression levels were normalized toGUSBandTFRC.
Data analysis
Differential CHRNA1 isoform expression in myocytes by subphenotype
CHRNA1encodes the alpha subunit of the acetylcholine receptor and is transcribed as two major muscle iso-forms (P3A+ and P3A-), which are distinguished by the inclusion or exclusion of an additional exon P3A. To de-termine the expression ratio of these twoCHRNA1 tran-scripts, standard curves were generated for two
CHRNA1 primer pairs which amplified total CHRNA1
(P3A+ and P3A-) or only the P3A+ isoform. These were used to interpolate the absoluteCHRNA1transcript num-bers and the ratio P3A+:(P3A+ and P3A-) was used to cal-culate the % P3A+ isoform expression in myocytes according to the method described by Masuda et al. [21].
Differential gene expression analysis
Raw Cq values were analysed in Microsoft® Excel for
Mac. Genes with an undetermined Cq value in≥1 sam-ple were excluded from the analysis. Differential gene expression between control MG and OP-MG was assessed independently for the four sepafrate experimen-tal models (early muscle model, early MG model, late muscle model, late MG model) according to the method described by Schmittgen and Livak [18]. Individual data points were calculated as 2-ΔCq, whereΔCq = target gene Cq – reference gene Cq. For each subphenotype group (control MG and OP-MG), the mean and SD of these data points was used to calculate a fold change in gene expression (mean OP-MG 2-ΔCq/ mean control MG 2-ΔCq). The 95% confidence interval (CI) of the fold change was calculated using the Graphpad online calcu-lator (https://www.graphpad.com/quickcalcs), which is
based on Fieller’s theorem [22]. To examine the effect of MG sera on gene expression, 2-ΔCqvalues for each group (untreated and MG sera treated) were compared accord-ing to the same method for both the early and late models. For normally distributed data the Student’s t-test was used to assess whether gene expression differences were statistically significant; unpaired two-tailed test for OP-MG vs control MG comparisons and paired two-tailed test for MG sera treated vs untreated comparisons (since the treated and untreated sample were paired for each individual). If data was not normally distributed (Shapiro-Wilk normality testp< 0.05), the Mann-Whitney test was used for comparisons. Uncorrected pvalues are presented with significance set atp< 0.05.
Differential gene correlation analysis
As a secondary analysis, and after excluding genes with an undetermined Cq value in≥1 sample, the correlation inΔCqvalues for every possible target gene pair was
de-termined for each subphenotype group (control MG and OP-MG) in each of the four separate experimental models (early muscle model, early MG model, late muscle model, late MG model) using RStudio version 1.0.136. The linear correlation between gene pairs was calculated by computing a Pearson correlation co-effi-cient (r) using the rcorr function in the Harrel Miscel-laneous (Hmisc) R package. The statistical significance of the linear correlation of gene pairs is approximated by pvalues using the t or F distributions.P-values were ad-justed using the Benjamini-Hochberg procedure (FDR < 0.01). To aid visualization of differential gene correlation by subphenotype, correlation matrices were constructed using the corrplot function in R.
Results
Gene expression in myocytes
Expressed genes were defined as those with Cq < 35 in all samples (Fig.2, indicated in bold) (see Additional file1: Table S2). The following genes were expressed in both early and late model myocytes: 3/3 muscle markers, 13/17 OP-MG genes (all selected genes excluding HLA genes), 17/20 genes in OP-MG pathways, 16/23 ‘ MG/auto-immune genes’, 10/11 EAMG genes, 7/9 EAMG (EOM) genes and 10/10 reference genes.
Myocytes express muscle specific genes
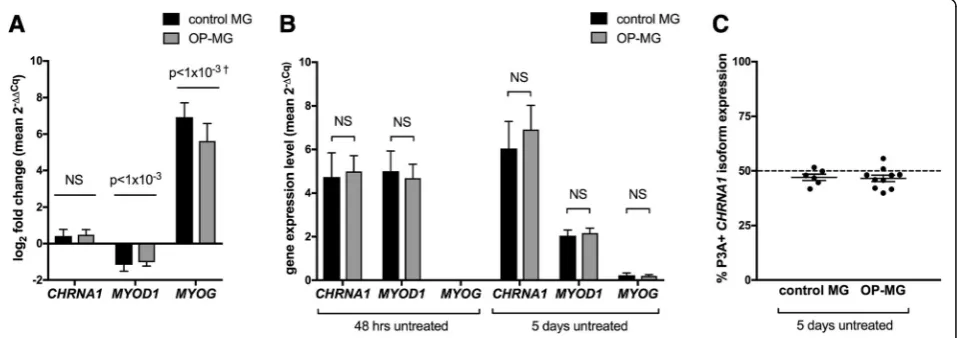
h) and late (5 days) differentiation time points. MYOD1 andMYOGencode muscle-specific transcription factors.
In keeping with the transcriptional events which or-chestrate myogenesis in vivo, myocytes express muscle specific genes which are undetectable in dermal fibro-blasts (data not shown) and show dynamic changes in expression as differentiation progresses from 48 h to 5 days: MYOD1≈2-fold downregulated (p< 1 × 10⁻³), MYOG ≈160-fold upregulated (p< 1 × 10⁻³) (Fig. 3a). Importantly, there were no differences in the expression of these three muscle specific genes between control MG and OP-MG in both the early and late models indi-cating a similar degree of myogenic differentiation in both subphenotypes) (Fig.3b).
In addition, the CHRNA1 P3A+:P3A- transcript ra-tio in both control MG and OP-MG myocytes was similar in both subphenotypes (≈50%) (Fig. 3c) and to in vivo muscle splicing patterns in normal [23] and MG samples [24].
MG sera induces gene expression changes in the myocyte model which are consistent with those in EAMG
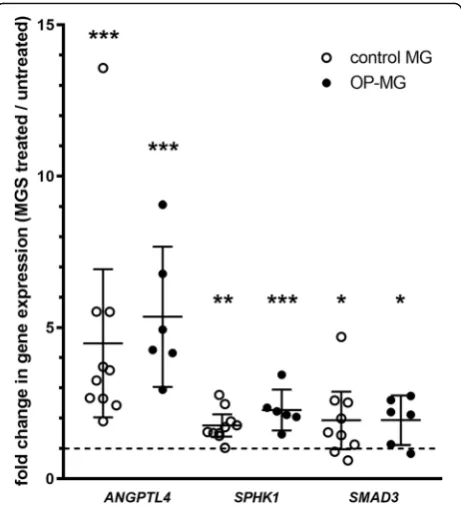
To induce MG-specific pathway responses we stimulated myocytes with 5% MG sera. The top upregulated tran-scripts (> 1.5-fold) in response to MG sera were similar in control MG and OP-MG myocytes in the early model representing 48 h differentiated myotubes treated with MG sera (ANGPTL4≈4-fold upregulated p< 1 × 10⁻³,
SPHK1≈2-fold upregulated p< 0.01, SMAD3≈2-fold upregulatedp< 0.05) (Fig.4). In previous EAMG studies, ANGPTL4was the highest upregulated transcript across 3 muscle groups (limb, diaphragm and EOM) and also expressed at the highest level in EOM [13,14]. Although
SPHK1was included in the array as an OP-MG pathway
gene, it was also found to be upregulated in EOM in EAMG models [13, 14]. Taken together, this suggests that our ‘MG model’captures some of the gene expres-sion signatures associated with EAMG and supports its use as a model to profile OP-MG pathways. In contrast, the 5-day differentiated model did not show any signifi-cant gene expression changes in response to MG sera.
Control MG and OP-MG myocytes show different gene expression profiles at basal levels and following exposure to MG sera
We found the expression of 14 genes (from all 5 gene categories) differed between OP-MG and control MG myocytes (> 1.5-fold, p≤0.041, Fig. 5 and Additional file 1: Figure S2). Seven of the 14 differentially regulated genes were either OP-MG genes (n= 4:PPP6R2, CANX,
FAM136A and FAM69A) or genes in OP-MG pathways
(n= 3: PAX3, SPTLC1,UGCG). Most differences in gene transcript levels between the two subphenotypes were de-tected in the early muscle model in response to MG sera where ACSL5, CANX, SPTLC1 and AKT2 genes
had lower expression in OP-MG myocytes compared to controls (p< 0.020) (Fig. 5).
The early MG model showed different gene expression correlations by subphenotype
In addition to identifying differences in gene expression levels between the cell models derived from the two sub-phenotypes, we also investigated whether we could dis-tinguish the two subphenotypes based on a correlation analysis of gene pair expression levels. This is relevant as differential gene co-expression, particularly in the absence of detecting differentially expressed genes, can be an in-formative signal to differentiate diseased from non-dis-eased samples [25] which may identify novel disease-related genes and pathways [26].
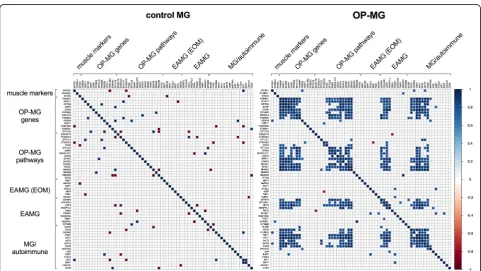
In the early MG model, we found that a subset of gene pairs (n= 328, 15%) were highly positively correlated among OP-MG samples (r > 0.77, unadjusted p< 0.01), both within and between gene categories (Fig. 6). These positive intra- and inter-correlations of gene pair expression
levels were evident as co-expression modules within a cor-relation matrix of gene pair expression levels. In contrast, control MG samples showed few, isolated, mostly negative gene pair correlations.
We applied the Benjamini-Hochberg procedure to iden-tify the most highly correlated gene pairs among OP-MG samples (n= 100, r > 0.90, FDR < 0.01). Cross-correlations between OP-MG genes, genes in OP-MG pathways and MG/autoimmune genes accounted for 59 of the gene pairs in this group (37 OP-MG gene/pathway ~ MG/auto-immune gene pairs and 22 OP-MG gene ~ OP-MG path-way gene pairs). While the high number of correlated OP-MG gene and OP-MG pathway genes is expected, the fact that a larger number of OP-MG and MG/auto-immune genes are correlated suggests that significant crosstalk exists between OP-MG and MG pathways. For example, correlations between OP-MG susceptibility genes (CANX, DDX17, TGFB1) and MG genes (TNIP1, AKT1) accounted for the top three significantly correlated gene pairs (r≥0.98,p< 1 × 10⁻⁶).
Discussion
Because of the difficulties in obtaining EOM tissue, we de-veloped an in vitro muscle model, at two differentiation time points, to compare MG subphenotype-specific
‘myo’-transcriptomic responses to active MG sera by in-terrogating the expression of previously reported OP-MG genes and genes in related pathways. The early differenti-ation model (48 h) exhibited“myoblast type”gene expres-sion patterns (high levels of MYOD1) while the late differentiation model (5 days) model exhibited “myocyte type”gene expression patterns (low levels ofMYOD1and high levels ofMYOGwhich induces the expression of ter-minal differentiation genes) [27]. Using these models we found evidence of different muscle transcript expression dynamics between the OP-MG and control MG derived myocytes which could represent functional differences in gene expression networks.
We detected expression differences in four OP-MG genes (identified by WES) between OP-MG and control MG myocytes (Fig. 5; Additional file 1: Figure S2):
PPP6R2 and CANX in the early model and FAM136A
and FAM69A in the late model. These genes harbour
putative 3’UTR OP-MG susceptibility variants which may alter microRNA binding in OP-MG subjects to ei-ther increase or decrease their expression levels. Not-ably, OP-MG genes were prioritised based on their expression in EOM since the OP-MG subphenotype spe-cifically involves EOM rather than limb muscle. It may be reasonable to conclude that our model may not have been adequate to capture differences in the expression of other OP-MG genes if this is only altered in the unique EOM transcriptome. Similarly, of the EAMG (EOM) genes included in the array due to their
Fig. 6Correlation between gene pair expression levels differs in control MG and OP-MG myocytes. For expressed genes (n= 66), the correlation inΔCqvalues for every possible target gene pair was determined for each subphenotype group (control MG and OP-MG) in the early MG model using the Pearson correlation co-efficient (r). Statistically significant correlations (unadjustedp< 0.01) are shown as a matrix. The color key indicates the strength of positive (blue gradient) and negative (red gradient) correlations. Genes are grouped according to their selection category for the custom qPCR array
differential expression in EOMs in experimental MG models [13, 14], only one (ACSL5) showed significant changes in gene expression between the OP-MG and control MG myocytes in response to MG sera. Overall, the most informative model was the early muscle model (48 h differentiation) in response to MG sera, which showed more gene expression differences between the two subphenotypes than the late model. This may sug-gest that early myogenesis regenerative events are im-paired in OP-MG individuals following MG induced muscle damage.
Human EOMs, compared to other skeletal muscles, have significantly more mitochondria due to their energy requirements. In the early model the expression of UCP3, which encodes a mitochondrial uncoupling pro-tein, was significantly downregulated in OP-MG com-pared to control MG myocytes. UCP3 may reduce the production of reactive oxygen species (ROS) and protect mitochondria under conditions of EAMG [13] which suggests that lower basal levels of UCP3 in OP-MG myocytes may impair this protective mechanism.
We previously interrogated CD55 (DAF) due to its critical role in muscle endplate damage in myasthenia [28] and its relatively lower expression in the EOMs compared to limb muscle [3,28]. Here we found an up-regulation of CD55 expression in OP-MG myocytes compared to control MG which was similar to our pre-vious observations in lymphoblastoid cell lines from the two subphenotypes; however, previously we showed that CD55 was significantly repressed in response to lipopoly-saccharide (representing an immune stimulus) in OP-MG derived cells [7].
Despite the limitation of not having EOMs to interro-gate, we found in OP-MG myocytes, but not control MG, different patterns of gene co-expression (inferred from expression correlation) between the unbiased OP-MG genes/ OP-MG pathways and genes known to be involved in MG/autoimmune and EAMG pathways. For example, 53% (16 of 30) of the expressed OP-MG genes showed significant cross-correlations of expression levels (FDR < 0.01) with 42% (11 of 26) of the EAMG and MG/autoimmune genes in OP-MG myocytes (Fig.6). This observation of gene expression correlation across a group of individuals (such as OP-MG cases) may suggest that these genes are functionally related [24], perhaps within the same pathway(s).
For presentation of the gene co-expression data, we grouped genes in the matrix (Fig. 6) by biological func-tion or pathway. For example, ST8SIA1 and SPTLC3 (OP-MG genes identified in our previous WES study [10]) encode enzymes involved in gangliosphingolipid biosynthesis and as such they were grouped with other candidates in this pathway. This visual organisation highlighted the fact that genes in the same pathway were
strongly correlated in OP-MG, but not control MG. Al-though gangliosphingolipids are not known to play a role in MG they are critical in maintaining the integrity of the muscle endplate through their formation of lipid rafts which stabilize membrane bound receptors and sig-naling molecules such as AChR [29], GP130 (or IL6ST) [30], CD55 (DAF) and CD59 [31, 32]. The initial reac-tion in sphingolipid synthesis requires the enzyme serine palmitoyltransferase (SPT) which is encoded bySPTLC1, SPTLC2, and SPTLC3 genes. Interestingly, SPTLC1 ex-pression was lower in OP-MG compared to control MG myocytes which may suggest that the sphingolipid syn-thesis pathway is impaired in OP-MG myocytes in re-sponse to MG sera.
Several genes related to IGF1-signalling were included in the array as this pathway has already been implicated in MG [33], though not specifically considered in the pathogenesis of EOM involvement in MG. Interestingly, the expression of OP-MG genes strongly correlated with several genes from this pathway (IGF1,AKT1,AKT2).
Since we used a transdifferentiation model, the snap-shot of the myotranscriptome obtained in both the muscle- and MG-models may not accurately capture the biological signal or the magnitude of putative signals of altered gene/pathway function in OP-MG EOMs, even if the effect sizes are substantial. Nevertheless, the MG-muscle model showed expression differences in sev-eral functionally related genes between OP-MG and controls which provides a basis for exploring these puta-tive pathogenic pathways in future work.
Conclusion
Using a surrogate cell culture model our findings suggest that muscle gene expression and co-expression differ be-tween OP-MG and control MG individuals in response to MG sera. These findings implicate pathways not pre-viously considered in extraocular muscle involvement in myasthenia gravis and will inform future studies.
Additional file
Additional file 1:Supplementary notes.Table S1.Summary of algorithms used to assess reference gene expression stability in myocytes. (I) untreated myocytes at early and late differentiation time points, (II) early untreated and MG sera (MGS) treated myocytes and (III) late untreated and MGS treated myocytes.Figure S1.Comparison of reference gene expression between the early and late muscle and MG models.Table S2.Statistical analysis of differentially expressed genes: Average Cq values and assessment of data distribution (normality testing) for differentially expressed genes.Figure S2.Additional genes with statistically significant (p<0.05) expression differences between OP-MG and control MG myocytes. (DOCX 436 kb)
Abbreviations
digitorum longus; EOMs: Extraocular muscles; FACS: Fluorescence-activated cell sorting; FDR: False discovery rate; GFP: Green fluorescent protein; HLA: Human leukocyte antigen; MG: Myasthenia gravis; MIQE: Minimum information for publication of quantitative real-time PCR experiments; OP-MG: Ophthalmoplegic myasthenia gravis; P/S: Penicillin streptomycin; qPCR: Quantitative PCR; RIN: RNA integrity number; ROS: Reactive oxygen species; SD: Standard deviation; WES: Whole exome sequencing
Acknowledgements
The authors wish to thank Prof Jennifer Morgan (UCL) for her technical advice in establishing the muscle model.
Funding
This study was jointly funded by the French Muscular Dystrophy Association (AFM Téléthon) grant number 20049 (JMH), the National Research Foundation of South Africa (JMH, SP) and the South African Medical Research Council (JMH).
Availability of data and materials
The datasets used and/or analyzed during the current study are available from the corresponding author on reasonable request.
Authors’contributions
MN contributed to the study design and performed the laboratory work, data analysis and drafting of the manuscript. SP supervised the laboratory work and revised the manuscript. JMH contributed to the conception and design of the study, the analysis and interpretation of the data and revised the manuscript. All authors read and approved the final manuscript.
Ethics approval and consent to participate
Ethics approval for this study was obtained from the University of Cape Town Health Sciences Faculty Research Ethics committee (REC 257/2012) and all individuals (or their parents if < 18 years) signed informed consent to participate.
Consent for publication
Not applicable
Competing interests
The authors declare that they have no competing interests.
Publisher’s Note
Springer Nature remains neutral with regard to jurisdictional claims in published maps and institutional affiliations.
Author details
1Neurology Research Group, Division of Neurology, E8-30, New Groote
Schuur Hospital, Department of Medicine, Faculty of Health Sciences, University of Cape Town, Cape Town 7925, South Africa.2Department of Human Biology, Faculty of Health Sciences, University of Cape Town, Cape Town 7925, South Africa.3Division of Neurology, E8-74, New Groote Schuur
Hospital, Department of Medicine, Faculty of Health Sciences, University of Cape Town, Cape Town 7925, South Africa.
Received: 20 April 2018 Accepted: 21 January 2019
References
1. Rautenbach RM, Pillay K, Murray ADN, Heckmann JM. Extraocular muscle findings in myasthenia gravis associated treatment-resistant
Ophthalmoplegia. J Neuro-Ophthalmology. 2017;37:414–7.
2. Europa TA, Nel M, Heckmann JM. Myasthenic ophthalmoparesis: time to resolution after initiating immune therapies. Muscle Nerve. 2018;58:542–9. 3. Soltys J, Gong B, Kaminski HJ, Zhou Y, Kusner LL. Extraocular muscle
susceptibility to myasthenia gravis: unique immunological environment? Ann N Y Acad Sci. 2008;1132:220–4.
4. Mombaur B, Lesosky MR, Liebenberg L, Vreede H, Heckmann JM. Incidence of acetylcholine receptor-antibody-positive myasthenia gravis in South Africa. Muscle Nerve. 2015;51:533–7.
5. Heckmann JM, Nel M. A unique subphenotype of myasthenia gravis. Ann N Y Acad Sci. 2018;1412:14–20.
6. Heckmann JM, Hansen P, Van Toorn R, Lubbe E, Janse van Rensburg E, Wilmshurst JM. The characteristics of juvenile myasthenia gravis among south Africans. South African Med J. 2012;102:532–6.
7. Heckmann JM, Uwimpuhwe H, Ballo R, Kaur M, Bajic VB, Prince S. A functional SNP in the regulatory region of the decay-accelerating factor gene associates with extraocular muscle pareses in myasthenia gravis. Genes Immun Nature Publishing Group. 2010;11:1–10.
8. Nel M, Buys J, Rautenbach R, Mowla S, Prince S, Heckmann JM. The African-387 C>T TGFB1 variant is functional and associates with the ophthalmoplegic complication in juvenile myasthenia gravis. J Hum Genet Nature Publishing Group. 2016;61:307–16.
9. Cocuzzi ET, Bardenstein DS, Stavitsky A, Sundarraj N, Medof ME. Upregulation of DAF (CD55) on orbital fibroblasts by cytokines. Differential effects of TNF-beta and TNF-alpha. Curr Eye Res. 2001;23:86–92.
10. Nel M, Jalali Sefid Dashti M, Gamieldien J, Heckmann JM. Exome sequencing identifies targets in the treatment-resistant ophthalmoplegic subphenotype of myasthenia gravis. Neuromuscul Disord. 2017;27:816–25.
11. Fischer MD, Budak MT, Bakay M, Gorospe JR, Kjellgren D, Pedrosa-Domellöf F, et al. Definition of the unique human extraocular muscle allotype by expression profiling. Physiol Genomics. 2005;22:283–91.
12. Fleige S, Pfaffl MW. RNA integrity and the effect on the real-time qRT-PCR performance. Mol Asp Med. 2006;27:126–39.
13. Zhou Y, Kaminski HJ, Gong B, Cheng G, Feuerman JM, Kusner L. RNA expression analysis of passive transfer myasthenia supports extraocular muscle as a unique immunological environment. Investig Ophthalmol Vis Sci. 2014;55:4348–59.
14. Kaminski HJ, Himuro K, Alshaikh J, Gong B, Cheng G, Kusner LL. Differential RNA expression profile of skeletal muscle induced by experimental autoimmune myasthenia gravis in rats. Front Physiol. 2016;7:524.
15. Bustin SA, Benes V, Garson JA, Hellemans J, Huggett J, Kubista M, et al. The MIQE guidelines: minimum information for publication of quantitative real-time PCR experiments. Clin Chem. 2009;55:611–22.
16. Stern-Straeter J, G a B, Hörmann K, Kinscherf R, Goessler UR. Identification of valid reference genes during the differentiation of human myoblasts. BMC Mol Biol. 2009;10:66.
17. Hildyard JCW, Wells DJ. Identification and Validation of Quantitative PCR Reference Genes Suitable for Normalizing Expression in Normal and Dystrophic Cell Culture Models of Myogenesis. PLoS Curr. 2014;6:1–23. 18. Schmittgen TD, Livak KJ. Analyzing real-time PCR data by the comparative
CT method. Nat Protoc. 2008;3:1101–8.
19. Vandesompele J, De Preter K, Pattyn F, Poppe B, Van Roy N, De Paepe A, et al. Accurate normalization of real-time quantitative RT-PCR data by geometric averaging of multiple internal control genes. Genome Biol. 2002;3: RESEARCH0034.
20. Pfaffl MW, Tichopad A, Prgomet C, Neuvians TP. Determination of stable housekeeping genes, differentially regulated target genes and sample integrity: BestKeeper--excel-based tool using pair-wise correlations. Biotechnol Lett. 2004;26:509–15.
21. Masuda A, Shen X-M, Ito M, Matsuura T, Engel AG, Ohno K. hnRNP H enhances skipping of a nonfunctional exon P3A in CHRNA1 and a mutation disrupting its binding causes congenital myasthenic syndrome. Hum Mol Genet. 2008;17:4022–35.
22. Fieller EC. The biological standardization of insulin. Suppl to J R Stat Soc. 1940;7:1–64.
23. MacLennan C, Beeson D, Vincent A, Newsom-Davis J. Human nicotinic acetylcholine receptor alpha-subunit isoforms: origins and expression. Nucleic Acids Res. 1993;21:5463–7.
24. Guyon T, Levasseur P, Truffault F, Cottin C, Gaud C, Berrih-Aknin S. Regulation of acetylcholine receptor alpha subunit variants in human myasthenia gravis. Quantification of steady-state levels of messenger RNA in muscle biopsy using the polymerase chain reaction. J Clin Invest. 1994;94:16–24.
25. Ho JWK, Stefani M, Dos Remedios CG, Charleston MA. Differential variability analysis of gene expression and its application to human diseases. Bioinformatics. 2008;24:390–8.
26. Choi JK, Yu U, Yoo OJ, Kim S. Differential coexpression analysis using microarray data and its application to human cancer. Bioinformatics. 2005;21:4348–55.
27. Bentzinger CF, Wang YX, M a R. Building muscle: molecular regulation of myogenesis. Cold Spring Harb Perspect Biol. 2012;4:1–16.
29. Gallegos CE, Pediconi MF, Barrantes FJ. Ceramides modulate cell-surface acetylcholine receptor levels. Biochim Biophys Acta. 2008;1778:917–30. 30. Yanagisawa M, Nakamura K, Taga T. Roles of lipid rafts in
integrin-dependent adhesion and gp130 signalling pathway in mouse embryonic neural precursor cells. Genes Cells. 2004;9:801–9.
31. Ohmi Y, Tajima O, Ohkawa Y, Mori A, Sugiura Y, Furukawa K, et al. Gangliosides play pivotal roles in the regulation of complement systems and in the maintenance of integrity in nerve tissues. PNAS. 2009;106:22405–10. 32. Ohmi Y, Tajima O, Ohkawa Y, Yamauchi Y, Sugiura Y, Furukawa K, et al.
Gangliosides are essential in the protection of inflammation and neurodegeneration via maintenance of lipid rafts: elucidation by a series of ganglioside-deficient mutant mice. J Neurochem. 2011;116: 926–35.

![Fig. 2 Genes profiled in the expression array grouped according to categories. Expressed genes (Cq < 35 in all samples) are indicated in bold.“OP-MG genes” refers to genes containing OP-MG susceptibility variants and “OP-MG pathways” refers to genes in OP-MG susceptibility pathways[10], MG = myasthenia gravis, EAMG = experimental autoimmune myasthenia gravis, EOM = extraocular muscle](https://thumb-us.123doks.com/thumbv2/123dok_us/757177.1572580/4.595.59.537.88.300/expression-categories-expressed-containing-susceptibility-susceptibility-experimental-extraocular.webp)