An Integrated Algorithm of Spatial Fuzzy
C-Means Clustering and Level Set for Indoor
Scene Image Segmentation
Jili Lu
School of Mechanical Engineering, Shandong University, Jinan, Shandong 250061, China; School of Mechanical and Electronic Engineering, Zaozhuang University, Zaozhuang 277160,China
Email: [email protected]
Mingxing Lin, Qingdong Wang, Yan Huang
School of Mechanical Engineering, Shandong University, Jinan, Shandong 250061, China Email:[email protected], [email protected],[email protected]
*Corresponding author: Mingxing Lin Email: [email protected]
Abstract—Traditional fuzzy clustering algorithm is applicable for noiseless image segmentation. However, it is powerless for the images with noise, special point values and defects. An algorithm which combines spatial fuzzy clustering and level set for indoor scene segmentation is proposed in this paper. Firstly, the image is classified using fuzzy clustering with space information to get a larger difference in image gray level; secondly, the image is segmented using level set; finally, the contour in the boundary of target area is gotten accurately. The improved method can not only preserve details of images but also reduce the number of iterations. The results show that the proposed method has good segmentation quality and efficiency in segmentation for indoor scene image.
Index Terms— spatial fuzzy c-means cluster; level set; indoor scene; image segmentation; fusion
I. INTRODUCTION
Indoor scene image understanding plays an important role in intelligent engineering especially for mobile robot to perform a specific task. However, the segmentation of indoor scene image is the first and significant step of indoor scene understanding. Image segmentation technology separates the target area which people interested in and prepares for the subsequent feature extraction, pattern recognition, and so on. The existing segmentation error may lead to the failure of high-level image processing, so the accuracy and the speed of segmentation are regarded as a bottleneck in the development of computer vision.
It is very difficult to segment indoor scene images accurately because of their unique complexity. Researches were done much in this area. Edge detection
[1-3] and region segmentation [4] are two types of image segmentation methods. In image segmentation, gray differential is a basis for edge detection, such as gradient operator, Sobel operator, LoG operator, Roberts operator and Canny operator [5,6], and so on. In region segmentation, image is separated into K connectivity domains based on the consistency in internal region and the differences between various regions. These techniques include: threshold segmentation, regional growth, regional separation and mergers [7]. These methods achieved certain effects, but as for segmentation of image with more speckle noise, they often failed to get satisfactory results because of their poor anti-noise ability.
In recent years, scholars did further researches on image segmentation employed artificial neural network (ANN), wavelet transform, fuzzy clustering, genetic algorithms, mathematical morphology and other new theories and techniques[8-11], furthermore, good segmentation results were obtained by combining the foregoing segmentation methods. However, there is still not a complete theoretical system in image segmentation and the segmentation results also need to be improved.
which integrated the improved space fuzzy c-means clustering algorithm (SFCM) and the level set, combining the advantages of these two algorithms for indoor scene image segmentation.
The rest of the paper is organized as follows. In Section II, the principles of the SFCMLS algorithm were explained including fuzzy c-means clustering with special information, level set, the fusion of these two algorithms and the specific computational steps. In Section III, four groups of experiments were carried out from different perspectives using the algorithm. The corresponding results were presented and discussed in details. In Section IV, a conclusion was made about the algorithm of SFCMLS.
II.ALGORITHM
A. Space Fuzzy C-means Clustering Algorithm (SFCM) In the FCM algorithm, suppose the image
X
=
x x
1, , ,
2"
x
nis divided into a number ofc-means clusters according to the pixel values. The value function CF is defined as follows:
2 1 1
N C m
ij j i
j i
CF=
∑ ∑
= =u x −v (1)Here,
x
j is the gray value of thej
th pixel,v
i is thevalue of the cluster center,
u
ijrepresents the degree ofmembership which pixel
x
j belongs to thei
th cluster,m
represents the fuzzy weighting exponent. In FCM algorithm, it completely depends on the distance between the target pixel of characteristic domain and the cluster center point. Membership function and the cluster center point were improved as follows:(
)
21 1
1
Q mij k j i j k
u
x
v
x
v
−=
=
∑
−
−
(2)1 1
N m N m
i j ij j j ij
v
=
∑
=u x
∑
=u
(3)First, a number of points were selected randomly as the initial cluster center, when the local minimum of
v
i or asaddle point of the value function was obtained by comparing membership function values in the iteration, the iteration was ended.
Traditional FCM method has disadvantages such as sensitive to noise and easy to fall into local minimum value. To reduce these problems, spatial information was considered in the following algorithm.
Neighboring pixels of an image often have high correlation, that is, neighboring pixels have similar attribute values, which indicate that these pixels most likely belong to a same cluster. Ahmed[14] proposed a method by modifying the objective function of the standard fuzzy c-means to reduce the influence of noise. Based on this, Keh-Shih Chuang[15] proposed a modified fuzzy c-means clustering method with incorporating spatial information into the membership function.
To make good use of the spatial information in an
image for segmentation, the spatial function is defined as follows:
(x )j
ij ik
k NB
h
u
∈
=
∑
(4)(x )j
NB represents a square area with pixel
x
j asthe center of the spatial domain, here a 5x5 square area is used in this paper. Similar to the membership function, spatial function
h
ij represents the membership whichthe pixel
x
j belongs to thei
th cluster center. Thevalue of spatial functions is larger when the pixels around a certain point belong to the same cluster. The equation combining the membership function and spatial function is shown as following:
1
'
=
p q∑
Q= p q ij ij ij k kj kju
u h
u h
(5)p
andq
are two important parameters in the function. In a cluster domain, spatial function simply enhances the original membership while the clustering results remain the same. However, equation (5) can reduce the weight of noise pixel by highlighting its adjacent pixels. Therefore, it is easy to rectify the pixels in noise area or points misclassified of defective area.Two clustering processes are required in each iteration step. The first clustering process is calculating membership function values in the spectral domain, which is as same as the traditional FCM algorithm. The membership information of each pixel is mapped to the spatial domain in the second process to calculate the value of spatial function. Therefore, a new degree of membership embedded in the spatial information function is calculated by the improved FCM algorithm. The iteration of FCM is terminated if the function value change of the clusters center is smaller than a certain threshold after two iterations. Consequently local minimum is avoided in the iterative process. After the clustering center is determined, each pixel is classified to the cluster with the maximum degree of membership by using fuzzy clustering method.
B. Level Set
Given
φ
(x, y, t)
as a continuous level set function, closed curvesC
(p, t)
as the zero level set curve corresponding to t moment, there is equation(6):( , ) {(x, y) (x, y, t) 0} ( ,0) {(x, y) (x, y,0) 0} C p t
C p
φ φ
⎧ = =
⎨ = =
⎩ (6)
Assume that
φ
(x, y,0)
= ±
d
,the parameterd
is the signed distance from pixel(x, y)
to the curve( ,0)
C p . It is defined that if the point
(x, y)
is on the closed curveC p
( ,0)
, thend
is 0; while point(x, y)
is inside the curve,d
is positive; otherwised
is negative. Therefore, if curveC p
( ,0)
is the zero level set of functionφ
(x, y, t)
in any condition, then:(C(t), t) 0
φ
= (7) The perfect differential of equation (7) is( , ) 0
d x y dt t t t
φ
= ∂φ
+ ∇φ
∂ ∂ =∂ ∂ ∂ (8)
The inward unit normal vector of level set curve is:
N φ
φ
∇ = −
∇ (9)
Assuming
F
represents the speed of outer normal direction, there is:C
N f
t
∂ ⋅ =
∂ (10)
Then equation (8) can be rewritten as:
F t
φ
φ
∂ = ∇
∂ (11)
The expression of curvature
k
is obtained by calculating quadratic differential of arc length according to level set functionφ
:(
)
2 2
3 2 2 2 2
xx y x y xy yy x
x y
k
φ
φ φ
φ φ φ
φ φ
φ
φ φ
− +
∇ = ∇⋅ =
∇ + (12)
The moving direction of the curve varies according to different curvature: some extend outside while the others extend inward. If F satisfies the smooth conditions that
(x, y, t)
φ
can be maintained as a valid function, the evolution curve C can split and merge various topology changes with the evolution ofφ
.C. Fusion of SFCM and Level Set
Given the original image
u
(x, y)
is divided into two target regionsΩ
inandΩ
out by active contour C, andthe average gray level of each region is Cinand
C
out.The energy functional is established as following
according to spatial fuzzy clustering algorithm embedded curveC:
2 2
(C) (C) (C)
in out
in out
in out
F F F
u C dxdy u C dxdy
Ω Ω
= +
=
∫
− +∫
− (13)It can be seen that F(C) reaches a minimum when
closed active contour C lies in the boundary C0 of the
two homogeneous regions. In order to regularize the level set curve, the energy function for image segmentation is obtained by adding regular items as curve length, area inward curve etc. it is as following:
2 1
2 2
( ,C ,C ) ( ) ( )
( ) (1 ( ))
φ μ δ φ φ ν φ λ φ λ φ Ω Ω Ω Ω = ∇ + + − + − −
∫
∫
∫
∫
in out in outF dxdy H dxdy
u C H dxdy
u C H dxdy
(14)
Here, Ω is the definition domain of the entire image, the first item is the length of closed contour line C, the second item is the internal area of C,
μ λ λ
, , ,
1 2v
≥
0
is the weight coefficient of each energy item. The position of segmentation contour line C, unknownC
in andout
C
can be obtained eventually. (x, y) H ( )dxdyH ( )dxdy
in u C ε ε φ φ Ω Ω =
∫
∫
,(x, y)(1 H ( ))dxdy (1 H ( ))dxdy
out u C ε ε φ φ Ω Ω − = −
∫
∫
(15)D. Specific Algorithm Steps
Step 1: Input indoor scene image and filtered with 5*5 wiener;
Step 2: Determine the classification number and the weighted index;
Step 3: Calculate the neighborhood information value of each pixel using (4);
Step 4: Calculate
u
ij'
with spatial information using(5), substitute
u
ij'
into (3),v
i'
will be obtained;Step 5: Iteration if the algorithm result is not convergence, takes the membership degree and the clustering center as the initial result, and go to step 3.
Step 6: Initial indoor scene image into two parts according to the result of step 5, one of the symbolic distance function is initialized to 1, and the other is initialized to -1, and set the initial parameter values;
Step 7: Calculate
C
inandC
out using (15);Step 8: Evolution the level set function using (14); Step 9: Iteration if the result is not convergence and go to step 6, otherwise stop the iteration and get the contour.
III. RESULTS AND ANALYSIS
environment. The indoor scene images were segmented respectively. Objects were chosen on the principle from simple to complex which often used commonly in indoor scene such as chair, cup, desk, flower, computer table and sitting room.
A10 A11 A12 A13
B10 B11 B12 B13
C10 C11 C12 C13
D10 D11 D12 D13
E10 E11 E12 E13
F10 F11 F12 F13
G10 G11 G12 G13
Figure 1. Indoor scene images segmentated with different methods
The experiment is divided into four groups. The first group is compared with different methods of images segmentation such as Otsu and FCM. The second group is images segmented using the SFCMLS proposed in this article with different iterations. The third group is about sitting room image segmented in 3-cluster using SFCMLS. The fourth group is indoor scene image segmented using different parameters.
Fig.1 shows the segmentation results using different methods. The first column are the original indoor scene
images, the second column are images segmented by Otsu, the third column are images segmented by FCM, the fourth column are images segmented by SFCMLS. The used segmentation threshold level and iteration number is shown in Table 1
TABLE1.
SEGMENTATION LEVEL AND ITERATION NUMBER USED IN FIG.1 Index Name Ostu level level Fcm iterationsSfcmls
A10 chair 0.545098 0.44598 700 B10 cup 0.725490 0.785141 700 C10 desk 0.686275 0.834764 700 D10 flower 0.643137 0.743137 700 E10 Computertable1 0.611765 0.786275 700 F10 Computertable2 0.662745 0.790196 700 G10 Sitting room 0.529412 0.417647 700
It can be seen that Otsu method is sensitive to noise and target size, images with unimodal interclass variance have good segmentation in A10, B10 and C10, not good in D10, E10 and F10. FCM method has good performance, but it is sensitive to initial parameters and time-consuming. However, SFCMLS method has not only good performance but also high efficiency, especially in a bit complex indoor scenes.
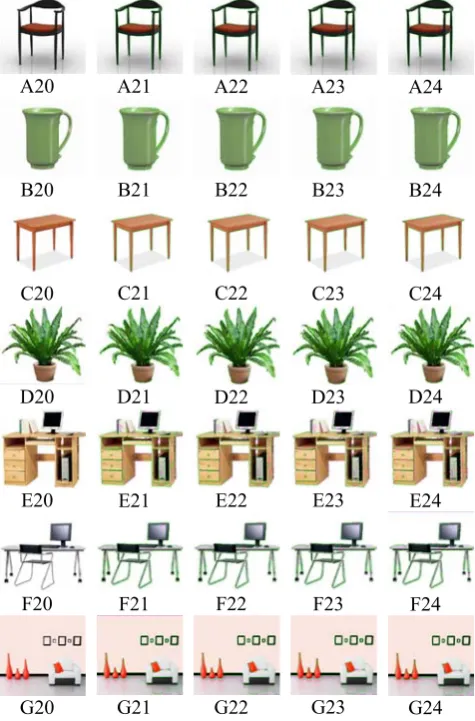
Fig.2 shows the results of indoor scene images segmentation using SFCMLS proposed in this paper. The parameters used in the experiment in Fig.2 are μ=0.1,
λ=2, τ=1, ν=-1. The magenta line represents the initial while the green line represents the final results after iterations. The first column is the original images; the second column is the results after 100 iterations; the third column is the results after 500 iterations; the fourth column is the results after 1000 iterations; the fifth column is the results after 2000 iterations. Taking G20 as example, to get G21 it took about 7.964 seconds, to get G22 it took about 38.392 seconds, to get G23 it took about
A20 A21 A22 A23 A24
B20 B21 B22 B23 B24
C20 C21 C22 C23 C24
D20 D21 D22 D23 D24
E20 E21 E22 E23 E24
F20 F21 F22 F23 F24
G20 G21 G22 G23 G24
Figure 2. Indoor scene images segmented using SFCMLS with different iterations
Fig.3 shows the sitting room image segmented in 3-cluster by the SFCMLS method with 100 iterations. The magenta line represents the initial while the green line represents the final results after iterations. G30 is the original sitting room image, and the rest of 3 images are the segmentation results. The iteration time is 8.696889 seconds, 8.555509 seconds and 8.969633 seconds respectively. G31 has the best segmentation result while G32 and G33 can only reflect partial information with about the same time. Therefore, the choice of clustering is very important. However, in this paper the cluster is chosen manually.
Figure 3. Sitting room image segmented with 3-cluster using SFCMLS
In Fig.4, G41 to G49 are the sitting room segmentation results with the fuzzy threshold changed from 0.1 to 1 with the step of 0.1, 100 iterations . The results show that with the threshold increasing, the zero level set goes farther away from the actual line and the independent block becomes adhesion.
G40 G41 G42 G43 G44
G45 G46 G47 G48 G49
Figure 4. Sitting room image segmented with different fuzzy threshold using SFCMLS
0 5 10 15 20 25 30 35
0.1 0.2 0.3 0.4 0.5 0.6 0.7 0.8 0.9 Fuzzy Threshold
Ti
m
e a
nd
La
m
bd
a
3000 3050 3100 3150 3200 3250 3300 3350 3400 3450
In
itia
l C
onto
ur
time lambda initial contour
Figure 5. The change of various values with different fuzzy threshold
Fig.5 shows that the iteration time elapses from the longest on threshold 0.1 with time 9.910118 down to the shortest on threshold 0.4 with time 7.759954 and then goes up on threshold 0.5 subsequently down, which presents a double-dip. However, the initial contour becomes smaller and smaller with the bigger fuzzy threshold and there is no contour when the threshold is 1.So the fuzzy threshold must be set less than 1.
G61 G62 G63 G64 G65
Figure 6. Indoor scene image segmented with different ε
Fig.6 shows the indoor scene image segmentation using
SFCMLS with different ε (Dirac regulator). G61 to G65 are segmented with ε changed from 0.5 to 2.5 with the step of 0.5, 100 iterations. It has no influence on initial curve, but can impact the evolution of the segmentation curve, the segmentation result is bad with ε of 0.5, can not correctly distinguish between boundary points, and the time is 10.057 seconds. The segmentation result is better with the parameter ε of 1.5 and time is 8.853 seconds. The time is 143.208 seconds with the ε of 1.5. However, with the increase of ε values the segmentation result is not better while the time grow faster. So parameter ε can be chosen as 1.5.
IV CONCLUSIONS
Fuzzy clustering and level set are two important methods of image segmentation. In fuzzy clustering, a new level set function is constructed using membership functions embedded spatial information, and a variational
level set energy functional model is established. In the paper these two kinds of ways are fused together effectively. Target object is extracted by minimizing the energy functional with the variational method. The model combines advantages of each method with advantages such as automatic topology changes, insensitive to the initialization, etc. It can get a good evolution of the efficiency and the high quality of image segmentation, improves the robustness and accuracy of the algorithm. So it suits for indoor scene image segmentation.
ACKNOWLEDGMENT
The authors gratefully acknowledge the support of the indoor science foundation of Shandong Province (ZR2010EM037), the scientific research foundation for the returned overseas Chinese scholars, Sate Education Ministry.
REFERENCES
[1] Chaudhary A, Gulati T. Segmenting digital images using edge detection [J]. methods, 2013, 2(5):319-323.
[2] Ju Z, Zhou J, Wang X, et al. Image segmentation based on adaptive threshold edge detection and mean shift[C]//Software Engineering and Service Science (ICSESS), 2013 4th IEEE International Conference on. IEEE, 2013: 385-388.
[3] He J, Hou L, Zhang W. A kind of fast image edge
detection algorithm based on dynamic threshold value [J]. Sensors & Transducers, 2013, 24(8):179-183.
[4] Brendel W, Todorovic S. Video object segmentation by
tracking regions[C]//Computer Vision, 2009 IEEE 12th International Conference on. IEEE, 2009: 833-840.
[5] Maini R, Aggarwal H. Study and comparison of various
image edge detection techniques [J]. International Journal of Image Processing (IJIP), 2009, 3(1): 1-11.
[6] Bansal B, Saini J S, Bansal V, et al. Comparison Of
Various Edge Detection Techniques [J]. Journal of Information and Operations Management, 2012, 3(1): 103-106.
[7] Garcia Ugarriza L, Saber E, Vantaram S R, et al.
Automatic image segmentation by dynamic region growth and multiresolution merging [J]. Image Processing, IEEE Transactions on, 2009, 18(10): 2275-2288.
[8] Suvarna M, Kumar K, Niranjan U C. Diagnosis of Burn
Images using Template Matching, k-Nearest Neighbor and Artificial Neural Network[J]. International Journal of Image Processing (IJIP), 2013, 7(2): 191.
[9] Senthilkumaran N, Rajesh R. Edge detection techniques for image segmentation–a survey of soft computing approaches J]. International Journal of Recent Trends in Engineering, 2009, 1(2): 250-254.
[10] Yang Z, Chung F L, Shitong W. Robust fuzzy
clustering-based image segmentation [J]. Applied Soft Computing, 2009, 9(1): 80-84.
[11] Ma W, Ti F, Li C, et al. Image segmentation based on differential immune clone clustering algorithm[J]. International Journal of Intelligent Computing and Cybernetics, 2013, 6(1): 83-102.
[12] Tan K S, Lim W H, Isa N A M. Novel initialization
scheme for Fuzzy C-Means algorithm on color image segmentation [J]. Applied Soft Computing, 2013, 13(4): 1832-1852.
[13] Radhika V, Padmavathi G. Segmentation of oil spill
images using improved FCM and level set methods [J].
International Journal on Computer Science and Engineering, 2011, 3(7): 2786-2791.
[14] Ahmed M N, Yamany S M, Mohamed N, et al. A
modified fuzzy c-means algorithm for bias field estimation and segmentation of MRI data [J]. Medical Imaging, IEEE Transactions on, 2002, 21(3): 193-199.
[15] Chuang K S, Tzeng H L, Chen S, et al. Fuzzy c-means
clustering with spatial information for image segmentation[J]. computerized medical imaging and graphics, 2006, 30(1): 9-15.
[16] Osher S, Sethian J A. Fronts propagating with
curvature-dependent speed: algorithms based on Hamilton-Jacobi formulations [J]. Journal of computational physics, 1988, 79(1): 12-49.
Jili Lu was born in 1979. She received
the M.S in Agricultural Mechanization and Automation from Shandong Agricultural University, Taian, China, in 2005, the B.S. in Agricultural Mechanization Engineering, Shandong Agricultural University, Taian, China, in 2002. Her major field of study is mechanical & electrical integration and machine learning.
At present she is a Ph.D student of Shandong University, Jinan, China. She has many publications, such as: A cutting line positioning and defects detection system for polyurethane plate based on computer vision, 2012, Trans tech publications;An online surface defects detection system for step-axis,2012, Trans tech publications, et al. Her current research interest is image understanding.
Mingxing Lin was born in 1966. He
received the M.S from Department of Mechanical Engineering, China Mining University, Xuzhou,China, in 1985; and the B.S. from Department of Mechanical Engineering, China Mining University, Xuzhou,China, in 1989; the Ph.D from the College of Mechanical Engineering, China Mining University, Xuzhou,China, in 1999.
At present he is a Ph.D. supervisor of Shandong Univesity. He also is a senior member of Chinese mechanical engineering society, senior member instrument society of China.
Qingdong Wang, was born in 1976.He
Yan Huang was born in 1988. He