ORIGINAL ARTICLE
A fuzzy control model based on BP neural network arithmetic
for optimal control of smart city facilities
Xiaotang Xia1
&Tingyang Li2
Received: 6 December 2018 / Accepted: 20 February 2019 / Published online: 5 March 2019 #Springer-Verlag London Ltd., part of Springer Nature 2019
Abstract
In order to analyze and study the fuzzy control model of smart city optimization control, this paper designs a fully networked fuzzy controller based on BP neural network arithmetic, so that the realization process of fuzzy reasoning is networked and clear. The evaluation mode of wisdom town is constructed, and the index system is simplified according to the evaluation index system of the develop possible of wisdom town. The analog outcome shows that the above arithmetic can availably optimize the parameters and structure of the neuro vagueness control, and the designed neuro vagueness control has good performance. The build of wisdom cities is advantageous to further promoting the deep integration of industrialization, informationization, urbanization, and agricultural modernization, which is of great significance for solving urban development problems and promoting continuable town develop. To improve the development capacity of intelligent city, we should highlight the charac-teristics of smart cities; advocate the concept of sustainable development and low-carbon development, market-oriented, overall planning, top-level design, and micro-regulation; and take the road of development with local characteristics.
Keywords Smart City . BP neural network . Fuzzy control model
1 Introduction
With the improvement of productivity and the liberation of the relations of production, the national economy has been devel-oping rapidly and the urbanization process has been promoted [1]. The city has perfect transportation facilities, more jobs, and perfect social public service, which makes theBagglomeration effect^ of big cities more obvious [2]. This leads to serious environmental pollution, imbalance of population proportion, management difficulties, traffic congestion, shortage of re-sources, inadequate security construction, and other problems, which seriously affect the city. The construction and develop-ment of the city has been promoted, so how to carry out the
top-level design, overall planning, and system innovation of the city has become the primary task [3]. In 2008, IBM first pro-posed the new notion ofBsmart earth^. In 2009, it officially proposed the development vision ofBsmart city,^ aiming at achieving urban prosperity and sustainable development. The establishment of smart city is not only conducive to the sus-tainable development of urban economy. While improving the development of urban informatization technology, it can also promote the development of emerging industries in the city [4–6]. Smart city is a new concept and new model that uses cloud computing, Internet of Things, removable Internet, and spatial geographical message conformity to boost urban plan, build, administration, and serve intelligence [7]. Wisdom city is a complex giant system, whose main construction development process includes dynamic programming, collaborative con-struction and healthy operation, scientific assessment, continu-ous improvement, and other links; each link should be a corre-sponding assessment in the first place; this kind of evaluation involves the mode and mechanism of macroscopic manage-ment appraisal and is advantageous to the standard construction of rights and responsibilities of the parties. The evaluation work can find problems and shortcomings in the construction process in time and summarize the successful experience in the con-struction process in time to guide the next step [8].
* Tingyang Li [email protected] Xiaotang Xia
Department of Urban Planning, Urban Construction College, Wuhan University of Science and Technology, Wuhan, China
2 School of Management, Wuhan University of Technology, Wuhan, China
Fuzzy control and BP neural network cooperative control systems are the research fields that people have paid much attention to in recent years [9]. Fuzzy control and BP neural network are both artificial intelligence technologies, each with different advantages and disadvantages and complementarity. There are many ways to combine fuzzy control and BP neural network. Which combination method can be used to fully utilize the system’s ability to process information and improve the control effect of the system is the key to research [10]. The emergence of BP neural fuzzy controller opens up a new way for the design of adaptive fuzzy control. It can not only realize the fuzzy reasoning and make the realization process of fuzzy reasoning networked and clear but also establish the one-to-one correspondence between the parameters of the fuzzy con-troller through the parameters of the network node [11,12]. Adjust and optimize the parameters of fuzzy control system. BP neural network is one of many neural network methods. It is an intelligent non-linear learning system that simulates hu-man brain processing information [13]. A multi-layer feed forward network based on error reverse propagation is calcu-lated by grads decline way [14]. The behind spread continu-ously adjusts the poise and threshold of the network to ensure that the total of squared errors between the expected output of the neuro network and the actual output is minimized, so that the actual network output worth is as shut as probable to the expected worth, thereby improving the adaptability of the net-work learning [15]. BP neuro network is a form of multiple layers. The more layers, the more information content each layer contains, and the more able it is to deal with complex problems [16,17].
Smart cities are the product of information revolution. Ni hui min,Bfather of global smart city^, first proposed the con-cept of smart city in 1983 [18]. In the 1990s, Graham, Marvin, and Mitchell pioneered the two theories of wisdom cities and therefore lay an important basis for the follow-up research of smart city [19]. In 2005, the European Union proposed a smart city [20]. After the 2008 financial crisis, IBM and Hitachi have successively proposed structures such as smart earth and smart city [21]. In 2012, Paolo Neirot and others proposed to develop a characteristic smart city. They believe that the meaning and mode of wisdom city build are special, and there is no global development mode [22]. George Cristian Lazaroiu proposed a conceptual model for smart city planning and construction and evaluated the implementation effect of smart city construction planning by constructing an evaluation model [23]. Liu Xiaoyin et al. used the principal component analysis method to evaluate smart cities [24]. In 2014, Adel S. Elmaghraby and others analyzed the issues of message safety and secret protection in the construction of smart city hereun-der the network circumstance and adherent to the concept of user-centered build, so as to realize the vision of sustainable, livable, and comfortable development of smart cities [25]. In 2015, Zheng, Ran, and others believed that surveillance video
service (SVS) was one of the most important services in smart cities. Based on large-scale surveillance video, effective ma-chine learning technology was used to analyze the surveil-lance video involved in heterogeneous information and effec-tively tap these potential and valuable information [26]. In 2015, Maria-Lluïsa Marsal-Llacuna summed up the experi-ence of smart city construction from the perspective of sus-tainability and livability, in order to better solve the problems in the procedure of wisdom city construction [27].
2 Materials and methods
With the rapid development of urban informationization, modern cities are more and more able to respond intelligently to various livelihood issues, service needs, and security issues under the network construction. This city which uses ad-vanced computer network technology to achieve urban con-struction, operation, and maintenance can be called a smart city. Under the guidance of advanced urban development con-cepts and scientific urban development planning, smart cities use the new generation of message technique such as big data analysis technology, cloud computing technique, Internet of things technique, and removable Internet to realize the close relationship between people, things, and cities. Connected and coordinated, a seamless integration of human intelligence makes the city a smarter form of urban development. The characteristics of smart city are comprehensive physical union, incentive innovation, full integration, and coordinated operation. The comprehensive Internet of things refers to the comprehensive coverage of the city, realizing the induction between objects and real-time monitoring of urban operation. Encouraging innovation is encouraging urban participants to use new technologies to create unlimited power for urban development. Full integration means fully integrating the Internet of things with the Internet. Collaborative operation is a highly shared resource of all departments in the city and highly efficient cooperation in all aspects.
The smart city will serve as a holistic urban development strategy, transforming the urban economic development form, optimizing the quality of social management, effectively achieving social benign governance, improving the living standards of residents, and realizing the development trend of modern cities for residents to live and work in peace. Wisdom city has gone through a long period of formation. From the initial lack of information technology to the slow exploration and establishment, people continue to discover and innovate and through continuous deepening efforts will eventually achieve a mature wisdom city. The initial stage of wisdom cities is just the phase of forming the idea of building smart city. At this time, the city’s intelligence is low and the information construction is incomplete. At this time, the city needs to be deployed and constructed under the guidance of
wisdom cities construction plan and planning. The construc-tion stage of wisdom cities refers to the initial construcconstruc-tion stage, which requires a large amount of manpower, material resources, and financial resources to be invested, and the basic framework construction of smart city is preliminarily complet-ed. After completing the initial construction of smart city, city leaders should stand at the decision-making high point, start from the top-level design, increase input, accelerate the devel-opment and operation of urban informatization, improve the level of urban intelligence and information feedback, and en-sure the growth of urban wisdom. After a certain development of smart city, people’s demand for intellectualization in all aspects of the city has been generally improved. Endogenous demand promotes the rapid improvement of ur-ban information technology, and urur-ban construction has grad-ually formed a linkage. This qualitative leap enhances the subjective perception of citizens and guarantees their well-being. After the highly informationized development of the city, the city system is fully intellectualized. At this time, the intelligent city is basically built. The three-level index of smart city model is shown in Tables1and2.
The construction of the evaluation index system of smart city is the key link to realize the numerical evaluation of smart city and to measure and compare it. Constructing a scientific and reasonable evaluate index systematic is an important pre-requisite for evaluating the development potential of wisdom cities. The development potential of wisdom cities refers to the formation of various elements of development of wisdom cities under the support of message infrastructure of smart city, aiming at promoting economic growth, innovation of social management, improvement of public service, good environ-mental protection, and residents’living and working in peace and contentment, which can measure the strength of urban smart construction and promote smart city. A comprehensive ability and driving force for the development of cities. The potential of wisdom city development is explored from the main content of urban development, which mainly includes
the economical develop possible, societal develop possible, public service possible, and scientific and technical innovate possible of smart city. The economic development potential is a comprehensive support capability that reflects the develop-ment of a particular region relative to other regions. Social development is a fundamental aspect of human development. The public service potential of a wisdom city refers to the potential of a public service entity to use certain methods to meet the various public service needs of public service ob-jects. It also refers to a smart city. Construction and develop-ment is a potential developdevelop-ment capability that can meet the public service needs of the general public. As one of the core potentials of wisdom city build and development, the potential of scientific and technological innovation plays a significant role in promoting the construction of smart cities. Information infrastructure is not only the carrier of wisdom city build but also the means of smart city operation and management, which lays the material foundation and premise preparation for smart city construction. The first-level index weight of smart city model is shown in Table3. The second-level index weight of smart city model is shown in Table4.
3 Result analysis and discussion
BP neural network is an intelligent and non-linear learning system which simulates human brain processing informa-tion. It is a multi-layer feed forward network that propa-gates errors backward. Gradient descent method is used to adjust the poise and threshold of the network through the reverse propagation of errors, so as to ensure that the square of errors between the expected output and the effective output of the neural network is minimum, so that the actual output of the network is as shut as possible to the expected value, thus improving the adaptability of network learning. The BP arithmetic simultaneously corrects the weight co-efficient and the BP arithmetic of the activation function. Table 1 Smart city model three
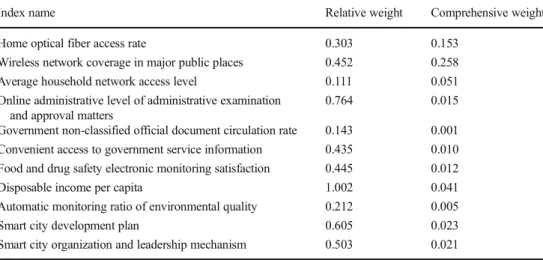
level index weight (government experts)
Index name Relative weight Comprehensive weight
Home optical fiber access rate 0.303 0.153
Wireless network coverage in major public places 0.452 0.258 Average household network access level 0.111 0.051 Online administrative level of administrative examination
and approval matters
0.764 0.015
Government non-classified official document circulation rate 0.143 0.001 Convenient access to government service information 0.435 0.010 Food and drug safety electronic monitoring satisfaction 0.445 0.012
Disposable income per capita 1.002 0.041
Automatic monitoring ratio of environmental quality 0.212 0.005
Smart city development plan 0.605 0.023
BP neural network can adjust and change its own network hierarchical structure in time according to the change of external information. By adjusting the scale of input neuron to simulate and model the input data, it can show strong ability in solving practical problems and value. Because the criterion BP arithmetic of the neuro net has the drawbacks of slow converge and facile to drop-in the regional mini-mum, it needs to be improved. In this paper, chaotic think-ing is introduced and an improvement in BP arithmetic based on chaotic thinking is proposed to optimize the pa-rameter setting of neural fuzzy controller. Confusion is a familiar appearance existing in non-linear system. Its mo-tion is characterized by ergodicity and randomicity, and it can wire way all states in some scope according to its own laws. Chaos has the characteristic that it can traverse all states in a certain range according to its ownBlaw.^
Standard BP neuro network model is a form of three levels of neuron, separately for the input layer, cryptic layer, and output layer; hidden layer for a layer or multiple times, num-ber of neurons at all levels are based on the actual research question, between the various levels of neurons form the mu-tual connection, there is no connection between neurons with-in the various levels, as shown with-in Fig.1.
In the structure of BP neural network, the hidden layer plays a very important role in the three-layer neural network model, and the mapping function of the middle layer is a non-negative and non-linear function, which is characterized by centrosymmetry and will gradually weaken to both sides. Therefore, the closer the input vector value is to the center value of the base function, the larger the value of the output
unit of the intermediate layer. Conversely, the output is small-er. So, its mathematical model is
puð Þ ¼f C ∑ n i¼1 K f−zi h 2 ! δ½b zið Þ−u ð1Þ wherehbelonging toR.ziis the center of theibasis function of
the cryptic layer.f which is the connect scale of each hidden unit of BP neural network.bis the output layer threshold.nis the number of cryptic layer units.uis the width of theiradial basics function. δis the radial basics function, and Kis the distance between inputhand centerzi. The Gaussian function
formula is usually used instead: Pi¼ fi ∑N i¼1 fi ð2Þ
wherefiis the breadth of Gauss function.
For hidden nodes, we choose the empirical method to cal-culate, and the outcome is shown in Tables5and6.
The number of node in the hidden layer is obtained accord-ing to the formula, with a range of 8–17. According to the simulation results, the error is minimum when the number of cryptic layer node is 10.
The training results are divided into four levels: 0.8–1.0 is excellent, 0.6–0.8 is good, 0.4 is general, and less than 0.4 is unacceptable. The number of input layer nodes is 5, and the number of node in the cryptic layer is 5, and the number of node in the output layer is 1. Thus, the optimal BP neuro network is constructed.
Table 2 Smart city model three-level index weight (business experts)
Index name Relative weight Comprehensive weight
Home optical fiber access rate 0.331 0.074
Wireless network coverage in major public places 0.331 0.074 Average household network access level 0.331 0.074 Online administrative level of administrative examination
and approval matters
0.511 0.021
Government non classified official document circulation rate 0.511 0.021 Convenient access to government service information 0.210 0.013 Food and drug safety electronic monitoring satisfaction 0.132 0.013
Disposable income per capita 1.010 0.051
Automatic monitoring ratio of environmental quality 0.656 0.025
Smart city development plan 0.511 0.082
Smart city organization and leadership mechanism 0.511 0.082
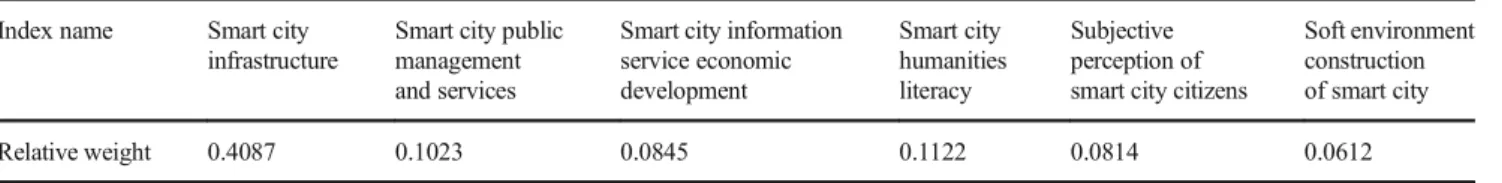
Table 3 Smart city model first-level index weight Index name Smart city
infrastructure
Smart city public management and services
Smart city information service economic development Smart city humanities literacy Subjective perception of smart city citizens
Soft environment construction of smart city
BP neural network is generally divided into two learn-ing methods: supervised learnlearn-ing method and unsupervised learning method. This paper mainly adopts supervised learning method. The basic flow of the algorithm is as follows:
The first step is to determine the number of network layers. According to the actual sample size, a hidden layer or multiple hidden layers can be selected. When the sample size is large, an implicit layer can be added to reduce the size of the network layer. When the specimen size is little, an implicit layer is usually used. The second step is to calculate the number of node in the input layer. The number of node in the input layer is determined according to the dimension of the input vector. Generally, the number of node in the input layer is determined according to the problem of actual processing. If the input is an image, the number of node in the input layer is determined according to the pixel of the image. If binary function is fitted, the number of input layer node should be two node. The third step is to determine the number of cryptic node. The number of cryptic node has a grand effect on the performance of BP neuro network. In general, it is affirmatory according to the formulae:
E xð Þ ¼ ∑n j¼1
Ej ð3Þ
Eis the number of samples,jis the number of cryptic layer node, andnis the number of neurons in the input layer: CI¼ ffiffiffiffiffiffiffiffiffiffiffiffiffiffiffiffiffiffiffiffiffiffiffiffiffiffiffiffiX þYþZ
X2þY2þZ2
p ð4Þ
X is the number of neurons in the output layer,Yis the number of neurons in the input layer, andZbelongs to [0, 10]:
HWt¼ ∑N i¼1
Dið Þx
N ð5Þ
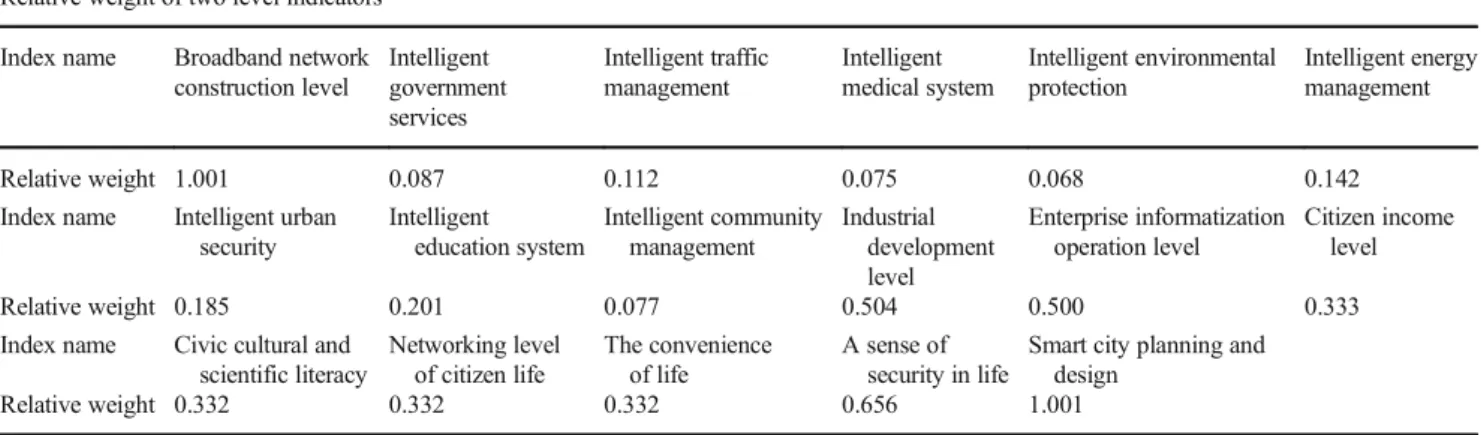
Nis the number of neurons in the input layer. In the fourth step, the number of neurons in the output layer is usually determined according to practical problems. Different learn-ing results will adopt different numbers of neurons in the output layer. The fifth step is to select the transfer function of BP neural network. In the sixth stage, choose the training method. The training methods of BP neural network mainly Table 4 Smart city model secondary indicator weight
Relative weight of two level indicators Index name Broadband network
construction level Intelligent government services Intelligent traffic management Intelligent medical system Intelligent environmental protection Intelligent energy management Relative weight 1.001 0.087 0.112 0.075 0.068 0.142
Index name Intelligent urban security Intelligent education system Intelligent community management Industrial development level Enterprise informatization operation level Citizen income level Relative weight 0.185 0.201 0.077 0.504 0.500 0.333
Index name Civic cultural and scientific literacy Networking level of citizen life The convenience of life A sense of security in life
Smart city planning and design
Relative weight 0.332 0.332 0.332 0.656 1.001
Table 5 Experimental outcome of diverse cryptic layer node Hidden layer nodes Number of iterations Mean square error
3 18,243 19.8366 4 20,185 19.5683 5 22,057 18.3878 6 21,808 17.6512 7 19,554 15.6839 8 21,008 13.5764 9 21,782 12.6459 10 23,584 14.3651 11 22,061 13.2561 12 24,221 18.0648 13 22,344 16.3281
include the steepest decline mode, the improved steepest de-cline mode, the momentum dede-cline mode, and the quasiNewton mode. Each method has different applicable conditions and is generally chosen based on the actual prob-lem being solved. In the seventh step, the initial value is de-termined, and the initial value is generally set to a small non-zero random value. The eighth step is to start learning and training and output results. The results show that the actual output based on BP neural network training is consistent with the expected data, and the data is basically consistent, and the accuracy is high. The relative error of BP neural network prediction is shown in Fig.2. In figure, the abscissa represents the number of training iterations, and the ordinate represents the mean square error of network training. It can be noticed from the figure that, in the training process, the arithmetic decreases faster in the first 210 iterations, and the descent rate tends to be flat after 210 iterations.
The blue full line represents the training curve, the green dotted line represents the test curve, and the red dotted line represents the best intersection point of the network train-ing curve. When the number of iteration of traintrain-ing arrives 68, the curve converges, as shown in Fig. 3. However, when the number of cryptic node of neural network in-creases, the number of training iterations decreases and the curve converges, as shown in Fig.4. When the number of iterations is gradually reduced, the simulated train curve represented by it will also change continuously. The effec-tive output and the expected output result are gradually approached, and the wrong between the effective output worth and the expected output worth reaches the present target, as shown in Fig.5.
The formula that can be expressed is
f xð Þ ¼signωTxþb ð6Þ The robustness of the neural network fuzzy controller to the simulation system on different objects shows that the BP neu-ral network algorithm and the optimized neuro-fuzzy control-ler can always achieve better control effect for different opti-mization. That is, BP neural network algorithm has strong adaptability and can be used in the optimization design of many kinds of objects.
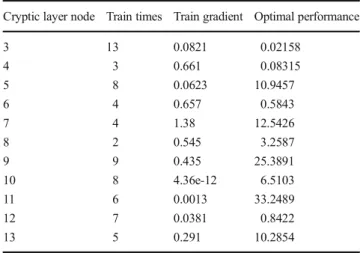
The parameter determination of BP neural network fuzzy controller is also an important factor that can affect the overall control effect of the system. The multi-input and multi-output fuzzy controller with parameters of BP neural network fuzzy controller is expressed as a full-BP network structure based on linkage mechanism. Generally, multi-layer feed forward neural network is adopted. Multi-multi-layer feed forward neural network is a five-layer neural network, and each layer has a clear meaning. The first or third layer of the network realizes the fuzzy reasoning of the fuzzy Table 6 Statistics on training results of nodes with different cryptic
layers
Cryptic layer node Train times Train gradient Optimal performance
3 13 0.0821 0.02158 4 3 0.661 0.08315 5 8 0.0623 10.9457 6 4 0.657 0.5843 7 4 1.38 12.5426 8 2 0.545 3.2587 9 9 0.435 25.3891 10 8 4.36e-12 6.5103 11 6 0.0013 33.2489 12 7 0.0381 0.8422 13 5 0.291 10.2854
control, and the last two layers realize the de-fuzzification. The judgment based on the fuzzy concept is the fuzzy com-prehensive method. The method takes the fuzzy transfor-mation as the basic principle, takes the principle of maxi-mum membership as the principle, and adds accurate digi-tization means to consider the evaluated object and its attribute-related elements in all aspects to achieve the eval-uation object. To defuzzify, the result is more scientific, reasonable, and close to the actual quantitative evaluation results. The method steps are as follows:
The first step is to determine the factor universe of evalu-ation objects:
Cið Þ ¼ jh tt ð Þi1j;jh tð Þi2j;…;jh tð ÞiNj ð7Þ The second step is to determine hierarchy:
V¼ ∪m
ai∈AV að Þi ð8Þ
The third step is to establish fuzzy relation matrix: x1 y1 1 x2 y2 1 ⋮ ⋮ ⋮ xp yp 1 x1 y1 1 x2 y2 1 ⋮ ⋮ ⋮ xp yp 1 ⋮ ⋮ ⋮ x1 y1 1 x2 y2 1 ⋮ ⋮ ⋮ xp yp 1 2 6 6 6 6 6 6 6 6 6 6 6 6 6 6 6 6 6 6 6 6 4 3 7 7 7 7 7 7 7 7 7 7 7 7 7 7 7 7 7 7 7 7 5 a b c 2 4 3 5¼ dð Þ11;j dð Þ21;j ⋮ dð Þp1;j dð Þ12;j dð Þ22;j ⋮ dð Þp2;j ⋮ dð Þ1n;j dð Þ2n;j ⋮ dð Þpn;j 2 6 6 6 6 6 6 6 6 6 6 6 6 6 6 6 6 6 6 6 6 6 6 4 3 7 7 7 7 7 7 7 7 7 7 7 7 7 7 7 7 7 7 7 7 7 7 5 ð9Þ
The nth row and jth column elements in the matrix repre-sent the membership of an evaluated object from the element dn to the dj hierarchical fuzzy subset.
According to the results in Table7, when the consistency ratio index is less than 0.10, the consistency test of the judg-ment matrix can be passed.
The fourth step is to decide the scale vectors of evaluation factor: ωTxiþb≥1; y i¼ þ1 ωTxiþb≤−1; y i¼−1 ð10Þ The elementωin the scale vectors is basically the member-ship of the factors to the fuzzy sub.
The fifth step is to synthesize fuzzy comprehensive evalu-ation result vector:
∑p i¼1 x2i ∑ p i¼1 xiyi ∑ p i¼1 xi ∑p i¼1 xiyi ∑ p i¼1 y2i ∑ p i¼1 yi ∑p i¼1 xi ∑ p i¼1 yi 1 2 6 6 6 6 6 6 4 3 7 7 7 7 7 7 5 a b c 2 4 3 5 ¼1 n ∑p i¼1 xi ∑n l¼1 dð Þil;j ∑p i¼1 yi ∑n l¼1 dð Þil;j ∑p i¼1 ∑ n l¼1 dð Þil;j 2 6 6 6 6 6 6 4 3 7 7 7 7 7 7 5 ¼ ∑p i¼1 xi ∑n l¼1 dð Þil;j n 0 B B @ 1 C C A ∑p i¼1 yi ∑n l¼1 dð Þil;j n 0 B B @ 1 C C A ∑p i¼1 ∑n l¼1 dð Þil;j n 0 B B @ 1 C C A 2 6 6 6 6 6 6 6 6 6 6 6 6 6 6 6 6 6 6 4 3 7 7 7 7 7 7 7 7 7 7 7 7 7 7 7 7 7 7 5 ð11Þ
wheredi(i,j) is obtained bya,b,c, andicolumns, which instructs
the degree of membership of the graded fuzzy subset as an entirety. Fig. 4 Output results of cryptic layer node
According to the optimization process given above, a flow chart of the specific implementation is given. The first step is to determine the structure of the fuzzy neural net-work. Based on the general fuzzy controller, the input quantity is Ec and E, so the number of node in the network
input layer is 2, and the language value of each input var-iable is taken as {NB, NS, ZO, PS, PB}, so the second layer is 10. The third layer is the rule layer. Because there are two variables, each of which has 5 language values, the third layer is 52–25. The fourth layer is the normalization layer, Table 7 Stochastic uniformity
index n 1 2 3 4 5 6 7 8 9 10 11 12 13
M 0 0 0.46 0.81 1.11 1.21 1.35 1.40 1.48 1.52 1.53 1.56 1.59
Fig. 6 Effect comparison diagram
Fig. 7 Simulation curve of neuro-fuzzy controller
and the number of node is 25 with the third layer. The output layer is 1 node. Step 2, call the RANDDOM func-tion. The weightPvalue is (0,1) for layer 4 to layer 5 of the network. At the same time, the parameter of the member-ship function is given negative initial value, which can be set to close to a reasonable value. The center of member-ship function corresponding to {NB, NS, ZO, PS, PB} is set to {−1,−0.5, 0, 0.51}, and the width is set to 0.5. The third step is to sample the output of the system in the sam-pling time and calculate the total wrong function. The total wrong function is taken as
AIt¼ðItþQtÞ 2 ⋅ ItþQt ð Þ Dt ð12Þ Among them, It is the expected output, Qt is the
actual output of the t network, and t is the number of specimen and the number of times the BP arithmetic is called.
After getting the error function, we can use the error to call back the BP algorithm again to optimize the whole parameters. In the fourth step, according to the termination conditions of the optimization results, when the total error of the system with the number of iterations greater than the maximum meets the accuracy requirement, the algorithm can be terminated and directly transferred to the fifth step. Otherwise, the optimization will continue and turn to the third step. In the fifth step, the optimization obtains the optimal solution and realizes the control of the controlled object and obtains a simulation curve, which can be repre-sented by Fig.6.
In order to test the optimization effect of BP neural network algorithm on the neuro-fuzzy controller, we can take the second-order system as the model to simulate and observe the control effect of the optimized controller through the simulation results. The preferable simulation models are as follows:
Dr pð Þ ¼ D pð Þ minðPA;PBÞ
ð13Þ Take the parameterp=PA=PBand transform the formula
into the split equation: R¼ωLþ 1
ωC ð14Þ
A neural fuzzy controller with dual input and single output is adopted. The 2 input variables are deviationeand deviation ratede/dt, quantized and then mapped to interval (−1,1). The
fuzzy subset is {NB, NS, Z, PS, PB}. In the BP arithmetic, denotation = 2.50. After BP arithmetic training, the unit step response curve of the neural fuzzy govern systematic is shown in Fig.7.
Fig. 8 Comparison of results of different methods
Table 8 Arithmetic comparison table Model class Hidden node
number Average percent mistake Root mean square mistake BP neural network arithmetic 8 0.002122 0.001815 Other arithmetic 8 0.003825 0.002621
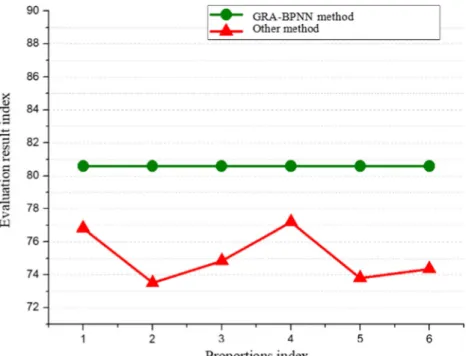
As shown in Fig.7, the simulation results show that the neuro-fuzzy controller based on BP neural network algo-rithm can effectively control the system. Then, the unit step response curve of the system will rise faster, the overshoot will be smaller, and there will be almost no steady-state error. However, the effect of optimization is ideal and meets the requirements of the system. This also shows that the chaotic BP algorithm is completely feasible for the parameter optimization of the neuro-fuzzy control-ler, and the effect is better. As shown in Fig. 8, the BP neural network mentioned in the article evaluates the green lines, and its stability and smoothness are more gradual and stable than those of other methods, and the evaluation results are more reasonable than other methods.
This paper compares and analyzes BP neural net-work algorithm with other algorithms, and the results
obtained by the analysis can be expressed in Table 8. As can be seen from Table 8, the overall performance of the BP neural network algorithm is better than other algorithms.
In this paper, the simulation training chart evaluated by BP neural network algorithm can be shown in Fig. 9, and the simulation result can be shown in Fig. 10. The BP neural network model training state changes gradually and gradually, and the error obtained from the simulation results increases from decreasing to decreasing. This performance shows the feasibility and relative stability of the BP neural network algorithm.
4 Conclusion
This paper makes a conceptual introduction to smart cities based on theory, models, and methods and analyzes the basic evaluation indicators for building smart cities. In order to establish a BP network neural arithmetic fuzzy control model in a smart city environment, the effective-ness and rationality of the fuzzy control model based on BP neuro network arithmetic for the development of smart city is further demonstrated by different methods. In order to optimize the parameter and framework of the neuro misty controller, an improved BP arithmetic is proposed to optimize the controller based on the standard BP arith-metic and the idea of chaos. It has strong global search ability, search efficiency is high, and is an efficient opti-mization arithmetic. It can be applied to the optiopti-mization of neural fuzzy controller to find the optimal solution quickly, avoid local minimum, and achieve global optimization.
Fig. 10 Error result diagram of training
Publisher’s noteSpringer Nature remains neutral with regard to jurisdic-tional claims in published maps and institujurisdic-tional affiliations.
References
1. Su KH, Huang SJ, Yang CY (2015) Development of robotic grasp-ing gripper based on smart fuzzy controller. IJFS 17(4):595–608 2. Sajedi Pour D, Behbahani S (2016) Semi-active fuzzy control of
machine tool chatter vibration using smart MR dampers. Int J Adv Manuf Technol 83(1–4):421–428
3. Najjar YSH, Amer MMB (2016) Using a smart device and neuro-fuzzy control system as a sustainable initiative with green cars. J Energy Inst 89(2):256–263
4. Datta M, Senjyu T (2013) Fuzzy control of distributed PV inverters/ energy storage systems/electric vehicles for frequency regulation in a large power system. IEEE Trans Smart Grid 4(1):479–488 5. Li L, Song G, Ou J (2015) Adaptive fuzzy sliding mode based
active vibration control of a smart beam with mass uncertainty. Struct Control Health Monit 18(1):40–52
6. Ruppert E, Azcuepuma JL, Sguarezi FAJ et al (2014) A wind ener-gy generator for smart grid applications using wireless-coded neuro-fuzzy power control. CMWA 68(12):525–530
7. Kim HS, Kang JW (2014) Multi-objective fuzzy control of smart base isolated spatial structure. IJSS 14(3):547–556
8. Loia V (2013) Vaccaro, et al. a self-organizing architecture based on cooperative fuzzy agents for;smart grid voltage control. IEEE TII 9(3):1415–1422
9. Cheng J, Wu W, Cao J et al (2017) Fuzzy group-based intersection control via vehicular networks for smart transportations. IEEE TII 13(2):751–758
10. Bahadir SK, Thomassey S, Koncar V et al (2013) An algorithm based on neuro-fuzzy controller implemented in a smart clothing system for obstacle avoidance. IJCIS 6(3):503–517
11. Aliabadi SF, Taher SA, Shahidehpour M (2018) Smart deregulated grid frequency control in presence of renewable energy resources by EVs charging control. IEEE Trans Smart Grid 9(2):1073–1085 12. Cheng ST (2014) The adaptive road routing recommendation for
traffic congestion avoidance in smart city. Wirel Pers Commun 77(1):225–246
13. Hasanien HM, Matar M (2014) A fuzzy logic controller for auton-omous operation of a voltage source converter-based distributed generation system. IEEE Trans Smart Grid 6(1):158–165 14. Kim HS, Kang JW (2017) Smart platform for microvibration
con-trol of high-tech industry facilities. IJSS 17(1):155–164
15. Kim HS, Kang JW (2017) Vibration control of smart TMD for retractable-roof spatial structure considering closed and open roof condition. IJSS 17(4):1537–1548
16. Collotta M, Bello LL, Pau G (2015) A novel approach for dynamic traffic lights management based on wireless sensor networks and multiple fuzzy logic controllers. Expert Syst Appl 42(13):5403–5415 17. Fadoul ST, Hamadi A, Chandra A et al (2017) Optimization of standalone microgrid considering active damping technique and smart power management using fuzzy logic supervisor. IEEE Trans Smart Grid 8(1):475–484
18. Elkhoury O, Adeli H (2013) Recent advances on vibration control of structures under dynamic loading. ACME 20(4):353–360 19. Kim HS, Chang C, Kang JW (2015) Evaluation of microvibration
control performance of a smart base isolation system. IJSS 15(4): 1011–1020
20. Thirugnanam K, Joy TPER, Singh M et al (2014) Modeling and control of contactless based smart Charging Station in V2G scenar-io. IEEE Trans Smart Grid 5(1):337–348
21. Arcos-Aviles D, Pascual J, Marroyo L et al (2018) Fuzzy logic-based energy management system design for residential grid-connected microgrids. IEEE Trans Smart Grid 9(2):530–543 22. Singh J, Pesch D (2014) Smart error-control strategy for low-power
communication in wireless networked control system. Telecommun Syst 55(2):253–269
23. PetkovićD, Shamshirband S (2016) Input displacement neuro-fuzzy control and object recognition by compliant multi-fingered passively adaptive robotic gripper. J Intell Robot Syst 82(2):177–187 24. Luo F, Zhao J, Dong ZY et al (2017) Optimal dispatch of air
con-ditioner loads in southern China region by direct load control. IEEE Trans Smart Grid 7(1):439–450
25. Cha YJ, Agrawal AK (2013) Velocity based semi-active turbo-Lyapunov control algorithms for seismically excited nonlinear smart structures. Struct Control Health Monit 20(6):1043–1056 26. Shakouri P, Czeczot J, Ordys AW (2015) Simulation validation of
three nonlinear model-based controllers in the adaptive cruise con-trol system. J Intell Robot Syst 80(2):207–229
27. Vaccaro A, Loia V, Formato G et al (2015) A self-organizing archi-tecture for decentralized smart microgrids synchronization, control, and monitoring. IEEE TII 11(1):289–298