Unchaining the
supply chain
How global branded clothing firms are
contributing to the European economy
Report commissioned by the
European Branded Clothing Alliance (EBCA) April 2013
Authors:
Table of contents
Preface
3
Executive summary
4
1
The global value chain for branded
clothing
8
1.1 Background and policy context 8
1.2 Segments of today’s clothing industry 10
1.3 The business models of branded clothing firms 12 1.4 Geographic distribution of the value chain 13 1.5 Future trends for branded clothing business models 17 1.6 Factors influencing the location of economic activity 18 1.7 Key policy factors influencing value creation 19
2
The economic contribution in Europe
20
2.1 Contribution to GDP 20
2.2 Contribution with respect to trade 25
2.3 Contribution to employment in Europe 31
2.4 Contribution beyond GDP 36
2.5 Summary of findings 39
3
The trade environment
41
3.1 The current tariff barriers 41
3.2 Non-tariff barriers and other barriers 45 3.3 Trade protection when production is globally fragmented 47 3.4 Impact of barriers for global branded clothing firms 49 3.5 Economic potential for Europe from further trade
Preface
This study looks at branded clothing companies. The study focuses on global branded clothing firms with a significant presence in Europe.
The study addresses branded clothing firms with a presence in Europe regardless of whether they are of European origin (such as Inditex or H&M) or of foreign origin (such as Levi Strauss or Nike, Inc.).
The common denominator is that these firms have global value chains and high share of their sales, development activities and value added in Europe.
We have been asked to assess the economic footprint in Europe from the branded cloth-ing companies, and have been asked to suggest how European trade policies can help maximising that footprint in Europe.
The views expressed in this report are those of the authors and cannot be taken as an expression of the view of the client or the companies mentioned in the report.
Executive summary
This report assesses the economic footprint of what we call branded clothing, which com-prises the whole value chain from manufacturing of apparel, shoes, bags, and accessories to textiles, leather and fur. We also include the very important research, design and de-velopment activities preceding the manufacturing stage as well as the stages following manufacturing, namely the distribution part with transport, logistics, wholesale and re-tail. Furthermore we distinguish between branded and non-branded segments of the val-ue chain.
Tide is turning: Branded clothing becoming a net contributor to jobs
The economic footprint of the modern branded clothing industry looks very different to the traditional textile, leather and clothing manufacturing sector. It shows an economic footprint, which combines a low-skilled and declining manufacturing element, and a growing high-skilled and high-value added element in non-manufacturing parts of the value chain represented in Europe.
Historically the industry has been painted as an outsourcer, with jobs leaving Europe rather than being created here. This view neglects somewhat the creation of other jobs in other parts of the supply chain. It also fails to acknowledge that some of the major players have never produced in Europe, and in fact started their business with Asian manufactur-ing. However, we now see growth in this sector, and increasing recognition that employ-ment in post- and pre-manufacturing stages are now making up for the manufacturing jobs being outsourced, and in certain countries, the branded clothing value chain is start-ing to become a positive net job creator.
Furthermore, there is clear evidence of a rapidly changing composition of the jobs with many new high-skilled and high value added jobs being created within the branded cloth-ing value chain in Europe.
Quantifying the economic footprint
Branded clothing is the centrepiece of Europe’s fashion industry, which again is a signifi-cant part of Europe’s creative economy. We measure the economic footprint in four parts:
• Contribution to jobs
• Contribution to gross domestic product (GDP)
• Contribution to trade
• Contribution beyond GDP
Contributing with 4 million jobs in Europe
Europe’s branded clothing industry supports 4 million jobs. According to EU Commission reports, the European fashion industry supports 5 million jobs. Around 80 percent of the fashion market is branded clothing, and consequently, we estimate that 4 million of the 5 million jobs in the fashion industry are in the branded clothing segment. Furthermore, we estimate that 1.5 million of the branded clothing jobs are in manufacturing (37 percent),
while 2.5 million jobs (63 percent) are found in other parts of the value chain, mainly in the distribution part – logistics, wholesale and retail related to the fashion industry. So while branded firms have many manufacturing jobs outside the EU, the sector is still supporting manufacturing jobs equivalent to more than 5 percent of total employment in the manufacturing sector.
Contributing with 2.4 percent of European GDP
We estimate that the branded clothing value chain contributes 2.4 percent of the EU27 gross domestic product (GDP). This is composed of a contribution derived from the man-ufacturing part of 1.2 percent of total GDP, including the value added in inputs to the manufacturing, and 1.2 percent of total GDP in the remaining part of the value chain. European Commission reports show that the fashion industry as a whole accounts for 3 percent of the EU's GDP, and our results show that 80 percent of that contribution can be attributed to branded clothing.
Contributing to increased trade
Textiles and clothing are among the most traded goods in the global economy and the EU dominates high quality markets.
The EU27 remains the world’s second largest exporter of textile and clothing products after China1. In 2012, the combined EU27 exports of clothing and textile products to
non-member countries totalled €41.2 billion, while imports from non-non-member states totalled €88.7 billion. Exports of footwear to non-member countries were valued at €7.5 billion in the same year, while imports of footwear reached a total of €15.6 billion.
Given a contribution of 2.4% and based on the latest GDP data for the EU27 for the year 2012 our results show that the activities in the branded clothing value chain generate value added across the region in the order of €300 billion, and thereby significantly contribute to the European economy and growth.
When we take a value chain approach and estimate how value added is generated in the different parts of the value chain, we find that although a large share of the ac-tual manufacturing takes place outside Europe, a significant share (50-80%) of the value added derived from final consumption in Europe stays in Europe. The numbers presented in this report show that well over half of the total value added in the value chain still accrues to the EU, even though manufacturing is outsourced.
In the case of global branded clothing it does not seem that outsourcing is pulling the high value added jobs with it to destinations outside Europe. The central func-tions of research, design and development are still very much centred in Europe, and similarly, a significant part of the value added being generated in the logistics, wholesale and retail parts of the value chain also stays within Europe.
In this study, using a new and novel database published in January 2013 by the WTO and OECD, we go beyond analysing gross trade flows and also examine the content of EU val-ue added in both exports and imports.
We find that the domestic share of value added embodied in gross imports of textiles, clothing and footwear products averages around 25 percent across the EU. This illustrates the global aspect of the value chain well. Even though products are manufactured outside of the EU, a significant part of the value added may still have been generated within the EU. Products may for example have been designed or developed by European enterprises or even manufactured using intermediate inputs originating from the EU.
Contributing beyond GDP
The globalisation of the branded clothing firms has contributed to Europe’s economy beyond what can be measured in terms of GDP.
Clothing and footwear is an important part of the household budget for an average Euro-pean family. Between 5 and 7 percent of total household expenditure is on clothing. Analysis of the price levels for clothing and footwear in comparison with prices of all other products purchased by households shows a signifi-cant price drop for clothing and footwear over the past 15 years. During this period, prices of clothing and footwear products have fallen by 27 percent compared to the general price level. We argue that globalisation of the value chain for branded clothing has led to significant consumer benefits in the shape of lower prices and an increased variety of goods to choose from.
Maximising the economic footprint
Branded clothing companies located in the EU can obtain certain competitive advantages related to the ability and tradition of high quality products and the proximity to advanced and trend setting markets allowing for fast reaction to changing trends. Furthermore, branded clothing firms can build on the availability in Europe of technological and non-technological innovation in the various European fashion and design clusters, which also constitutes the hotspots for creativity and the skills and savoir-faire that is key to success in the branded clothing industry.
Design and creativity, however, are not the only keys to success in an industry where pro-duction and competition is becoming ever more global and integrated. To create jobs and value in Europe, branded clothing firms also need to operate very large and very advanced value chains at a global scale. The vertical cooperation across the supply chain, from de-sign to manufacturing to retail is complex, but pivotal in enabling branded clothing firms to survive and grow.
Despite a very pronounced globalisation of all parts of the value chain, significant parts of the value chain are still very much present in Europe, and as we will show in this report, further globalisation and removal of trade barriers is essential for maximising the eco-nomic footprint in Europe of the branded clothing firms.
The role of trade policies for maximising the economic footprint
We found that despite the recent removal of quantitative restrictions on imports of textile, leather and clothing products, the industries are still among the most protected in the EU, with average ad valorem tariffs of roughly 11 percent on apparel products.
The global organisation of production and the high trade-intensity of branded clothing products make the industry especially vulnerable to trade barriers. Tariffs and other types of trade barriers imposed at each border add to the cost of the final product and may af-fect the organisation of the global value chain. Furthermore, a country’s own producers may actually benefit from trade liberalisation rather than suffer from it.
Looking into the future for a favourable policy environment
Protectionist measures such as antidumping duties or high tariffs on imports into Europe will not serve the economic interests of European consumers since it will hinder the de-ployment of an effective global sharing of tasks.
We would thus recommend that the EU needs to pursue and deliver on an ambitious free trade agenda which includes tariff liberalization through a combination of FTAs and mul-tilateral agreements with harmonised and flexible RoOs. Furthermore, to maximise the economic footprint of the branded clothing value chain in Europe, the EU should reject a simplistic approach to trade defence instruments such as antidumping duties, and it should also address the key NTBs in the sector in particular TBTs in the form of certifica-tion, labelling and testing requirements which significantly hinder market access of branded clothing products.
A favourable policy environment would be one with more free trade, low or no tariffs on a much broader range of textiles, leather and clothing products and with much more flexi-ble rules of origin than is the case today.
Looking into a future with such a favourable policy environment would allow the sector to increase its contribution to the European economy.
Overall this suggests that future EU trade policy should take account of a value chain based approach incorporating inter alia the above features. We find that taking this ap-proach would lead to more positive effects of trade liberalisation, and support the conclu-sion that more trade liberalisation, not less, is needed to maximise the economic footprint of the textile and clothing value chain in Europe.
Operating a global value chain, as illustrated by the global branded clothing firms, still generates significant value to the European economy, as most of the higher val-ue added activities are located in the EU. However, in terms of trade policy, manufac-turing is still the stage that determines origin. The implication of this is that Europe-an consumers end up paying higher prices Europe-and that producers, which in all other aspects than manufacturing are European, are taxed for organising their production in the most cost-effective manner.
Chapter 1
The global value chain for branded
clothing
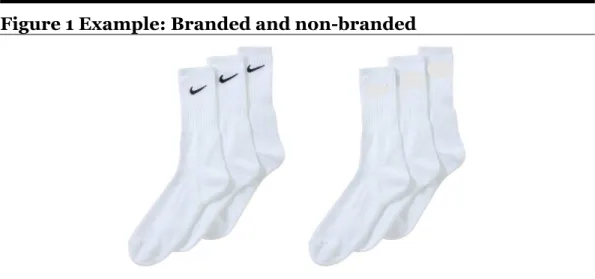
This report focuses on what we call branded clothing. Branded clothing is in fact more than just clothing. In our definition, branded clothing comprises the manufacturing of
fashion goods (apparel, shoes, bags, and accessories), the fashion led industries (textiles, leather and fur), design activities as well as distribution (both wholesale and retail). Fur-thermore we distinguish between branded and non-branded segments, cf. Figure 1.
Figure 1 Example: Branded and non-branded
In this chapter we describe the global value chains for branded clothing firms. To do so, we rely on interviews conducted with a selection of members of EBCA as well as findings in the existing literature and publicly available information from annual reports and other financial information.
1.1
Background and policy context
Branded clothing is the centrepiece of Europe’s fashion industry, which is a significant part of Europe’s creative economy.2 Europe’s fashion industry counts 850 000 companies
and supports 5 million jobs, according to EU Commission reports, which also show that the fashion industry as a whole accounts for 3 percent of the EU's GDP and thereby signif-icantly contributes to the European economy and growth.3
As branded clothing constitutes around 80 percent of the EU clothing market, we esti-mate that 4 million out of the 5 million jobs in the fashion industry are in the branded clothing segment. Based on data from Eurostat, we further estimate that out of these 4
2 See European Commission Staff Working Document, “Competitiveness of the European high-end industries”, SWD(2012) 286.
fash-million jobs, 1.5 fash-million (37%) are in manufacturing, while the remaining 2.5 fash-million (63%) are found in other parts of the value chain. This is mainly in distribution – logis-tics, wholesale and retail activities - related to and supported by the fashion industry. The 1.5 million jobs generated in manufacturing constitute 5 percent of employment in the entire manufacturing sector in the EU27.
The branded clothing industry has a much bigger economic impact when one considers the indirect impacts and the positive spillover effects to other industries such as: fashion media, events, stylists, model agencies, make-up artists, photographers and tourism, and also when considering the upstream linkages in the form of purchasing inputs from other sectors.
Branded clothing companies located in the EU can obtain certain competitive advantages related to the ability and tradition of high quality and high value added products, the proximity to advanced and trend setting markets allowing for fast reaction to changing trends. Furthermore, branded clothing firms can build on the availability in Europe of technological and non-technological innovation in the various European fashion and de-sign clusters, which also constitute the hotspots for creativity and the unique skills and savoir faire that is key to success in a fast moving business.
Design and creativity, however, are not the only keys to success in an industry where pro-duction and competition is becoming ever more global and integrated. To create jobs and value in Europe, branded clothing firms also needs to operate very large and very ad-vanced value chains at a global scale. The vertical cooperation across the supply chain, from design to manufacturing to retail is complex, but pivotal in enabling branded cloth-ing firms to survive and grow.
Despite a very pronounced globalisation of all parts of the value chain, significant parts of the value chain are still very much present in Europe, and as we will show in this report, further globalisation and removal of trade barriers is essential for maximising the eco-nomic footprint in Europe of the branded clothing firms.
Nevertheless, the recent communication on Promoting cultural and creative sectors for growth and jobs in the EU4, and the accompanying Staff Working Document on the
com-petitiveness of the EU fashion industries5, says nothing about how future trade policies of the European Union intend to support and foster this development. This report is propos-ing to close this gap.
4 See Communication from the Commission to the European Parliament, the Council, the European Economic and Social Committee and the Committee of the Regions: “Promoting cultural and creative sectors for growth and jobs in the EU”, COM(2012) 537 final.
http://ec.europa.eu/culture/our-policy-development/documents/communication-sept2012.pdf 5
1.2
Segments of today’s clothing industry
To analyse how future trade policy can be designed to maximise the economic footprint of branded clothing in Europe, we will need to understand the current and future operations of branded clothing firms. We need to appreciate that there are many differences in how branded firms operate and create value. Branded clothing is indeed an industry where one size does not fit all.
Branded clothing constitutes the majority of the clothing market with around 80 percent; the remaining 20 percent of the market is non-branded or private labels. The exact shares for branded versus non-branded segments are difficult to estimate and it can vary slightly from year to year. Our estimate is based on industry interviews and data on the sales of apparel by distribution channel, cf. Figure 2. To gauge the share of branded clothing it can be assumed that sales in the largest channel, namely the apparel specialist retailers are almost entirely attributable to the branded clothing segment. Likewise it can be assumed that sales from the department store sales channel is also branded clothing. Sales through the grocery retail channel, on the contrary, can be assumed to be predominantly non-branded. The sales through internet retailing and other channels are assumed to be an equal split between branded and non-branded apparel. Adding these estimates, the share of branded clothing is thereby around 80 percent.
Figure 2 Apparel sales by distribution channel (pct.)
Note: Market shares are based on estimates for apparel distribution by sales channel. Source: Quartz+Co analysis based on data from Euromonitor.
The retail brands are actors in different market segments, thus acting under different market conditions, and these can also be assessed based on industry insights and approx-imate market shares can be estapprox-imated. Again, this shows an approxapprox-imate market size of the branded segment of around 80 percent, cf. Figure 3.
0 10 20 30 40 50 60 70 80 90 100 2006 2011 Other channels Internet retailing Grocery retailers Department stores Apparel specialist retailers
The so-called global vertical retailers control the entire value chain from production to retail in own shops and they have an almost global span of their operations and presence. This is expected to be the fastest growing segment of the industry in the years to come and the segment has an estimated market share of 25 percent. The key factors of success are speed in the value chain and the ability to adopt new designs and products to rapidly changing consumer demands.
The global and premium brand segment is estimated at around 15 percent share of the market and is estimated to grow at solid rates of 2 to 4 percent per year in the coming years. The key success factors are to build the brand and protect the brand. The firms in this segment use a combination of own stores and other retail outlets.
The mid-market brands and regional verticals is the largest segment of the clothing in-dustry with an estimated market share of around 40 percent and with an estimated growth rate of 2 to 4 percent per year in the years to come. The main success factors in this segment are to reduce costs by reducing the complexity in the value chain and at the same time build the brand value.
The mass-market segment is thenon-branded clothing segment of approximately 20 percent of the market. The growth is slower and the main focus is on low cost and low price.
Figure 3 Market segments within the clothing industry
Note: Market shares are based on estimates. CAGR is short for the Cumulative Annual Growth Rate. Source: Quartz+Co analysis.
1.3
The business models of branded clothing firms
The purpose of this section is to provide insight into the predominant business models within the branded clothing segments, i.e. excluding the non-branded segment. Even though the global branded clothing companies share many similarities, there is still much variation in their business models.
At a general level there are two predominant global branded clothing business models which differ in their market approach. One takes a retail-driven approach (vertically inte-grated) while the other is rooted in a wholesale-driven approach (design/wholesale). The two business models primarily differ in their approach to ownership and brand control of the retail channels and this impacts on the requirements for design and product devel-opment and the agility of the supply chain.
Retail-driven business models, such as for example INDITEX, H&M and Grupo Cortefiel, have very high retail shares of the total net revenue (>90%), a relatively low number of global sales points and many self-owned stores, while wholesale-driven firms, such as NIKE inc., VF and Levi’s, have retail shares of total revenue at around 20-50%. They have many sales points (e.g. in department stores) and fewer self-owned stores, cf. Table 1.
Table 1 Revenue and distribution channels for major firms
Business model
Examples
(annual net revenue, billion €)
Retail share of total net revenue Typical number of sales points per firm Typical number of own stores per firm Retail driven Inditex (€14 bn) H&M (€12 bn) Cortefiel (€1 bn) Above 90% 2.000-5.000 sales points globally 1.500-5.000 own stores globally
Wholesale driven NIKE inc. (€20 bn) VF Corporation (€7 bn) Ralph Lauren (€5 bn) Levi Strauss (€4 bn) Between 20% and 50% 20.000-50.000 sales points globally Less than 1.000 own stores globally
Note: Based on publicly available information from the firms listed in the table for latest financial year (mostly 2011). Retail stores include Owned & Operated stores (i.e. direct to consumer stores). Source: CE and Quartz+Co analysis based on annual reports of the firms.
1.4
Geographic distribution of the value chain
Based on the publicly available information on the pattern of global sourcing and manu-facturing, the majority of manufacturing takes place in Asia, while some manufacturing is also carried out in Europe and the Americas. The activities that make up the global value chain for branded clothing companies are shown in Figure 4.
Figure 4 The value chain for branded clothing companies
Note: Inbound transportation takes place from suppliers to the distribution centre and outbound transportation from the distribution centre to the sales channels.
Source: EBCA member interviews; Quartz+ Co analysis.
In terms of the geographical location of each activity, our industry research revealed the following about each of the above activities:
• Brand & product development
This activity is closely tied to the brand’s cultural identity and geographical origin. The majority of these activities are therefore located in the country where the brand originates.
• Sourcing
A high share of the sourcing activities takes place in sourcing offices located in proximity to the manufacturing sites, e.g. China, India or Hong Kong.
• Manufacturing
The vast majority of this activity takes place outside the EU27.
• Logistics
All their logistics activities serving Europe are located in Europe.
• Sales and Marketing
Fully located in Europe.
• Retail Channels
The retail channels located in EU27 by definition leads to activities in these coun-tries.
Our analysis of the selected branded firms shows that the geographical split of the reve-nues differs between the two business models. The retail-driven firms we have researched incidentally tend to have a high share of their total revenue in Europe with around 70 percent to 85 percent of total revenues from Europe, which also corresponds to the geo-graphical split of their own stores. Based on the researched firms operating a wholesale-driven business model, we see that these firms have a lower share of total sales in Europe, of around 20 percent to 25 percent, cf. Table 2.
Table 2 Revenue and European share for major firms
Business model
Examples
Annual net revenue, billion €
Typical share in Europe (revenue)
% of total revenue, 2011
Typical share in Europe (number of stores)
% of total retail stores, 2011
Retail driven & European origin
Inditex (€14 bn) H&M (€12 bn) Cortefiel (€1 bn)
70%-85% ~ 80%
Wholesale driven & non-European origin NIKE inc. (€20 bn) VF Corporation (€7 bn) Ralph Lauren (€5 bn) Levi Strauss (€4 bn) 20%-25% Not available
Note: Based on publicly available information from the firms listed in the table. Retail stores include Owned & Operated stores (i.e. direct to consumer stores).
Source: CE and Quartz+Co analysis based on Annual Reports and company websites.
It should be noted that the firms in our sample operating a retail-driven business model are of a European origin, while the firms used as examples of the wholesale-driven busi-ness model are of a non-European origin.
Furthermore we stress that this does not necessarily imply that the global branded cloth-ing firms of a non-European origin have a smaller economic footprint in Europe than the firms originating from Europe. A large global branded clothing and footwear firm like NIKE inc. have sales of €4 billion to €5 billion per year in Europe which implies a signifi-cant share of the retail and transport and logistics work being carried out in Europe as per the above analysis of the location of the economic footprint along the value chain.
While the manufacturing of the products tends to take place outside Europe, the above value chain analysis suggests that a significant amount of the activities that take place after manufacturing, are fully located within Europe, while the location of those activities that take place before manufacturing depends on the origin of the brand.
There is also a significant economic footprint in Europe in the processes lying before the manufacturing step in the value chain, namely the brand, design and product develop-ment part of the value chain. Global branded clothing firms vary in their level of brand and product development activities in Europe. There is no one-to-one relation between location of production and the location of the brand and product development activities, because they are closely tied to the brand’s cultural identity and geographical origin. Hence, global branded clothing firms whose brands originate in the US have the majority of their brand and product development located in the U.S. whereas the European origi-nated brands (INDITEX, H&M and Grupo Cortefiel) have the majority of these activities located in Europe. However, again there are exceptions to this pattern, and some of the U.S. originating firms have design centres in Europe as well.
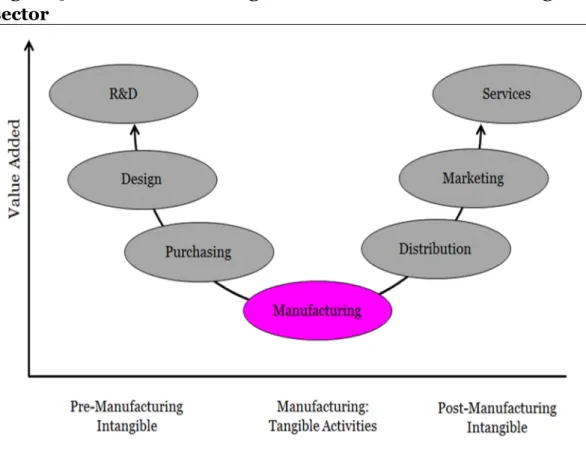
The jobs created in Europe by the activities of the branded clothing firms tend to be high-ly specialised and highhigh-ly skilled jobs in e.g. logistics management, marketing or design. In terms of the value added generated in each stage of the chain, some activities create more value added than others. This is illustrated in Figure 5, where each stage of the global value chain is plotted against the value added that it brings to the final product (see Box 1 for a description of each step in the value chain). The actual manufacturing of the product (a shoe, a shirt or a coat) is the stage that accounts for least of the value added, while activities taking place both before and after manufac-turing are the most important in terms of value added (see section 2.1 for a quan-titative analysis of this).
As shown above, Europe has shifted away from the parts of the value chain which con-tributes least value, and enhanced activities in the parts of the value chain where the most value is generated. This is a trend that, from an overall socio-economic perspective, should be continued and strengthened.
Box 1 Definition of the different steps in the value chain in the
clothing sector
• R&D
R&D is the first step in the value chain and includes activities related to product and pro-cess innovation in addition to research on consumer markets. Examples of jobs generat-ed in this stage include technical professionals such as engineers and natural scientists (development of new textiles etc.).
• Design
The design of the product and its components is an important stage of the apparel value chain and provides the product with a strong competitive advantage. Jobs in this step of the value chain are often highly specialized and creative jobs.
• Purchasing
This step of the value chain includes purchasing and transporting textile products for fur-ther processing. Logistics and the management of supply chain coordination are an im-portant activity in this step.
• Manufacturing
This step includes the actual manufacturing of the product. Examples of job functions in-clude production workers, craftsmen and machine operators.
• Distribution
In this step the final product is distributed and sold via wholesalers, etc. Examples of job functions include logistics and sales.
• Marketing and Sales
This step includes all activities associated with pricing, selling and distributing the prod-uct to the final consumer. Jobs within branding, advertising and sales are important ac-tivities in this step.
• Services
This includes international business or fashion consulting.
Source: Copenhagen economics using information from Fernandez-Stark, Frederick and Gereffi (2011) and Economix (2007).
Figure 5 Value added in the global value chain in the clothing
sector
Note: Fernandez-Stark et al. (2011) refer to manufacturing as production. Source: Modified from Fernandez-Stark, Frederick and Gereffi (2011).
1.5
Future trends for branded clothing business models
Based on company interviews we have identified six key industry trends impacting the future for branded clothing business models:1) Increasing global expansion
2) Increasing share of branded retail/branded space 3) Continued focus on cost competitiveness
4) Continued focus on product innovation
5) Increasing focus on sustainability and CSR and 6) Extracting value from online and multichannel retail.
Figure 6 Key trends affecting the branded clothing businesses
Source: Annual reports; Interviews; Quartz+Co analysis.
The increased international expansion and focus on retail increases the complexity of the business models both in the supply chain and in the management of sales channels. Alto-gether, this increases the need for responsiveness throughout the value chain.
1.6
Factors influencing the location of economic activity
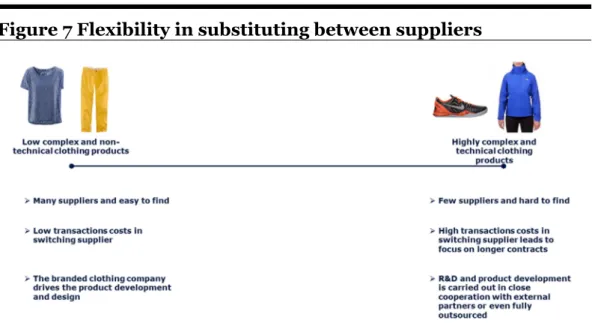
Our analysis points to a number of factors driving the choice of location for the various parts of the value chain. CSR compliance and sufficient manufacturing capacity are pre-requisites for choosing where to source from and locate manufacturing. Other key factors are competences and quality as well as the speed and flexibility of the value chain. Clearly, the weight attributed to these factors varies from firm to firm. When these critical factors are fulfilled the aggregate cost level is decisive for choosing where to source from or locate manufacturing. Although the costs and complexity derived from trade policies are important for the aggregate cost level, the by far most important cost factor is labour costs.The clothing category and product type have a great influence on design, sourcing and manufacturing processes and the flexibility in substituting between suppliers. From the interviews with global branded clothing firms it is evident that the product type is im-portant for the cooperation with suppliers. For highly complex and technical clothing products, e.g. outdoor and footwear and to some degree also denim and leather with a high degree of craftsmanship, the branded clothing firms enter into close cooperation
with suppliers both in the fabric R&D and product development phase and also in the sourcing and manufacturing phase. Accordingly, for these products branded clothing firms have limited flexibility in switching between suppliers and become more dependent on these suppliers. In comparison, the dependence on suppliers is limited for less com-plex product types, cf. Figure 7.
Figure 7 Flexibility in substituting between suppliers
Source: EBCA member interviews; Quartz+Co analysis
1.7
Key policy factors influencing value creation
Overall, we see three key factors influencing the sourcing decisions made by branded clothing:
• EU trade policies affect, but are not decisive for, the sourcing and manufacturing decisions.
• Manufacturing capacity, competences and quality and the cost of labour are the key drivers for sourcing from Asia.
• There is currently no scope for moving large scale branded clothing sourcing or manufacturing to Europe, since neither manufacturing capacity nor competences are available in Europe.
EU trade policies add further costs and complexity to the global supply chain and particu-larly to sourcing and manufacturing planning and processes for major global branded clothing companies. Global branded clothing firms would in general benefit from further liberalisation of trade barriers, which would lead the branded clothing companies to in-vest more and grow their businesses in the EU.
Chapter 2
The economic contribution in
Europe
Due to increasing globalisation of the value chain and a sharp increase in imports, the branded clothing industry in the EU27 has undergone significant structural changes over the last decades.
In this chapter we analyse how this process has affected the industry as a whole and its economic footprint within the EU27. In order to quantify the economic impact of the sec-tor, we provide two distinct analyses, which allow us to determine the direct and indirect effects of the branded clothing value chain on EU27 GDP and employment.
Finally, we analyse developments in the trade position of the EU27 in the apparel indus-try. While imports have risen relatively more than exports, resulting in an increased trade deficit in the sector, the value of the products exported from the EU27 have risen relative-ly more than the products imported. Based on previous findings from Belgium, we argue that this is consistent with import competition as a source of quality upgrading in the EU27 industry.
2.1
Contribution to GDP
We apply two distinct approaches to assessing the economic contribution of the branded clothing industry in Europe.
In the first, we take a manufacturing oriented approach and we conduct a so-called input-output analysis, which allows us to determine the direct and indirect effects of the manu-facturing parts of textile, clothing, leather and footwear on EU27 GDP and employment. We do so for the period since 1995 which allows us to comment on changes through time. We find that, while the manufacturing-driven contribution has declined over time, it is still significant in size.
In the second, we take a value chain approach and assess the value creation by working our way backwards from final consumption of branded clothing products and estimate how this final consumption generates value added in different parts of the value chain. This analysis shows that although a large share of the actual manufacturing takes place outside Europe, a significant share (50-80%) of the value derived from final consumption in Europe stays in Europe.
Input-output based analysis of manufacturing-driven contribution
In this section we analyse the direct, indirect and wider impacts of the manufacturing parts of the European textile and clothing industry combined, and of the European foot-wear and leather industry alone, on the EU27 economy.6
The direct impact on the combined Gross Domestic Product (GDP) of the EU27 comes from the value added that is generated by activities within the industries themselves. In-direct effects arise through the purchases of intermediate goods and services from suppli-ers within the EU27, who may, in turn, also purchase parts of their inputs from within the EU27. This process is illustrated in Figure 8.
Figure 8 Illustration of the direct and indirect impacts of the
TLC industries on the combined GDP of the EU27
Note: A minor component of the firms’ revenue is production taxes less subsidies. We do not include this component in the industries’ contribution towards GDP.
Source: Copenhagen Economics.
In order to calculate the direct and indirect impact of the TLC sectors we conduct a so-called input-output analysis. To do so, we use data from The World Input-Output Data-base (WIOD), which combines the purchases of goods and services by industries within countries, with trade data on the purchase of goods and services between countries. The
6 To ensure comparability across countries and time, statistical agencies and databases classify industries and prod-ucts on the basis of a standard set of codes. In the WIOD database, the textile and clothing industry is aggregated
in-database covers all 27 EU countries and 13 other non-EU countries over the period since 1995.7
The results for the most recent year show that across the region, activities within the EU27 clothing and textile industry generated value added of 1.5 percent of the region’s total GDP.
The equivalent results for 1995 show that the direct and indirect impact of the textile and clothing industry and the leather and footwear industry, accounted for 2.8 percent of the combined GDP of the countries that make up today’s EU27.
It is important that the above assessment only covers the direct and indirect GDP contri-bution from the manufacturing part of textile, clothing, leather and footwear in Europe and the pre-manufacturing purchases related to these activities in terms of suppliers to the manufacturing process.
Bringing these results forward to the most recent year, 2012, we find a significant larger impact when taking all activities throughout the value chain into account. This is done in a recent report from the European Commission, in which it is estimated that the fashion industry as a whole (including jewellery and accessories in addition to textiles, clothing, leather and footwear), contributes 3 percent to European GDP.8 Given that the branded
segment covers approximately 80 percent of the market, we estimate that this segment alone contributes 2.4 percent to European GDP.9 This contribution is composed of value
added generated through activities within manufacturing enterprises and their EU sup-pliers, (contributes with 1.2% to total GDP) as well as through activities in the remaining part of the value chain (also 1.2% of total GDP).
The value chain and its economic contribution in Europe
To capture a more comprehensive and detailed picture of the entire value chain, we assess the value creation from the perspective of the final consumption. To illustrate, we use the example of a pair of women’s summer shoes, taken from a study by the Swedish Board of Trade, Kommerskollegium (2007). The shoes are produced by a Dutch shoe company (Intermedium) and the manufacturing takes place in China. It should be noted, that all figures are obtained by Kommerskollegium from Intermedium and are based on the cost-structure of a real pair of shoes, sold in the EU market in summer 2007 (Kommerskolle-gium, 2007).
In Figure 9 we illustrate the geographical distribution of the various costs involved in the production. The retail price is €19.95, and in the analysis we walk our way through the value chain to see how these shoes create value at the various steps in the chain both in Europe and abroad.
7 Despite the availability of data from 2009, we use that from 2008, as 2009 was at the height of the crisis and may therefore be a somewhat atypical year.
8 European Commission Staff Working Document. 2012. “Policy options for the competitiveness of the European fashion industries – ‘Where manufacturing meets creativity’”.
In the top part of the figure, the value chain is divided into five stages including RDD (Re-search, design and development), material inputs, production, logistics and distribution and retail. Each of these are in turn divided into EU and Non-EU, with the size of each rectangle indicating the share of the final value of the shoe (retail price), that is accounted for by each stage and geographical region.
The first stage of the value chain (Research, Design and Development, RDD) includes the design and the physical development of the shoe, which takes place in the EU. This is followed by production and quality controls carried out by Europeans in China, where the sample production takes place (Kommerskollegium, 2007).
The actual production of the shoe also takes place in China using materials from, most likely, Pakistan. Hereafter, the shoe is shipped to the EU, which Kommerskollegium (2007) note is often done by the Danish-owned Maersk Line. In addition to shipping, other costs include insurance, tariffs (8% which also accrue to Europe) and transport to the retailer. The retailer buys the shoes at €6.65 a pair and sells them to the final consum-er for €19.95 (Kommconsum-erskollegium, 2007).
Figure 9 The cost of a pair of women’s summer shoes
Note: Kommerskollegium (2007) have obtained all underlying figures from Intermedium. They relate to a real pair of shoes selling on the EU market in the summer 2007. In Kommerskollegium (2007), none of the costs of the production stage accrue to the EU, as the gross profits of the EU company and its costs of marketing and administration are included separately. We have instead chosen to treat these as part of the production costs. RDD is short for Research, design and development.
In terms of the share of value added that go to the EU, the Kommerskollegium (2007) calculates this to be 55 percent. However, this is based on the price that the retailer pays (€6.65) and do not include the additional value added that is generated in the retail stage in the shape of wages to employees and profits to shop owners, which in turn would in-crease the EU value added. If we calculate the EU share of value including the value in the retail part, we find that 80 percent of the value accrues to Europe, while the shoe is pro-duced in China.
The figure is, as mentioned, based on a pair of shoes belonging to the cheaper segment of the market, where R&D and design costs may be significantly lower than for a pair of high quality branded shoes. Based on approximate costs provided by a number of more high-end EU-based shoe companies, the Kommerskollegium (2007) provide similar calcula-tions for other segments of the market. Again, the EU share of value added is calculated based on the price that the retailer pays and not the final consumer price, cf. Table 3. However, in order to provide the reader with a point of reference, we have included the final consumer price in column two.
Table 3 The EU share of value added
Company Consumer
price Share EU Value added Produced in
Traditional manufacturer 100% The EU (Italy, Spain etc)
Camper N/A Roughly 80% China and Morocco
DC Company €149.95 79% Vietnam and China
Brownings €44.95 67% China and Vietnam
Heerkens €89.95 58% China
Intermedium €19.95 55% Almost only China
Traditional importer €19.95 34% Mostly in China and Vietnam
Note: The underlying cost figures for each named company, aside from Intermedium, are based on approx-imations provided by each company to the Kommerskollegium (2007). No figures were provided by
Camper. The EU share of value added is instead estimated by Camper themselves, based on their av-erage shoe (Kommerskollegium, 2007).
Source: Adapted from Kommerskollegium (2007) by Copenhagen Economics to include the consumer price.
Aside from shoe models by specific companies, the table also include the generic ‘tradi-tional manufacturer’ and ‘tradi‘tradi-tional importer’. The former refers to a shoe company that produces their shoes within the EU27 as opposed to outsourcing their production to re-gions outside of the EU, as is the case for all other models included (see column 4 in Table 3). As all stages of the production are assumed to occur within the EU, the EU share of value added will necessarily sum to 100 percent, regardless of the cost structure. The ‘traditional importer’ on the other hand is the case of a shoe company based outside of the EU. The share of value added accruing to the EU is calculated by the Kommerskol-legium (2007), based on the cost-structure of the cheapest pair of shoes, provided by In-termedium. It is assumed that the only part of the total costs that go to beneficiaries with-in the EU (aside from retailwith-ing, which is not with-included) are the costs associated with logis-tics and distribution in addition to tariffs and some profits. However, even without any of the design and R&D activities taking place in the EU, the value added is still 34%, not
including the additional value added that is generated through activities in the retail sec-tor.
While it is important to underline that the cost-structure of other parts of the branded clothing sector may differ from the above example, it illustrates the relative economic importance of the various stages of the global value chain well.
Finally, the above analysis shows that the global branded clothing firms, regardless of their origin and ownership structure , contributes significantly to the European economy through the various stages of the value chain. Indeed, these firms did outsource a signifi-cant part of their manufacturing to locations outside of the EU, but they are still generat-ing significant activity in areas such as R&D, design and marketgenerat-ing.
The jobs that are now being generated are high value added jobs that are very strongly correlated with the success of the branded clothing firms. As noted by the OECD (2013a) in reference to the very same example, such jobs may therefore exist because of outsourc-ing, which allows the branded clothing firms to keep costs down and stay competitive enough to remain in the market. Similarly, the post-manufacturing stages of the value chain (transport, logistics and retail activities) also contribute positively to jobs and value added in Europe, and again the volume growth of the market driven by lower costs and lower prices to consumers also generates more transport, logistics and retail related jobs, which are bound to be located in Europe.
Hence, while globalisation on the one hand has led to a decrease in manufacturing activity within Europe, as shown in the previous analysis, it also provides opportunities for the European textile, leather and clothing (TLC) sector and supports the development of high value added activities within Europe.
2.2
Contribution with respect to trade
The EU27 is the world’s second largest exporter of textile and clothing products after Chi-na10. In 2012, the combined EU27 exports of clothing and textile products to non-member
countries totalled €41.2 billion, while imports from non-member states totalled €88.7 billion. Exports of footwear to non-member countries were valued at €7.5 billion in the same year, while imports of footwear reached a total of €15.6 billion.11
Including Intra-EU exports, the EU27 accounted for 30.4% of the world’s export of tex-tiles and 32.5% of the world’s export of clothing products.12
The largest export markets for EU textile and clothing products, outside of the European Union, include Switzerland (11.2%), the US (10.5%), Russia (10.3%), Turkey (6%), China (5.8%), Hong Kong (4.6%), Japan (4.5%), Tunisia (3.5%) and Morocco (3.4%).
10 World Trade Organisation: International Trade statistics 2012
These are also the main destinations for footwear products, with the largest being the US (16%), followed by Russia (15%), Switzerland (14.2%), Japan (5.6%), Hong Kong (5.4%), Turkey (4.8%) and Norway (3.4%).
Imports mainly come from Asia, with China alone accounting for 39% of EU imports of textile and clothing products from Non-EU countries followed by Turkey (13%), Bangla-desh (9.6%), India (7%), Pakistan (3.2%), Tunisia (2.7%) and Morocco (2.5%).13
Net export
In this part of the report, we look closer at trade in apparel products. Figure 10 shows the development in the export and import aggregated over all current EU27 member coun-tries. Trade flows are measured in current euro values and excludes intra-EU27 flows. As the figure shows, imports have risen relatively more than exports over the period. Thus, in 1999, exports constituted 33 percent of imports, whereas this had fallen to 27 percent in 2011, at which point total EU27 import of apparel products exceeded exports by €50 bil-lion.
Figure 10 Extra-EU27 trade in apparel product (Euro, billion)
Note: Extra-EU27 trade current values. The apparel sector covers product groups 61 (articles of apparel and clothing, knitted or crocheted) and 62 (non- knitted or crocheted) according to HS2 classification. Source: Copenhagen Economics, using data from Eurostat [DS-016894].
As mentioned, the origin of goods arriving into the EU27 reflects the increasing role of Asia and especially that of China. In Figure 11, we show the change in the share of EU imports from non-member states from 2000 – 2011. The figure shows the changes only for the most important partners, defined as those from which at least 5 percent of the total EU import of apparel products from non-member states originated in the year 2000. The share of apparel products imported from China rose from 19 percent of all non-EU imports of apparel products in year 2000 to 44 percent in 2011.
0 10 20 30 40 50 60 70 80 1999 2000 2001 2002 2003 2004 2005 2006 2007 2008 2009 2010 2011 Bill. Euro Imports Exports Exports equal 27% of imports Exports equal 33 % of imports
Figure 11 Import of apparel by origin
Note: The apparel sector covers product groups 61 (articles of apparel and clothing, knitted or crocheted) and 62 (non- knitted or crocheted) according to HS2 classification.
Source: Copenhagen Economic using data from Eurostat [DS-016894]..
Increased import competition and quality upgrading
The removal of quantitative restrictions on imports of textiles and apparel into the US and the EU27 in 2005 has been studied by a number of authors. Findings by Monfort et al. (2008) point towards a positive association between the increase in import competi-tion from China and a move towards a more skill intensive industry producing higher quality products, Box 2.
Box 2 Import competition and quality upgrading in the Belgian
textile industry
Monfort et al. (2008) study the effect of Chinese import competition on the Belgian textile industry. Using product level trade data, they find evidence of a widening gap between the unit values of Chinese and Belgian textile exports to the EU15 over time. Significant increases occur in 2001 when China became a member of the WTO and in 2005 when quotas on the imports of textiles and apparel products were removed from the EU market. As unit values are commonly used as a proxy for price and thereby product quality, the results are suggestive of an increased gap in the quality of the products that are imported and those that are produced and exported from Belgium. The authors complement their sector analysis with firm-level data on Belgian textile producers. Their results show that China’s entry into the WTO in 2001 and the subse-quent removal of quotas in 2005, led to a restructuring of the Belgian textile industry towards smaller firms with a higher reliance on skilled workers and an increase in the capital intensity of production.
Source: Monfort et al. (2008). 0 5 10 15 20 25 30 35 40 45 50 Percentage 2000 2005 2011
While it is possible that part of this may be due to an increase in the outsourcing of low-quality goods, the findings suggest that a more liberalized trade regime may lead produc-ers in high-wage countries to move further ‘up the quality ladder’ towards the production of high value added goods, instead of killing off production completely.
The theory underlying these findings suggest that instead of competing for the same seg-ment of the market, producers in low-wage countries will specialize in the production of lower quality goods that are produced using low-skilled labour, while producers in high-wage countries will move towards a more capital intensive and high-skilled labour pro-duction, which are factors that are relatively scarce in low-wage countries (Monfort et al. 2008).
In order to give a first indication of whether there is any evidence of a similar quality up-grading in the EU27 apparel industry, Figure 12 shows the evolution of the unit values of EU27 exports and imports of knitted and non-knitted apparel products. Data comes from Eurostat, in which units are measured in 100’s of kilos and values are given in current prices14. In order to account for possible changes in the composition of specific goods
within each product group, the unit values are calculated at the 6-digit level and averaged across each product category.15
Comparisons between the export and import series, within each product group, shows that the unit values of the EU27 exports have risen relatively faster than the unit values of imports. Hence, the value of one unit of exports of knitted or crocheted apparel exceeded the value of one unit of import in the same product group by a factor of 2.4 in 2000 and a factor of 3.2 in 2011. The observed increase in the differences in unit values may of course be driven by other factors than quality differences, such as for example exchange rates.16
However, the observed evolution is in line with the hypothesis of quality upgrading. Evi-dence of a development towards a more skill-intensive industry, presented in section 2.3, adds further support to this conclusion.
14 Comparisons through time should therefore be limited to developments in exports relative to imports. 15 By using this methodology we follow Monfort et al. (2008)
Figure 12 Export and import unit values
Note: The unit values are calculated as the weighted average of the unit prices of all HS 6-digit products, within each 2-digit product group (knitted and non-knitted). The weight assigned to all 6-digit prod-ucts is the prodprod-ucts share in total exports of the 2-digit product group. Unit prices are shown in cur-rent values.
Source: Eurostat Comext (DS-016893).
Trade in value added
When production is globally fragmented, traditional measures of gross trade flows have some clear disadvantages. As goods are counted every time they cross a border, gross export flows may be a poor indicator of the value that is generated domestically (OECD-WTO, 2013).
One of the most cited examples of this is the production of Apple’s iphone, which like many textiles and apparel products, is assembled in China, but which uses inputs from all over the world. According to conventional measures of gross export flows, China is the main beneficiary of exports of iphones. However, as shown by Xing and Detert (2010), the actual assembly of the product only accounts for 3.6% of the production costs.
Furthermore, as was illustrated through the example of the shoes above, imports may contain a significant share of domestic value added. Imports may also be an important source of competitiveness for exporters, who rely on imported intermediate inputs in their production. Neither of these aspects are evident in gross measures of imports (OECD-WTO, 2013).
In recognition of such limitations, the WTO and the OECD has published a new database,
0 1000 2000 3000 4000 5000 6000 7000 8000 9000 10000 Euro/ 100 kg
Eksport (knitted or crocheted) Import (knitted or crocheted)
the EU27. In Figure 13, we show the split between foreign and domestic value added con-tained in gross exports by the TLC sector across 21 EU-member countries. Aside from Luxembourg, it is clearly the case that the majority of value added accrues to domestic sources. However, the share of foreign value added is not insignificant, ranging from 13% in Greece to 46% in the Slovak Republic, underlining the globalisation of the value chain and the role that imports play in generating exports.
Figure 13 Domestic and foreign value added in gross exports in the TLC
industries 2009 (%)
Source: WTO-OECD (Trade in Value Added database)
Similarly, besides bringing significant consumer benefits, imports also generate domestic value added. Imports are generally not considered as a source of domestic value added, but in the case of the branded clothing value chain, this is indeed an important feature. As can be seen from Figure 14, the domestic share of value added, embodied in gross im-ports, range between 20% in Portugal to 29% in Hungary and averages around 25%.
77 68 58 73 58 72 68 73 87 63 67 86 21 65 70 69 54 62 83 71 81 23 32 42 27 42 28 32 27 13 37 33 14 79 35 30 31 46 38 17 29 19
Figure 14 Domestic and Foreign value added in gross imports in
the TLC industries 2009 (%)
Note: Domestic value added in gross imports is calculated as gross imports less foreign value added embod-ied in gross imports.
Source: OECD/WTO (Trade in Value added database)
2.3
Contribution to employment in Europe
In this section, we look closer at the employment changes in the TLC industries in the EU27. We begin by discussing changes to employment in the EU27 TLC industries, which only include firms engaged in the manufacturing of TLC products. Hereafter, we move on to other parts of the value chain, including retail. The statistics presented show that while employment in the manufacturing part of the value chain has been in decline over the last decade, employment within the retail part of the value chain is starting to increase. While the size of the industries has decreased significantly across the EU27, important changes have also occurred in the type of jobs that are being undertaken. As shown and discussed in Economix (2007), the type of jobs that are generated within this industry is increasingly higher skilled jobs, with an increase in management, engineers and other professionals in the ‘old’ member states.
In 2010, the TLC industries employed a total of 1,9 million people across the EU27, equivalent to 7 percent of total employment in the manufacturing sector. The distribution of employment across the three industries is shown in Figure 15.17 The clothing industry is
by far the greatest source of employment and accounts for almost half of the total number of employees. 75 74 75 77 76 75 76 75 79 71 79 74 73 76 77 80 72 76 76 75 76 25 26 25 23 24 25 24 25 21 29 21 26 27 24 23 20 28 24 24 25 24
Figure 15 Employees by industry in EU27, 2010
Note: Employees only include persons who work for an employer, who have a contract of employment and who receive compensation. Sectors are classified according to NACE Rev 2.
Source: Copenhagen Economics using data from Eurostat [sbs_na_ind_r2]
While the industries still account for a significant share of employment in the manufac-turing sector, both their relative and absolute importance as a source of employment has been decreasing over time.
The picture of an industry that is becoming more skill intensive also emerges when we look at changes in the distribution of skill type among the employees. In Figure 16, we plot the share of hours worked by low-, medium- and high-skilled employees in the textile and apparel industries in France, Italy, Spain, Portugal, Poland and Hungary in 1995 and 2009.
The data used comes from the WIOD database. Based on labour force surveys from EU-ROSTAT, the authors of the database have estimated the share of all hours worked by skill-type. The latter is based on the level of education attained by the employee according to the 1997 International Standard Classification of Education. According to this classifi-cation system a person with a primary or lower secondary educlassifi-cation is defined as low-skilled, while medium-skilled persons are those with an upper secondary education and high-skilled persons are those with a tertiary education.
Textiles 31% Apparel 49% Leather 20%
Figure 16 Increasing skill intensity in the clothing industry
Note: Hours worked by skill type (percentage). The shares are estimated by the authors of the WIOD data-base.
Source: WIOD, socio-economic accounts.
As part of a series of sector specific studies on skills and jobs, commissioned by the Euro-pean Commission in 2007, Economix (2007) examine employment and occupational trends in the TLC sector, including likely developments until 2020. Conditional on the continuation and strengthening of the current growth in international trade, allowing firms to take advantage of the global division of labour, the authors argue that jobs within the TLC sector in the EU will be focused on specific areas such as product innovation, value chain management, design, marketing and sales, whereas manufacturing will con-tinue to move to low-cost countries in Asia. The high-skilled occupations that will benefit from this development lie in both the technical and commercial part of the value chain. In particular, the authors point to an expected increase in demand for employees in areas such as engineering, natural sciences (development of new textiles), designers, business professionals, managers, computer specialists and employees within the area of service and sales.
The changing skill-structure of the industry adds further support to the conclusion of quality upgrading. Furthermore, it is in line with studies which find that firms which engage in outsourcing or so-called offshoring, tend to increase their share of high-skilled employees domestically, as the demand for headquarter services or functions such as R&D increases (see Box 3 for a short overview of the employment effects of Irish ODI).
0% 10% 20% 30% 40% 50% 60% 70% 80% 90% 100%
Box 3 The employment effects of Irish ODI
In 2007 Copenhagen Economics carried out a study on the effects of Outward Foreign In-vestment (ODI) on indigenous enterprises in Ireland, including enterprises in the textile sector.
The study made use of in-depth interviews and econometric (statistical) methods. The key results indicate that ODI has a positive effect on labour demand and productivity within the enterprises themselves. All else equal, firms that engage in ODI were found to em-ploy, on average, 60% more employees domestically and be up to 50% more pro-ductive than firms not engaging in ODI.
The results indicate a positive correlation between ODI intensity and the change in skill structure towards a higher proportion of high-skilled workers in the enterprises’ domestic operations, in especially the manufacturing sector. With regard to the textile industry, which was found to have a high ODI-intensity and to have offshored a large number of jobs, this was found to be the industry that had increased their share of high skilled employees the most in Ireland.
Source: Copenhagen Economics.
Increasing focus on innovation and e-commerce
Furthermore, while the TLC sectors are traditionally seen as being very low-tech, evidence suggests that, at least for parts of the industry, this is no longer true. According to
Economix (2007), between 35 percent and 50 percent of enterprises in the sector are now engaged in either product or process innovation. This is particularly true for the branded clothing firms who are investing heavily in developing their brands, and in innovations to improve the value chain efficiency. By investing heavily in their brands, the branded clothing industry helps to increase overall demand for clothing, leather and shoes, and thereby not only increasing their own sales, but also the sales of the mass-market, non-branded producers.
Dachs, Zahradnik and Weber (2011) also find firms in the TLC industries, which can be compared to firms in ‘high-technology’ sectors in terms of their engagement in innovative activities. Furthermore, they argue that part of the incentive to invest in innovation activi-ties and advanced production technologies comes from the globalisation process. Increas-ing competition on the domestic market, arisIncreas-ing from imports and inward investments, forces EU producers to become more innovative and focus on different segments of the market, while outward investment by EU producers may require the development of new types of products (Dachs et al. 2011).
Using a limited sample of 64 textile and clothing enterprises located in Austria, Germany, the Netherlands and Switzerland in 2006, Dachs et al. (2011) examine the relation be-tween offshoring and domestic innovation. Their results show that out of the group of firms that had moved parts of their production abroad (35%), a significantly higher share had introduced innovations in the previous two years compared to the group of non-offshoring enterprises. While this is an interesting finding, it should be noted that it does not establish whether firms become more innovative as a result of offshoring or whether the causality goes the other way. None the less, it does point towards a possible associa-tion between globalisaassocia-tion and innovaassocia-tion within these industries.