EUROPEAN COMMISSION
An
i
ndi
cat
or
-
bas
ed
as
s
es
s
ment
f
r
amewor
k
t
o
i
dent
i
f
y
count
r
y-
s
peci
f
i
c
chal
l
enges
t
owar
ds
gr
eener
gr
owt
h
Joan
Cant
on,
Ar
i
ane
Labat
and
Ant
on
Roodhui
j
zen
Economi
c
Paper
s
401
|
Febr
uar
y
2010
EUROPEAN
ECONOMY
Affairs, or by experts working in association with them. The Papers are intended to increase awareness of the technical work being done by staff and to seek comments and suggestions for further analysis. The views expressed are the author’s alone and do not necessarily correspond to those of the European Commission. Comments and enquiries should be addressed to:
European Commission
Directorate-General for Economic and Financial Affairs Publications
B-1049 Brussels Belgium
E-mail: [email protected]
This paper exists in English only and can be downloaded from the website
ec.europa.eu/economy_finance/publications
A great deal of additional information is available on the Internet. It can be accessed through the Europa server (ec.europa.eu)
KC-AI-10-401-EN-N ISSN 1725-3187
ISBN 978-92-79-14887-3 DOI 10.2765/39167
An indicator-based assessment
framework to identify
country-specific challenges towards greener
growth
By Joan Canton, Ariane Labat and Anton Roodhuijzen
A
CKNOWLEDGEMENTSThe authors are grateful to the Chairman Lorenzo Codogno and the members of the Lisbon Methodology Working Group (LIME) attached to the Economic Policy Committee (EPC) for having provided very useful comments and suggestions. We would especially like to thank Nathalie Darnaut, Mark Hayden, Gilles Mourre, Declan Costello and Gert-Jan Koopman for guidance and comments provided. Contributions, suggestions and support by other colleagues of the Commission, in particular by colleagues in DG ECFIN Directorate B and in DG EMPL and ENV are gratefully acknowledged. Nonetheless, the views expressed in this paper are those of the authors and should not be attributed to the European Commission or Member States.
A
BSTRACTThe paper sets the basis for an indicator-based analytical framework to assess Member States' policies to promote "green growth".
An illustrative application of this new analytical framework reveals that it can be used to provide a nuanced economic assessment of Member States' environmental performance. This framework can serve to highlight country-specific strengths in addressing environmental challenges in a way that best fosters growth and jobs. To prepare for future economic policy monitoring at the EU level, a test was also run to analyse performance in various dimensions of environmental policy in combination with information about macroeconomic performance. Overall, this framework can contribute to identify country-specific challenges to create new sources of green growth; it may therefore serve to encourage relevant structural reforms bringing about a competitive greener economy.
C
ONTENTSExecutive Summary…... 8
1 INTRODUCTION... 13
2 INTRODUCING GREEN GROWTH ISSUES IN AN INDICATOR-BASED ASSESSMENT... 14
2.1 Methodology ... 14
Step 1: Determinants of “green growth”- four policy areas identified... 14
Step 2: Selecting the most relevant best-available indicators ... 15
Step 3: Computing individual scores... 22
Step 4: Aggregating and interpreting scores ... 22
Step 5: Interpreting performance... 22
2.2 Testing the assessment framework in an environmental policy context ... 23
3 TENTATIVE EXPLORATION OF POSSIBLE LINKS BETWEEN ENVIRONMENTAL AND MACRO-ECONOMIC CHALLENGES... 26
3.1 Introduction ... 26
Identifying relevant macro-economic dimensions ... 26
Confronting green and macro-economic areas... 26
3.2 Testing the assessment framework on structural reforms ... 29
Grouping countries by macroeconomic challenges to assess environmental policies ... 29
Finding common occurrences of over/underperformance along key macro-economic dimensions and “green growth” issues... 29
Analysing country-specific relations between macro-economic and environmental concerns... 30
4 ANNEXES... 32
Details of Step 2.a: Collecting and selecting relevant indicators... 32
1. Tracking reliance on cost-efficient environmental policies ... 32
2. Tracking sound use of public finances... 33
3. Tracking efforts to improve market functioning and foster competitiveness... 35
4. Tracking the “green” boost to long term productivity ... 38
European Commission Economic paper no 401
1. Minimum statistical standards ...41
2. Correlation between indicators...43
3. Recommendations for a narrow list of indicators...44
4. Robustness checks and sensitivity analyses ...48
List of indicators not included in the analysis ...50
Examples of outputs of the hands-on tools, used for exploring possible links between environmental and macro-economic challenges...57
References ...60
L
IST OF TABLES AND FIGURES Table 1: Summary of areas, domains and relevant best-available indicators... 16Table 2: Summary of consolidation of the set of indicators... 17
Table 3: Levels of green concerns by environmental area ... 25
Table 4: Level of macro-economic concern (from LAF) ... 26
Table 5: Potential interactions between green and macro-economic performances... 28
Table 6: Correlation scores for Indicators in area I... 45
Table 7: Correlation scores for indicators in area II... 45
Table 8: Correlation scores for indicators in area III ... 46
Table 9: Correlation scores for indicators in area IV ... 47
Table 10: Weights applied in area I. Cost-efficiency ... 48
Table 11: Weights applied in area II. Sound use of public finances ... 48
Table 12: Weights applied in area III. Strong markets... 48
Table 13: Weights applied in area VI. Long-term productivity ... 49
Table 14: Available environmental indicators not included... 50
Figure 1: Breakdown of “green growth” issue into policy areas and domains ... 8
Figure 2: Approach to assess Member States' performance in green growth dimension ... 8
Figure 3: Member States' scores per environmental area... 9
Figure 4: Interactions between green and macro performances ... 10
Figure 5: Framework to assess performance and identify greener growth challenges... 12
Figure 6: Summary of the approach from Step 1 to 5 ... 23
Figure 7: Member States' scores per environmental area... 24
Figure 8: “Green” performances for countries with low unemployment concern... 57
Figure 9: “Green” performances for countries with medium unemployment concern ... 58
Figure 10: “Green” performances for countries with high unemployment concern ...59
L
IST OF ABBREVIATIONS AT Austria BE Belgium BG Bulgaria CY Cyprus CZ Czech Republic DE Germany DG Directorate-General DK Denmark EE EstoniaEEA European Environmental Agency EIB European Investment Bank EMCO Employment Committee EMPL Employment
ENTR Enterprises and Industry ENV Environment
EPR Environmental Policy Review ES Spain
ETR Environmental Tax Reform ETS Emissions Trading Scheme EU European Union
EUR Euro FI Finland FR France
GBAORD Government budget appropriations or outlays on R&D GDP Gross Domestic Product
GHG Greenhouse Gas
GR Greece HU Hungary IE Ireland IT Italy
LAF LIME Assessment Framework LIME Lisbon Methodology Working Group LT Lithuania
LU Luxembourg LV Latvia
MBI Market Based Instruments
MS Member State
MT Malta NL Netherlands
OECD Organisation for Economic Cooperation and Development PL Poland
PM Particulate Matter PT Portugal
R&D Research and Development RO Romania
SCP Sustainable Consumption and Production SE Sweden
SI Slovenia SK Slovakia
SME Small and Medium-sized Enterprises TAXUD Taxation and Customs Union TFP Total Factor Productivity TREN Transport and Energy UK United Kingdom
European Commission Economic paper no 401
E
XECUTIVE SUMMARYThe EU aims to lead, compete and prosper as a greener, knowledge-based economy, growing fast and sustainably and creating high levels of employment. To mobilise new sources of green growth, social, economic and environmental policies need to be brought more closely together. Accordingly, tools to identify and monitor policies which can achieve a faster transition to a greener economy are needed.
This note explores the possibility of developing an analytical framework to assess Member States' policies to achieve their climate change goals from an economic perspective and notably to promote “green growth”. In particular, it outlines some tentative ideas for an indicator-based assessment of Member States policies in a number of important economic dimensions of what could be their “green growth” strategies. This paper remains a test run, which is certainly not meant to draw firm policy conclusions. While in the future, this indicator-based assessment framework could become an analytical tool – amongst others – to help design policies in the environmental area, it will by no means become a “mechanical rule” for policymaking.
The framework developed by the Lisbon methodology working group (LIME) to assess growth-enhancing policy areas – the LIME Assessment Framework (LAF) – which combined an indicator-based assessment with a consideration of country-specific evidence, has been a useful tool to support coordination of economic and employment policies under the Lisbon Strategy. However, it did not include the environmental determinants of growth. Besides, environmental policy monitoring has so far been centred on progress towards climate change and energy targets, and hence could not properly address inter-linkages between growth and policies supporting environmental objectives.
Therefore, we propose an indicator-based assessment framework to track how structural reforms may encourage a competitive, greener economy. This tool combines best available indicators into aggregated performance scores that measure the distance to the EU27 average and improvements over time. The tool is flexible to incorporate new, relevant indicators, as they become available. As the economic literature confirms the existence of tangible links between these indicators and growth, and as the set of indicators was streamlined using correlation and sensitivity tests, aggregated scores give a meaningful snapshot of Member States' strengths and weaknesses in relation to their transition to a greener economy.
The proposed indicator-based assessment framework detects progress in the shift to a competitive greener economy by evaluating Member States' performance in the following four areas, each reflecting a key link from environmental policies to economic growth and employment: (i) reliance on cost-efficient environmental policy instruments; (ii) sound use of public finances for environmental purposes; (iii) reinforced markets providing “green” goods and services; and (iv) increased total factor productivity resulting from measures aiming at environmental improvements. Fully capturing employment opportunities from the transition to a greener economy and adapting infrastructure accordingly are other key areas for designing optimal policies, but deeper analysis of these issues is taking place in other contexts and our tool is incomplete in this regard. By design, the framework we propose could be used for the surveillance of structural reforms, as performance improves in the four areas mentioned above when best practices are implemented in the nine domains of policy intervention identified in figure 1.
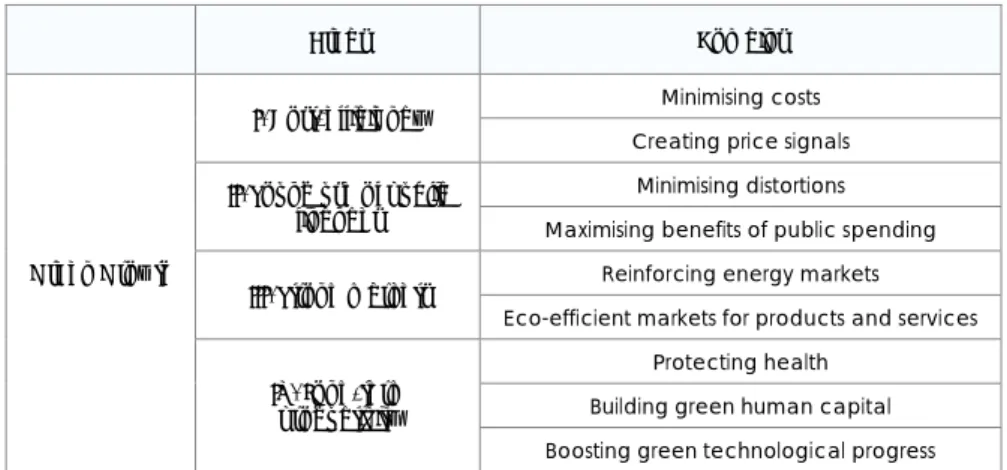
Figure 1: Breakdown of “green growth” issues into policy areas and domains
Areas Domains
Minimising costs I. Cost-efficiency
Creating price signals Minimising distortions II. Sound use of public
finances Maximising benefits of public spending
Reinforcing energy markets III. Strong markets
Eco-efficient markets for products and services Protecting health
Building green human capital Green Growth
IV. Long-term productivity
Boosting green technological progress
Figure 2 below summarises the approach taken to make a nuanced assessment of Member States' performances towards green growth.
Figure 2: Approach to assess Member States performance in the green growth dimension
Areas Scoring Indicator based assessment Qualification
I. Cost-efficiency II. Sound use of public finances III. Strong markets IV. Long-term productivity Computing aggregated scores from changes to levels of most relevant best-available indicators Interpreting the 4 aggregated scores as High, Medium or Low levels of concerns, in relation to a benchmark Drawing tentative conclusions:
- High levels of concern in one area => it may be a "green growth" challenge. - Medium/Low levels of concern in one area => either this challenge is solved, or opposing trends in domains conceal a challenge
We also present results from a preliminary “mechanical application” of the approach, for illustrative purposes only: the usual caveats apply to this type of indicator-based assessment, which in line with earlier LIME work would need to be accompanied by additional qualitative and country-specific information before any policy conclusions should be drawn.
European Commission Economic paper no 401
Figure 3: Member States' scores per environmental area
Nonetheless, this preliminary application revealed that it was possible to draw policy findings by analysing the performance scores yielded by the tool independently and combined with macro-economic information. Indeed, we found that the tool is usefulto provide a nuanced assessment of Member States' environmental performance, and contributes to identifying country-specific challenges to move to green growth, based on Figure 3:
− The indicator-based assessment framework facilitates assessment in areas otherwise difficult to capture with targets or indicators that measure the distance to these targets, making it a useful tool to monitor environmental policy. This assessment allows Member States' “green” performance to be screened based on aggregate scores, and can provide information on their performance as such, without necessarily requiring a reference to individual indicators.
− In many cases, Member States show contrasting levels of performance depending on the environmental area considered. This analysis would reveal scope for a further exchange of best practices, potentially raising the level of environmental performance across the EU.
− It can also be worth investigating performance within each of these areas, at the more disaggregated level of domains. This gives an opportunity to investigate further the consequences for a country of experiencing relative under-performance in one domain balanced by over-performance in another domain. This confirms that country-specific analysis must be performed at domain level.
Overall, an indicator-based analysis of Member States' environmental performance can bring additional insight to identify the most appropriate structural reforms to tap new sources of growth and create new jobs, while addressing environmental challenges.
To prepare for future work, a test was run to explore the interactions between macroeconomic and environmental challenges at Member State level, comparing performance in various dimensions of environmental policy with relevant aspects of macroeconomic performance. Macroeconomic
Close to benchmark Over performance Under performance Area I.
Cost-efficiency Area II. Sound use of public finances
Area III. Strong
markets Area IV. Long-term productivity -20 -12 -4 4 12 BE BG CZ DK DE EE IE G ES FR IT CY LV LT LU H MT NL AT PL PT R SI SK FI SE UK -12 -4 4 12 20 28 -20 -12 -4 4 12 -12 -4 4 12 R SI SK FI SE UK 20 BE BG CZ DK DE EE IE G ES FR IT CY LV LT LU H MT NL AT PL PT 9
variables are chosen among the growth components in the current LIME indicator-based assessment framework, for which an evaluation of macroeconomic concerns is already available. As both the environmental and the macroeconomic evaluations are implemented using the same methodology, the comparison of performance is facilitated.
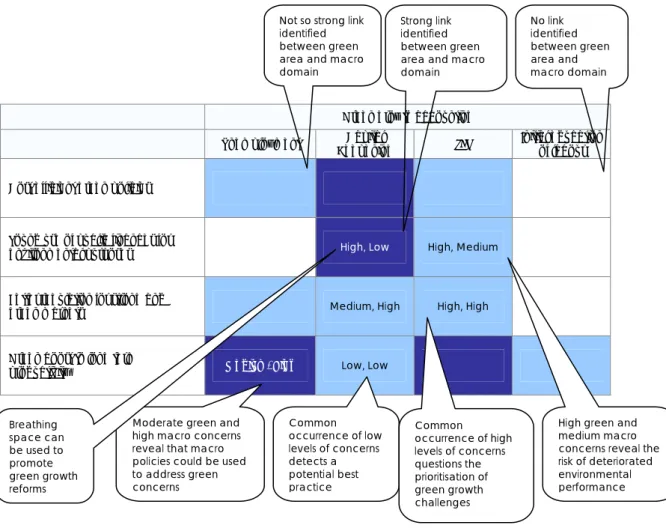
In Figure 4, [High, Low] is read as high environmental and low macroeconomic concern. The different shades of blue represent the strength of the interactions between environmental and macroeconomic areas, as identified in the literature.
Figure 4: Interactions between green and macro performances
Green growth accounting
Unemployment Deepening Capital TFP Initial education of labour
Cost efficient green policies
Sound use of public finances for
environmental purposes High, Low High, Medium
Better regulation for strong and
green markets Medium, High High, High
Green boost to long term
productivity Medium, High Low, Low
Not so strong link identified between green area and macro domain No link identified between green area and macro domain Strong link identified between green area and macro domain Common occurrence of low levels of concerns detects a potential best practice Common occurrence of high levels of concerns questions the prioritisation of green growth challenges
High green and medium macro concerns reveal the risk of deteriorated environmental performance Moderate green and
high macro concerns reveal that macro policies could be used to address green concerns Breathing space can be used to promote green growth reforms
Tentative findings shown here (and summarised in the boxes in Figure 4) about the correlation between environmental concerns and a difficult macro-economic situation encourage further deepening the economic analysis of environmental challenges and policies that matter for green growth. Existing databases on environmental policy provide a wealth of information in this regard. In particular, the exploration draws attention to two spill-over effects between growth and the environment:
− Bringing macro-economic and green growth concerns “face-to-face” allows a more nuanced assessment of Member States' environmental performance: it puts the progress made against environmental targets in perspective with economic constraints, and avoids making unrealistic requests to close gaps to environmental targets when there is no leeway to do so. Conversely, it could help encourage those countries exhibiting under-performance on environmental grounds to take more forceful or more relevant action and
European Commission Economic paper no 401
catch up with countries that have similar macroeconomic constraints but are contributing better to achieving EU environmental goals.
− It helps to identify growth-enhancing policy interventions designed for environmental purposes, or at least situations where a country manages to address macro-economic weaknesses without losing sight of its environmental commitments. It can help analyse spill-over effects from lack of progress towards environmental goals on growth components, for countries where a divergence of environmental and economic performance is observed. Conversely, it can reveal the potential for improving economic performance by better addressing environmental challenges. Other tools for environmental policy monitoring cannot systematically detect this opportunity.
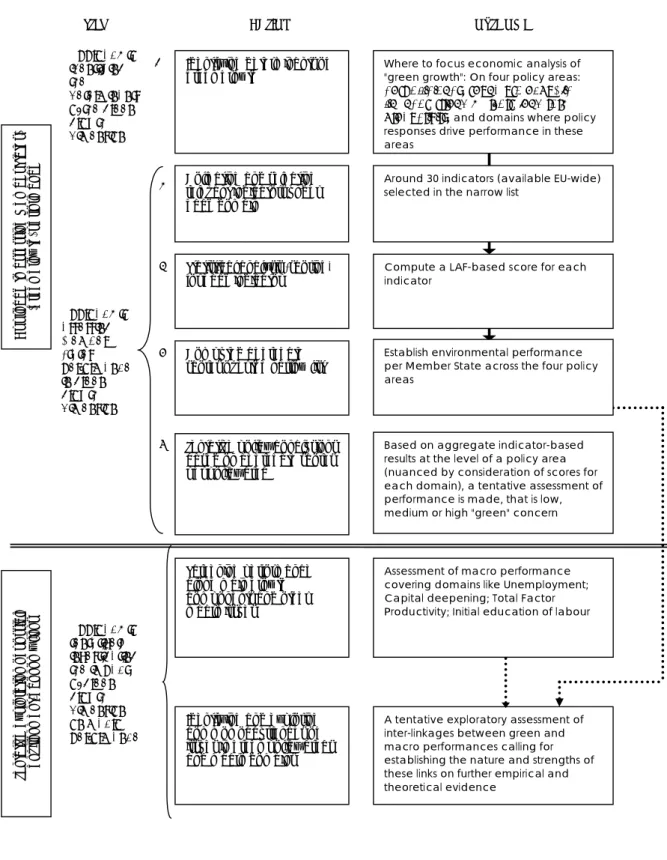
Figure 5 below provides a synthetic overview of the approach proposed for economic surveillance of structural reforms for green growth.
ACTION OUTCOME 1 4 STEP Approach to assessing Member States' performance in green growth dimension Approach to tentatively investigating the impact of green growth dimension on macro performance 2 Identifying determinants of
green growth Where to focus economic analysis of "green growth": On four policy areas:
cost-efficiency, sound use of public finances, strong markets, long-term productivity, and domains where policy responses drive performance in these areas
Collecting and selecting relevant indicators under each domain
Around 30 indicators (available EU-wide) selected in the narrow list
Statistical analysis (scoring)
for each indicator Compute a LAF-based score for each indicator
Establish environmental performance per Member State across the four policy areas
Computed aggregate scores over the narrow list
Tentative policy conclusions based on aggregate scores per policy area
Based on aggregate indicator-based results at the level of a policy area (nuanced by consideration of scores for each domain), a tentative assessment of performance is made, that is low, medium or high "green" concern
5
Screening performance along main growth components and other macro issues
Identifying and exploring common occurrences of issues in green policy areas and macro domains
Assessment of macro performance covering domains like Unemployment; Capital deepening; Total Factor Productivity; Initial education of labour
A tentative exploratory assessment of inter-linkages between green and macro performances calling for establishing the nature and strengths of these links on further empirical and theoretical evidence 3 A ppr oach t o a ss e ss ing M e mbe r S tates ' 'green gr o w th ' p e rforma nc e Tentat iv e e xpl or ation of p o ss ib le env iro nm en t-ec onom y l in ks Approach to identifying the determinants of the green growth dimension
European Commission Economic paper no 401
1
I
NTRODUCTIONThe EU has legally binding commitments in the area of climate change, namely to achieve by 2020 a reduction of at least 20% in GHG and a 20% share of renewable energies in EU energy consumption: the commitment could become more ambitious depending on the ultimate outcome of the Copenhagen climate change summit. A number of important Community instruments have already been put in place, including an EU emissions trading scheme: these EU level instruments are expected to make a significant contribution (up to 50%) to achieving the 20:20:20 objectives1.
The remainder will have to be accomplished through policy measures at Member State level, which given their potential scale could have macroeconomic effects in terms of growth, jobs and public finances.
This note explores the possibility of developing an analytical framework to assess Member States' policies to achieve their climate change goals from an economic perspective and notably to promote “green growth”. In particular, it outlines some tentative ideas for an indicator-based assessment of Member States' policies in a number of important economic dimensions of what could be their “green growth” strategies. It also explores the interactions between macroeconomic and environmental challenges at Member State level, comparing performance in various dimensions of environmental policy with relevant aspects of macroeconomic performance. Compared with existing analytical approaches within the Commission on how to spur green growth country-by-country, which tended to focus on specific instruments, targets or fields of intervention, this note aims to develop a more integrated economic analysis of measures playing a role in supporting “green growth” by combining the assessment of climate change policies, the regulatory framework governing markets for energy-related goods and services, policies greening the labour markets, economic, financial and fiscal incentives designed to internalise environmental externalities, etc. The note therefore draws heavily on analytical frameworks developed already by LIME and other analytical work of the Commission services2.
This note is motivated by two additional considerations:
− Climate change and energy policies are likely to be a very important dimension of the post-2010 Lisbon strategy, referred to as EU20203, on which a consultation exercise is
now underway. This was acknowledged in the conclusions of the ECOFIN Council of 3 December, which called for new elements to be integrated in an economically sound manner, and that new policies should be designed cost effectively and assessed according to their implications for growth and jobs;
− against the background of developing exit strategies from the crisis that return EU economies to sustainable growth and public finance trajectories, there will be a large premium in pursuing win-win reform strategies which can positively contribute to both growth/jobs and sound public finances. Policies to promote “green growth” offer such potential, and therefore could usefully be considered in debates on national exit strategies.
1 E.g. Progress towards achieving the Kyoto objectives - COM(2009)630; The renewable Energy progress report -
COM(2009) 192; 2008 Environment Policy Review - SEC(2009)842, 2009 Review of the European Union Strategy for Sustainable Development - COM(2009)400, Assessment of 27 National Energy Efficiency Action Plans SEC(2009) 889, The CO2 emissions from cars in the EU: data for the years 2005, 2006 and 2007" COM(2009) 9, etc.
2 DG ECFIN "The EU's response to support the real economy during the economic crisis: an overview of Member
States' recovery measures", DG TAXUD "Taxation trends in the European Union 2009" and DG TREN "Renewable energy progress report 2009" contain an economic analysis of national measures addressing climate and energy challenges, discussing their relative cost-effectiveness, however determining their wider macro-economic impacts is not in the scope of these reports.
3 Consultation on the future "EU 2020" Strategy, COM(2009) 647/3
The remainder of this note is organised as follows. Section 2 outlines an indicator-based assessment framework to assess s' performance in four policy dimensions relevant for national “green growth”. It also presents results from a preliminary “mechanical application” of the approach, for illustrative purposes only. The usual caveats apply to this type of indicator-based assessment, which in line with earlier LIME work, would need to be accompanied by additional qualitative and country-specific information before any policy conclusions should be drawn. Section 3 outlines an approach to compare performance in various dimensions of environmental policy with relevant aspects of macroeconomic performance. Annexes contain a detailed description of the analysis carried out to select preliminary indicators for this note; in particular, they provide more detailed explanations of the criteria/properties used to select statistical indicators as well as information on their statistical quality. A list of references is also included.
2
I
NTRODUCING GREEN GROWTH ISSUES IN AN INDICATOR-
BASED ASSESSMENTMethodology
Step 1: Determinants of “green growth”- four policy areas identified
Design and implementation of “green growth” enhancing structural reforms could be part of economic surveillance with the aim to identify sources of “green growth” and relevant policy intervention to lift barriers to “green growth”. The analysis could focus on the following four types of key links from environmental policy to growth and jobs potential:
(a) Reducing negative environmental externalities; relying on cost-efficient environmental policies to internalise environmental externalities.
(b) Ensuring environmental policy interventions contribute to sound use of public finances and to fiscal consolidation.
(c) Improving the functioning of markets to deliver sustainable consumption and production.
(d) Increasing total factor productivity from aiming for environmental improvements (capital deepening, developing knowledge assets and human capital).
A body of literature supports the choice of these areas. Ricci (2009) presents the main impacts of environmental policy on economic growth. Among others, Hope (2009) discusses the need to minimise costs of environmental policy over a long-term growth path and Baumol and Oates (1975) give fundamental justifications about the role of environmental policy instruments creating price signals. Bovenberg and Goulder (1995) discuss environmental tax reforms and EIB (2007) explains how public investment in infrastructure can be designed to maximise the overall economic benefits of such types of intervention. Numerous arguments have been provided by the literature, for example by Stavins (2003) on designing intervention on markets to yield optimal competitiveness benefits from enabling efficient use of natural resources. A DG EMPL note4
discusses how environmental challenges affect the quality and the productivity of labour.
4 INDIC/29/220909/EN Note for EMCO Indicators Group meeting on 22-23 September 2009 ‘Agenda item: Impact of
European Commission Economic paper no 401
Acemoglu et al. (2009) and Fisher (2008) describe the effects on growth of R&D and innovation dedicated to respond to environmental challenges.
As discussed in Section 3, economic policy would usefully address these four fields, as they are significantly linked to productivity gains and improvements in growth potential.
Step 2: Selecting the most relevant best-available indicators
Step 2.a: Identifying relevant best-available indicators
To evaluate performance in these four fields, this note presents below a non-exhaustive list of relevant indicators justified by the literature findings.
These indicators are presented in two lists:
− Readily available indicators (“list A”) to test the feasibility of extending the LIME assessment framework to discuss “green growth” issues.
− Indicators to consider to consolidate the extension of the LIME assessment framework (“list B”).
Table 1 below summarises the set of indicators selected; the annex presents in detail the theoretical and empirical justifications behind the choice of these indicators among a long list of available indicators describing the state of the environment and indicators capturing the economic, social and environmental effects of policies addressing environmental challenges. In particular, the annex explains the link to growth these indicators reveal and how the level of these indicators can be affected by s' policy interventions. There is a theoretical difference between performance and policy indicators, the latter being directly influenced by policy interventions. However, an eclectic approach is favoured here as a consensus would be difficult to reach on where to draw the line between the two types of indicators.
Table 1: Summary of areas, domains and relevant best-available indicators
Environmental areas Domains covered Indicators
Trend in GHG emissions Trend in primary energy consumption Minimising costs
CO2 intensity
Environmental tax revenues in % of GDP Cost-efficiency of
environmental policies
Creating price signals
Share of GHG emissions covered by ETS Minimising distortions Environmental taxes as % of total taxation
Environmental protection expenditures Share of EU structural funds to climate change
Share of EU structural funds to energy Sound use of public
finances Maximising benefits of public spending
Loans provided by the EIB to s for energy projects Electricity produced from renewable energy sources
Share of biofuels Market resilient to external
shocks
Diversification of energy source Implicit tax rates on energy, deflated Energy
markets
Transparent and open markets
Market share of largest electricity generator Energy intensity
Electricity prices: industrial users Municipal waste generated Recycling industry: turnover per capita Degree of penetration of energy-efficient boilers Market functioning
and competitiveness
Markets for products and services
Resource productivity
Population exposure to particulate matter air pollution Population exposure to air pollution by ozone Protecting health
Hazardous waste
Share of environment related employment in Member States
Green human capital
Share of RES employment in total employment Strength of innovation R&D in production, distribution and rational use of energy Direction of innovation Innovation effects on material and energy efficiency
Wind energy installed: total capacity Total Factor
Productivity
Green technological
progress
Diffusion of innovation gains
Change in CO2 emissions of new passenger cars sold
Step 2.b: Narrowing and consolidating the set of indicators
Following the methodology applied in the LIME assessment framework, a screening procedure is implemented to select a narrow list of indicators. Firstly, an evaluation of minimum statistical standards is performed. Criteria include (i) economic rationale, (ii) comparability and statistical reliability, (iii) time coverage, and (iv) geographical coverage. Secondly, a correlation analysis is used to remove the redundant indicators. Finally, some robustness checks and sensitivity analyses are performed. Table 2 below summarises the results, which are discussed in detailed in the annexes
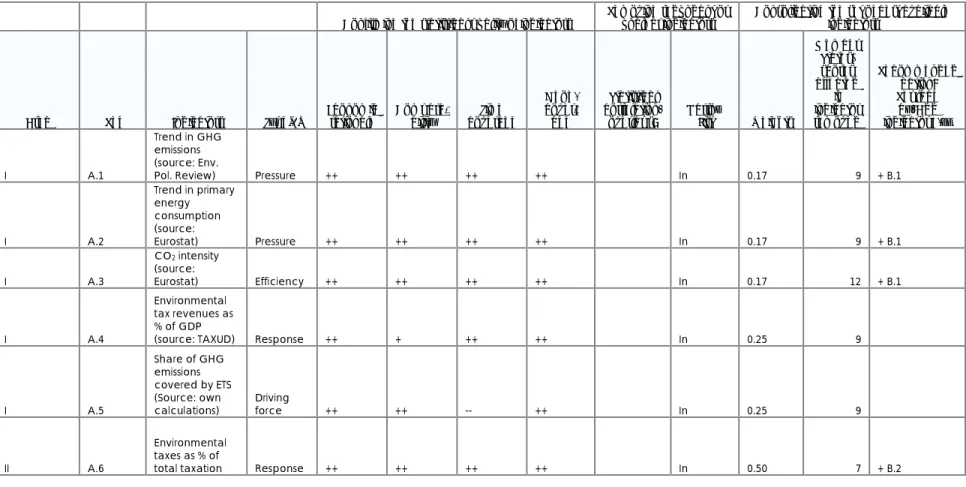
Table 2: Summary of consolidation of the set of indicators
Confirming the statistical quality of indicators Removing redundant or unclear indicators Consolidating the set of best available indicators Area Ref Indicators Type[1] Economic rationale Compara-bility coverage Time
Geog. cover-age
Statistical correlation/
overlaps? Narrow List Weights
Member States' scores affected if indicator removed Recommended action: Replace by/Add indicator B.xx I A.1 Trend in GHG emissions (source: Env.
Pol. Review) Pressure ++ ++ ++ ++ In 0.17 9 + B.1
I A.2 Trend in primary energy consumption (source: Eurostat) Pressure ++ ++ ++ ++ In 0.17 9 + B.1 I A.3 CO2 intensity (source: Eurostat) Efficiency ++ ++ ++ ++ In 0.17 12 + B.1 I A.4 Environmental tax revenues as % of GDP
(source: TAXUD) Response ++ + ++ ++ In 0.25 9
I A.5 Share of GHG emissions covered by ETS (Source: own
calculations) Driving force ++ ++ -- ++ In 0.25 9
II A.6 Environmental taxes as % of
total taxation Response ++ ++ ++ ++ In 0.50 7 + B.2
Confirming the statistical quality of indicators Removing redundant or unclear indicators Consolidating the set of best available indicators Member
States' Area Ref Indicators Type[1] Economic rationale Compara-bility coverage Time
Geog. cover-age
Statistical correlation/
overlaps? Narrow List Weights
scores Recommended affected action: if Replace indicator by/Add removed indicator B.xx II A.7 Environmental protection expenditures by public sector (source:
Eurostat) Response ++ + + -- A.7/A.9 In 0.17 8
II A.8 Share of EU structural funds to climate change (source:
DG REGIO) Response ++ + -- ++ A.8/A.9 ½ 0.08 6
II A.9 Share of EU structural funds to energy (source: DG
REGIO) Response ++ + -- ++ A.9/A.8A.9/A.7; 1-févr 0.08 6 II A.10
EIB Loans for energy projects
(source: EIB) Response + ++ -- ++ In 0.17 6
III A.11 Electricity produced from RES (source:
Eurostat) Response + ++ ++ - A.11/A.13 In 0.08 11
III A.12 Share of biofuels (source: Eurostat) Response + + ++ + In 0.08 10 III A.13 Diversification of energy sources (source: own
calculations) Driving force ++ + -- +
A.13/A.11; A.13/A.19;
A.13/A.15 In 0.08 8
III A.14
Implicit tax rates on energy, deflated
European Commission Economic paper no 401
Confirming the statistical quality of indicators Removing redundant or unclear indicators Consolidating the set of best available indicators Member
States' Area Ref Indicators Type[1] Economic rationale Compara-bility coverage Time
Geog. cover-age
Statistical correlation/
overlaps? Narrow List Weights
scores Recommended affected action: if Replace indicator by/Add removed indicator B.xx III A.15 Market share of the largest electricity generator
(source: LAF) Efficiency ++ ++ ++ -- A.15/A.13 In 0.13 10 + B.3/B.4 III A.16
Energy intensity (source: Env.
Pol. Review) Efficiency ++ ++ ++ ++ A.16/A.14A.16A.20 ; In 0.13 11 III A.17
Electricity prices: industrial users
(source: LAF) Driving force ++ - ++ ++ Out 0.00
III A.18 Degree of penetration of energy-efficient boilers (Source: Energy Star Market Penetration Report) Efficiency ++ ++ -- ++ In 0.13 6 III A.19 Municipal waste generated (source: Env.
Policy Pressure ++ + ++ ++ A.19/A.13 In 0.13 7
III A.20 Resource productivity (source:
Eurostat) Pressure ++ + + - A.20/A.14A.20/A.16 ; Out 0.00 III A.21
Recycling industry: turnover per capita (source:
Eurostat) Pressure ++ + ++ - In 0.13 9 A.21 >> B.5/B.6/B/7
Confirming the statistical quality of indicators Removing redundant or unclear indicators Consolidating the set of best available indicators Member
States' Area Ref Indicators Type[1] Economic rationale Compara-bility coverage Time
Geog. cover-age
Statistical correlation/
overlaps? Narrow List Weights
scores Recommended affected action: if Replace indicator by/Add removed indicator B.xx IV A.22 Urban population exposure to air pollution by PM (source:
Eurostat) State + ++ ++ - A.22/A.23 In 0.11 6 + B.8
IV A.23 Urban population exposure to air pollution by ozone(source:
Eurostat) State + ++ ++ - A.23/A.22 In 0.11 9 + B.8
IV A.24 Hazardous waste (source: Eurostat) State + ++ + ++ In 0.11 8 + B.8 IV A.25 Share of environmentally-related employment in Member States (source: DG
EMPL) Response ++ + -- ++ In 0.17 6 A.25 >> B.9/B.10/B.11
IV A.26 Share of RES employment in total employment (Source: DG
EMPL) Response ++ + -- ++ In 0.17 6 A.26 >> B.9/B.10/B.11
IV A.27 R&D In production, distribution, and rational use of energy (source:
European Commission Economic paper no 401
21
Confirming the statistical quality of indicators Removing redundant or unclear indicators Consolidating the set of best available indicators Area Ref Indicators Type[1] Economic rationale Compara-bility coverage Time
Geog. cover-age
Statistical correlation/
overlaps? Narrow List Weights
Member States' scores affected if indicator removed Recommended action: Replace by/Add indicator B.xx IV A.28 Innovation on material/energy efficiency (source: Eurostat) Response ++ ++ - + In 0.11 10 IV A.29 Wind energy installed: total capacity (source:
energy.eu) Driving force - ++ -- ++ In 0.06 10
IV A.30 Change in CO2 emissions for new passenger cars (source: Env. Pol.
Review) Driving force + ++ ++ - In 0.06 8
Step 3: Computing individual scores
Individual scores are determined following the LIME assessment framework methodology. To avoid giving too much weight to outliers, the score for each indicator is capped at three standard deviations. Thus scores range from +30 to -30. A score of 0 implies the indicator in question is the same as the EU27 weighted average, whereas a score of -10 implies the indicator is 1 standard deviation below the EU27 average. The EU average is weighted according to the relative share of each country in the EU's GDP.5
Step 4: Aggregating and interpreting scores
Assessment based on gaps to targets brings to the forefront topics easily measurable by quantitative targets. However, there are some issues difficult to capture by a target, for example the ability of Member States to design climate and energy policies to boost long-term productivity. This is typically the kind of information that an indicator-based assessment framework conveys, which makes it a necessary complement to traditional environmental policy assessment. Hence, we suggest concentrating on aggregate scores that reflect the economic implications of environmental policies and structural reforms.
In this paper, we analyse performance based on four scores revealing the distance to the EU-27 average. That is, for each of the four areas of relevance for “green growth” that we pre-selected for economic analysis, we consider the set of indicators and the score obtained by Member States in relation to the EU average value of this indicator.
For instance, as regards “total costs of environmental policies”, we aggregate the score obtained by each Member State for indicators A.1 to A.5, to identify which Member States are over-performing or under-over-performing as regards the cost-efficiency of environmental policies. Indicators have been calculated in levels and changes. The analysis is mainly based on the indicators in levels. However, when needed, the analysis of countries' performances can be refined by looking at the indicators in changes, for instance to detect a trend in a country's performance.
Standardised thresholds have been used to determine categories of performance. Any score below – 4 is a priori considered to represent underperformance; any score between +3 and -3 is a
priori considered to represent a neutral performance; any score above +4 is a priori
considered to represent over-performance. These thresholds have been chosen because, assuming a normal distribution of results, one third of outcomes should be found in each of the categories.
Step 5: Interpreting performance
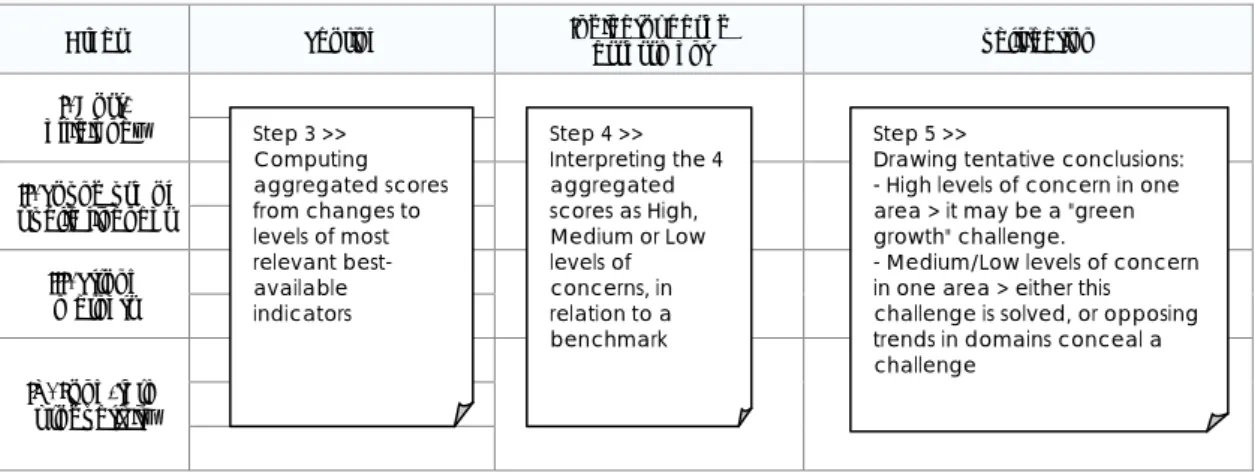
Figure 6 below summarises the approach and how qualified conclusions can be drawn based on aggregate indicator-based results.
5 Note that if so far, we have concentrated on determining scores with respect to the EU27 average, scores could also
be determined vis-à-vis other reference points, such as, for instance, the US or Japan. An effort would then have to be
European Commission Economic paper no 401
Figure 6: Summary of the approach from Step 3 to 5
Areas Scoring Indicator based assessment Qualification
I. Cost-efficiency II. Sound use of public finances III. Strong markets IV. Long-term productivity Step 3 >> Computing aggregated scores from changes to levels of most relevant best-available indicators Step 4 >> Interpreting the 4 aggregated scores as High, Medium or Low levels of concerns, in relation to a benchmark Step 5 >>
Drawing tentative conclusions: - High levels of concern in one area > it may be a "green growth" challenge.
- Medium/Low levels of concern in one area > either this challenge is solved, or opposing trends in domains conceal a challenge
When looking at the results (see Table 5 below), it can be seen that a sizeable number of Member States fall in the medium range. There are two main explanations for this phenomenon. First, if the dispersion of Member States' performance is initially large, then scores included in the medium range could still reflect significant differences between countries. Second, if Member States have contrasting performances from one indicator to another, they would balance out in the aggregate score. Both explanations tend to justify the use of disaggregated information for countries falling in the medium range in order to refine the environmental policy assessment.
In any case, policy interventions will influence performance through acting at the level of domains, for example the energy markets domain within the market functioning and competitiveness area. Therefore, we suggest qualifying any interpretation extracted from these levels of concerns according to actions taken in domains. For instance, it could be appropriate to suggest further action at national level in the area of “green” TFP if complementary analysis spots that no instrument is in place to correct inefficiencies in the “human capital” domain. The different scores also offer a direct way to approach more specific databases on Member States' policies, such as those of the OECD/EEA or DG TAXUD6.
Testing the assessment framework in an environmental
policy context
The set of best available indicators, confirmed as robust, significant and non-correlated, can be used to strengthen the economic foundations of environmental policy surveillance. Thus, we suggest using an indicator-based assessment framework to monitor environmental policy implementation, or for proposals to revise EU environmental policies. Indeed, this new tool could help to put the progress made against environmental targets in perspective with broader environmental performance influenced by economic constraints. Besides, this tool could be combined with the analysis of policy instruments influencing performance areas to help to identify “best practices”. To these ends, we build upon the outcome of methodological discussions held in LIME in the context of the construction of the LIME assessment framework (LAF). Two issues stand out, the construction of the aggregate score, and the selection of a narrow list of indicators from which aggregate scores are computed.
6 The joint database by OECD and the European Environment Agency provides information on environmentally related
taxes, fees and charges, tradable permit systems, deposit refund systems, environmentally motivated subsidies and voluntary approaches used in environmental policy in OECD Member countries, EEA member countries and countries otherwise co-operating with EEA, not being members of OECD. Similarly, the TAXUD database on environmental taxes, or some implementation reports by TREN or ENV, provide a wealth of horizontal information.
Figure 7 below presents the results of Step 4, that is countries' scores by environmental area. The distribution of levels of environmental performance is useful in the context of environmental policy surveillance: it is a way to reflect the degree of convergence in some environmental areas between Member States, as a low dispersion would be reflected by few variations around the EU average.
As proposed under Step 5, results can also be interpreted taking into account changes to the levels of performance over a period during which environmental policy instruments applied. The scores in changes determined in the assessment framework give information about trends in environmental performances by Member State. Because the scores in changes consider the average variation over the period where data are available, they can highlight otherwise hard to detect trends in environmental performance. For instance, the scores for RO in the area “green contribution to TFP” are -8.7 in level and 14.4 in changes.7 It is an example of a country showing
simultaneously low performance but also large efforts, that is over-performing on the related “change” indicators. Other examples include SE in the area “Sound use of public finances” (-5,1;7,5), EE in the area “minimising costs of environmental policies” (-6,8;8,3) and BG, EE, IE and LT in the area “market functioning”. In the future, we could see this case happen if a Member State has especially used the crisis as an opportunity, passing forceful growth-enhancing environmental measures to address its pre-crisis relative under-performance and thereby fostering new sources of growth.
Figure 7: Member States' scores per environmental area
-20 -12 -4 4 12 BE BG CZ DK DE EE IE G ES FR IT CY LV LT LU H MT NL AT PL PT R SI SK FI SE UK -12 -4 4 12 20 28 -20 -12 -4 4 12 -12 -4 4 12 20 BE BG CZ DK DE EE IE G ES FR IT CY LV LT LU H MT NL AT PL PT R SI SK FI SE UK
Area II. Sound use of
public finances Area III. Strong markets Area IV. Long-term productivity Area I. Cost-efficiency
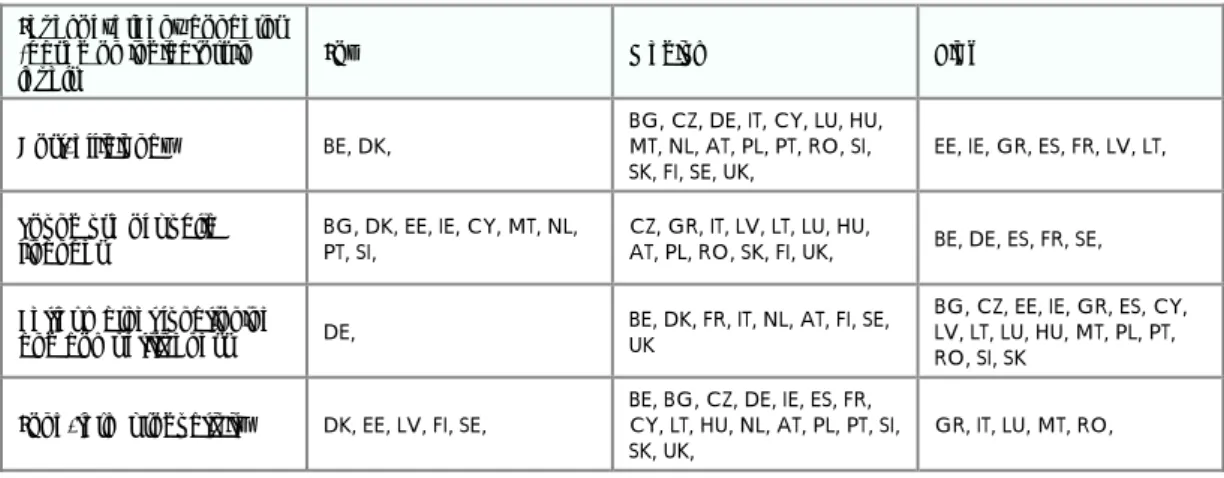
In addition, it is possible to associate a Member State's bad (respectively good) performance to high (low) concerns that environmental challenges for growth are insufficiently (sufficiently) addressed. The level of environmental risk corresponds to the country's performance as defined above. The need for structural reforms on climate and energy issues is often presented as a discussion on whether or not Member States can reach their targets. As an illustration, Table 3 below presents a preliminary summary of levels of concerns:
European Commission Economic paper no 401
Table 3: Levels of green concerns by environmental area Level of “green” concerns
(based on indicators in
levels) Low Medium High
Cost-efficiency BE, DK, BG, CZ, DE, IT, CY, LU, HU, MT, NL, AT, PL, PT, RO, SI,
SK, FI, SE, UK, EE, IE, GR, ES, FR, LV, LT, Sound use of public
finances BG, DK, EE, IE, CY, MT, NL, PT, SI, CZ, GR, IT, LV, LT, LU, HU, AT, PL, RO, SK, FI, UK, BE, DE, ES, FR, SE,
Better market functioning
and competitiveness DE, BE, DK, FR, IT, NL, AT, FI, SE, UK
BG, CZ, EE, IE, GR, ES, CY, LV, LT, LU, HU, MT, PL, PT, RO, SI, SK
Long-term productivity DK, EE, LV, FI, SE, BE, BG, CZ, DE, IE, ES, FR, CY, LT, HU, NL, AT, PL, PT, SI,
SK, UK, GR, IT, LU, MT, RO, As shown in previous sections, the method used to build the indicator-based assessment framework is robust. Hence, these levels of concerns allow a screening of Member States and could provide information on their performance, without necessarily requiring a reference to individual indicators.
A preliminary interpretation of the results in Table 3 first shows common patterns of concerns in different national situations: there is a cluster of Member States in the medium range performance for the “cost-efficiency” area. A tentative explanation could be that the internal market ensures no large discrepancy in Member States' performance. The degree of convergence between Member States in this environmental area would in this case be reflected by few countries outside the medium level of green concern. This shows how an indicator-based assessment framework gives additional evidence to identify the need for further co-ordination or better targeted policy intervention at EU level. For instance, there is also a cluster of concerns about strong market functioning or long-term productivity (especially in relation to a limited spread of good performance in the energy markets and the innovation domains), whereas there is overall a lesser level of concerns about the use of cost-efficient environmental policy instruments. It could indicate that there is a strong economic case for promoting better environmental regulation especially to develop a stronger internal market and foster long-term productivity.
On the other hand, Figure 7 draws the attention to some country-specific evidence worth further analysis. For instance, DK presents low green concerns as regards minimising climate and energy costs, the use of public finances for environmental purposes and the green contribution to long-term productivity. Results are more nuanced as regards market functioning, where DK's performance falls in the middle range. Then it may be worthwhile investigating performance within each of these areas, at the more disaggregated level of domains covered by the tool. For instance, it would be relevant to examine further the consequences for DK of experiencing a relative under-performance in the “markets for goods and services” domain, balanced by an over-performance as regards the “energy markets” domain. This example highlights the importance of the intermediate level of environmental performance and confirms that country-specific analysis must be performed at an intermediate (semi-aggregated) level. In many cases, Member States show different levels of performance depending on the environmental area considered. For instance, BE over-performs as regards minimising climate and energy costs and price risks, but under-performs as regards the use of public finances. A global indicator would conceal these differences, whereas individual indicators focusing on targets would make economic analysis and interpretation more difficult.
3
T
ENTATIVE EXPLORATION OF POSSIBLE LINKS BETWEEN ENVIRONMENTAL AND MACRO-
ECONOMIC CHALLENGESIntroduction
Identifying relevant macro-economic dimensions
Mixing the environmental and macro-economic approaches is a way to improve the quality of economic analysis by highlighting previously undetected under/over performances by Member States. The LIME indicator-based assessment framework extended to “green growth” and structural reforms issues allows discussing in combination the macro-economic and environmental performance of a Member State, and whether the same level of concerns is observed in both areas. We focus on a short-list of country-specific macro-economic challenges. We consider the growth components (as defined by the indicator-based assessment framework currently used for Lisbon strategy monitoring) that have the potential to influence and/or to be influenced by Member States' performance in the environmental areas identified above. The main advantage of using the current assessment approach is that the methodology is the same, and so results are easily comparable. The analysis proceeds by identifying in parallel what constitutes Low / Medium / High levels of concerns in terms of macro-economic performance and to address “green growth” challenges.
Findings from this trial assessment of performance remain very tentative and should be grounded further by solid macro-economic analysis.
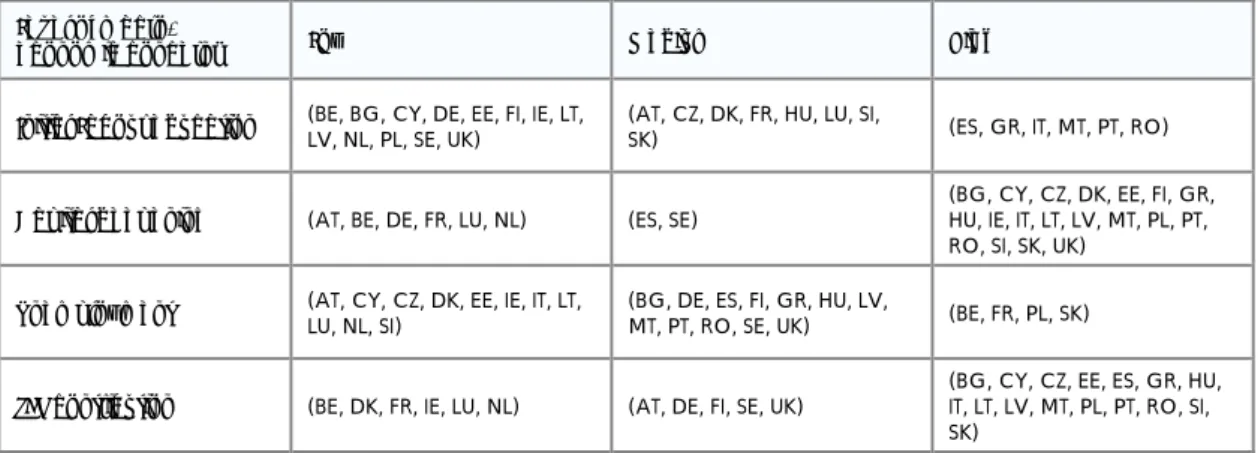
Table 4 presents the information we relied on for testing how an indicator-based assessment framework could be employed to reflect macro-economic challenges. It shows the level of concerns for four macroeconomic growth components identified in LAF.
Table 4: Level of macro-economic concern (from LAF) Level of
macro-economic concerns Low Medium High
Initial Labour education (BE, BG, CY, DE, EE, FI, IE, LT, LV, NL, PL, SE, UK) (AT, CZ, DK, FR, HU, LU, SI, SK) (ES, GR, IT, MT, PT, RO)
Capital deepening (AT, BE, DE, FR, LU, NL) (ES, SE) (BG, CY, CZ, DK, EE, FI, GR, HU, IE, IT, LT, LV, MT, PL, PT,
RO, SI, SK, UK)
Unemployment (AT, CY, CZ, DK, EE, IE, IT, LT, LU, NL, SI) (BG, DE, ES, FI, GR, HU, LV, MT, PT, RO, SE, UK) (BE, FR, PL, SK)
TFP contribution (BE, DK, FR, IE, LU, NL) (AT, DE, FI, SE, UK) (BG, CY, CZ, EE, ES, GR, HU, IT, LT, LV, MT, PL, PT, RO, SI,
SK) Confronting green and macro-economic areas
Performance according to one of the four aggregated environmental scores can then be usefully interpreted “face to face” with indicators of macro-economic performance8. The literature about
8 It would be less appropriate to analyse the correlation between individual indicators and macro-economic
European Commission Economic paper no 401
the causal relationship between environmental improvements and growth is controversial. Yet, it is not disputed that there are effects of environmental policies channelled to growth, for instance along the following links:
- Designing and applying cost-efficient environmental policies contributes to mitigating the negative impacts on growth from long-term rising real energy prices and climate change damages. The risk premium to cover volatility in energy and critical raw material prices and exposure to large-scale climate-related disruptive events is not negligible for economic agents. Climate and energy challenges enter into the composition of current and expected price levels. Opportunity costs to mitigate or adapt to climate change, expected benefits from reduced exposure to climate and energy risks intervene in decisions to allocate disposable income for equipment/construction investment and for savings9. Thereby, environmental policy has effects on long-term GDP levels, aggregate
levels of consumption, imports and savings rates.
- A sound use of public finances guarantees that budgetary resources are allocated to expenditures providing environmental public goods to the right extent compared to other needs.It also ensures that environmental taxes and charges are collected in a least distortive way, enabling an efficient allocation of production factors and of time between labour/leisure. Public support must also be targeted to maximise the leverage of public funding. Environmental policy thereby has an effect on aggregate levels of labour income, total labour costs and production costs, household and government consumption as well as capacity utilisation.
- Better functioning markets will employ energy-related, labour and capital inputs more efficiently within sectors, and will re-allocate resources more efficiently across activities, maximising total value added. Environmental regulations influence industrial production levels and employment prospects. Activity enabled or encouraged by environmental policies may contribute to the overall balance of trade, and to increasing domestic demand and investment. Better adjustment of the workforce to the demand for “green” goods and services may contribute to lowering structural unemployment.
- Public interventions to improve the human capital and knowledge stock will counteract private under-allocation of labour and capital to R&D and innovation due to market failures. Directing R&D and innovation activity towards green technologies, for example lowering barriers to the diffusion of eco-innovation, may encourage capital formation, lead to capital deepening and to higher labour productivity, while creating future export potential.
Overall, the literature has discussed constraints or opportunities for growth from improving environmental quality and these interactions are shown as shaded areas in Table 5 below. As climate and energy issues are only one aspect influencing macroeconomic variables, the link between the two aspects will sometimes be weak, which does not prevent it from being significant. We attributed a lighter shade when the literature is less consensual, if there is less strength in the interactions, and/or if the link diffuses across a subset of economic sectors instead of the whole economy.
9 Smulders (2009) explains how the optimum level of environmental protection is modified by a crisis: a
demand-induced recessionreduces the productivity of inputs, so that the opportunity cost of reducing pollution is lower, and yields a lower return to alternative investment (for example private capital and stock market), so that the net present value of future environmental benefits may appear higher.
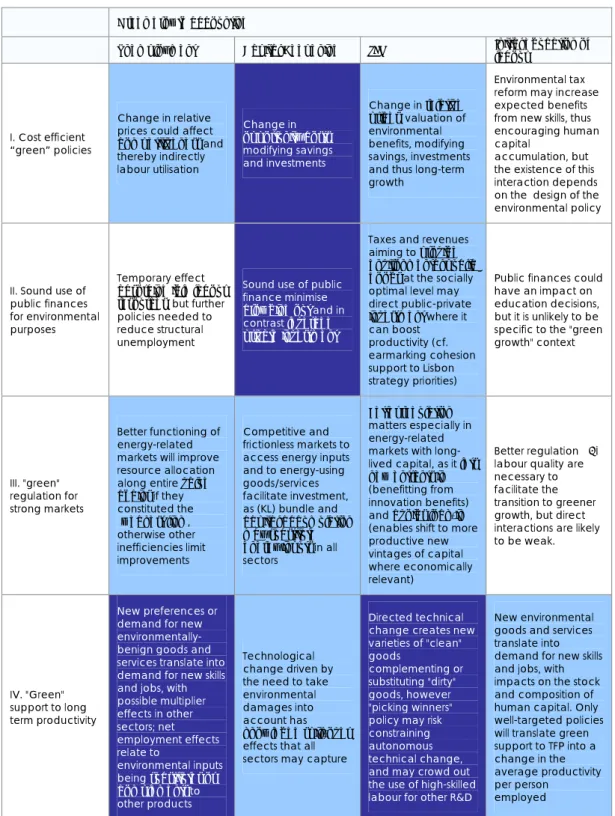
Table 5: Potential interactions between green and macro-economic performances Green growth accounting
Unemployment Capital Deepening TFP Initial education of labour
I. Cost efficient “green” policies
Change in relative prices could affect competitiveness and thereby indirectly labour utilisation Change in opportunity costs, modifying savings and investments Change in relative prices, valuation of environmental benefits, modifying savings, investments and thus long-term growth
Environmental tax reform may increase expected benefits from new skills, thus encouraging human capital
accumulation, but the existence of this interaction depends on the design of the environmental policy
II. Sound use of public finances for environmental purposes
Temporary effect absorbing idle labour resources, but further policies needed to reduce structural unemployment
Sound use of public finance minimise
crowding out and in contrast leverage private investment
Taxes and revenues aiming to provide environmental public goods at the socially optimal level may direct public-private investment where it can boost productivity (cf. earmarking cohesion support to Lisbon strategy priorities)
Public finances could have an impact on education decisions, but it is unlikely to be specific to the "green growth" context III. "green" regulation for strong markets Better functioning of energy-related markets will improve resource allocation along entire value chains if they constituted the "weakest link", otherwise other inefficiencies limit improvements Competitive and frictionless markets to access energy inputs and to energy-using goods/services facilitate investment, as (KL) bundle and capital accumulation may substitute energy inputs in all sectors
Better regulation matters especially in energy-related markets with long-lived capital, as it lets new entrants in (benefitting from innovation benefits) and avoids lock-in (enables shift to more productive new vintages of capital where economically relevant)
Better regulation and labour quality are necessary to facilitate the transition to greener growth, but direct interactions are likely to be weak.
IV. "Green" support to long term productivity
New preferences or demand for new environmentally-benign goods and services translate into demand for new skills and jobs, with possible multiplier effects in other sectors; net employment effects relate to environmental inputs being substitutes or complements to other products Technological change driven by the need to take environmental damages into account has knowledge spill-over effects that all sectors may capture
Directed technical change creates new varieties of "clean" goods complementing or substituting "dirty" goods, however "picking winners" policy may risk constraining autonomous technical change, and may crowd out the use of high-skilled labour for other R&D
New environmental goods and services translate into demand for new skills and jobs, with impacts on the stock and composition of human capital. Only well-targeted policies will translate green support to TFP into a change in the average productivity per person
employed
We suggest that the subsequent analysis of country-specific performances would proceed only where literature gives evidence of possible interactions between environmental quality and economic performance drivers. Country-specific analysis would then consist of finding out why correlations between environmental and economic concerns have occurred. Nonetheless, conversely, if the tool brings to light relationships between environmental and economic aspects for a number of Member States where a priori we noticed no strong link, it will be necessary to go
European Commission Economic paper no 401
back to the literature or to deepen the empirical analysis of inter-linkages between challenges that matter for “green growth”10.
Testing the assessment framework on structural reforms
Grouping countries by macroeconomic challenges to assess environmental policiesThe first advantage of bringing macro-economic and green growth concerns face to face is that it allows a more nuanced assessment of Member States' environmental performance. For instance, Figure 8 to Figure 10 regroup Member States' environmental performance according to the level of concerns related to the growth component “unemployment”. This helps to identify country-specific green growth challenges within a group of countries with otherwise similar macroeconomic characteristics. When interactions between green and macroeconomic performances have been identified, it makes sense to qualify the opinion on a country's performance based on the macro-economic constraints that the country is currently facing.
As an illustration, in the category “low unemployment concern” NL seems to over-perform compared with other countries in the same macro-economic situation. The latter Member States could then possibly benefit from an exchange of potential “best practices” implemented in the NL context. From another perspective, it is also relevant to refine the analysis for countries with similar environmental characteristics but different macro-economic constraints. For instance, the environmental performance of HU and CZ, relatively similar in absolute terms, may be appreciated differently when looking at the macro-economic conditions in each country and the relative more tense unemployment situation in HU.
Finding common occurrences of over/underperformance along key macro-economic dimensions and “green growth” issues
Common occurrences of over/underperformance along key macro-economic variables and along “green growth” issues help select fields where a deeper macro-economic analysis of “green growth” issues is needed and where it is necessary to find out more about macro-economic and environmental spill-over effects of policies, both in the realm of environmental policy and economic surveillance. Common occurrences are only considered in the areas where interactions between environmental and macroeconomic areas have been identified (see Table 5). The exploratory analysis encourages developing further the foundations of the approach as the test-run confirms it is worth looking further at specific combinations of concerns. Indeed, some combinations of “green growth” and macro-economic concerns appeared more telling than others, namely [Low “green”, Low “macro”], [High “green”, High “macro”], [Medium “green”, High “macro”], [High “green”, Medium “macro”] and [High “green”, Low “macro”], for the following reasons:
- The test run provides an analysis of the group of Member States where the results of the dual screening are [Low macro-economic concerns; Low “Green growth” concerns].
Indeed, this common occurrence might signal that a Member State has established a genuinely “growth enhancing” environmental policy, or has managed to address growth underperformance without losing sight of its environmental commitments. A number of these positive spill-over effects across the economic and environmental policy realms may not have been captured under the current environmental policy analysis and core macro-economic surveillance.
10 As a complement to this, future work is also needed to treat environment (natural capital and/or pollution stock) as an
input entering the production function, in order to analyse/quantify the effects of improvement of natural resource productivity and the state of the environment on growth. This would also be a way to measure the "flexibility" of the economy to make a transition to a low carbon economy, for example by looking at the elasticities of substitution across sectors. Economic modelling, such as computable general equilibrium models, could be used in this context.