University of Central Florida University of Central Florida
STARS
STARS
Electronic Theses and Dissertations, 2020-2020
Safety Evaluation of Innovative Intersection Designs: Diverging
Safety Evaluation of Innovative Intersection Designs: Diverging
Diamond Interchanges and Displaced Left-turn Intersections
Diamond Interchanges and Displaced Left-turn Intersections
Ahmed AbdelrahmanUniversity of Central Florida
Find similar works at: https://stars.library.ucf.edu/etd2020 University of Central Florida Libraries http://library.ucf.edu
This Masters Thesis (Open Access) is brought to you for free and open access by STARS. It has been accepted for inclusion in Electronic Theses and Dissertations, 2020- by an authorized administrator of STARS. For more information, please contact [email protected].
STARS Citation STARS Citation
Abdelrahman, Ahmed, "Safety Evaluation of Innovative Intersection Designs: Diverging Diamond
Interchanges and Displaced Left-turn Intersections" (2020). Electronic Theses and Dissertations, 2020-. 165.
SAFETY EVALUATION OF INNOVATIVE INTERSECTION DESIGNS: DIVERGING DIAMOND INTERCHANGES AND DISPLACED LEFT-TURN INTERSECTIONS
by
AHMED ABDELRAHMAN B.S. Cairo University, 2012
A thesis submitted in partial fulfillment of the requirements for the degree of Master of Science
in the Department of Civil, Environmental and Construction Engineering in the College of Engineering and Computer Science
at the University of Central Florida Orlando, Florida
Summer Term 2020
ii
iii
ABSTRACT
Diverging diamond interchanges (DDIs) and Displaced left-turn intersections (DLTs) are
designed to enhance the operational performance of conventional intersections that are congested
due to heavy left-turn traffic volumes. Since drivers are not familiar with these types of
intersections, there is a need to evaluate their safety performance to validate their effect, and to
estimate reliable and representative Crash Modification Factors (CMFs). The safety evaluation
was conducted based on three common safety assessment methods, which are before-and-after
study with comparison group, Empirical Bayes before-and-after method, and cross-sectional
analysis. Furthermore, since DLTs showed poor safety performance, the study also investigated
the operational performance of DLTs using a general linear model describing the relationship
between traffic delay and other operational and geometric characteristics based on high-resolution
traffic data. The DDI analysis included a sample size of 80 DDIs and 240 conventional diamond
interchanges in 24 states, while the DLT analysis included 13 DLTs and 26 conventional
intersections in 4 states. The analysis results indicated that converting conventional diamond
interchanges to diverging diamond interchanges could significantly decrease the total,
fatal-and-injury, rear-end and angle/left-turn crashes by 26%, 49%, 18%, and 68%, respectively. On the
other hand, converting conventional intersections to displaced left-turn intersections could
significantly increase the total number of crashes as well injury crashes and some other crash types
(i.e., single vehicle, angle). However, the operational analysis implied that they have the potential
to reduce the delay at intersections by 3.567 sec/veh. Consequently, the study quantified the costs
and benefits associated with implementing DLTs. The results showed that this alternative design
iv
performance could result in losses much higher than its benefits. The study concludes that DDIs
could significantly decrease crash frequency, while DLTs could not provide safety benefits.
However, DLTs might be more efficient for operational performance. It is recommended that
appropriate safety countermeasures should be developed and implemented to enhance traffic safety
v
ACKNOWLEDGMENTS
I acknowledge all the appreciation to my advisor Professor Mohamed Abdel-Aty, for his
support and advice which helped me completing my master’s degree. I would also acknowledge
Florida Department of Transportation for funding this study. I would like to acknowledge the
support of my committee members, Dr. Naveen Eluru, and Dr. Yina Wu. I would also acknowledge
vi
TABLE OF CONTENTS
LIST OF FIGURES ... viii
LIST OF TABLES ... ix
CHAPTER 1: INTRODUCTION ... 1
CHAPTER 2: LITERATURE REVIEW ... 6
Safety Performance of DDIs ... 6
Safety Performance of DLTs ... 8
Operational Performance of DLTs ... 11
CHAPTER 3: METHODOLOGY ... 14
Before-and-After with Comparison Group ... 14
Empirical Bayes Before-After Approach ... 16
Cross-Sectional Analysis ... 17
Operational Performance Analysis ... 18
CHAPTER 4: DATA PREPARATION... 19
Data Preparation for DDI Analysis ... 19
Data Preparation for DLT Analysis ... 25
CHAPTER 5: SAFETY PERFORMANCE OF DDIs ... 31
Before-After Analysis ... 31
vii
CHAPTER 6: SAFETY AND OPERATIONAL PERFORMANCE OF DLTs ... 38
Safety Analysis ... 38
Operational Analysis ... 42
CHAPTER 7: COSTS AND BENEFITS OF DLT IMPLEMENTATION ... 43
Construction and Maintenance Cost ... 43
Safety Benefits ... 44
Operational Benefits ... 45
CHAPTER 8: SUMMARY, CONCLUSIONS, AND RECOMMENDATIONS ... 49
viii
LIST OF FIGURES
Figure 1: Different traffic movements at a typical DDI design (I-77 & Catawba Ave, Cornelius,
North Carolina) ... 2
Figure 2: Left-turn crossover movement at a three-legged partial DLT in Shirley, New York ... 3
Figure 3: Left-turn crossover movement at a partial DLT in Baton Rouge, Louisiana ... 4
Figure 4: Illustration of left-turn cross movements at full DLT ... 5
Figure 5: Explanation of how a DLT works ... 5
Figure 6: Conflict points for a conventional intersection ... 9
Figure 7: Conflict points for a DLT with two displaced left-turns ... 9
Figure 8: Conflict points for a DLT with four displaced left-turns ... 10
Figure 9: Different proposed crash influence areas ... 21
ix
LIST OF TABLES
Table 1: Comparison of conflict points: DLT vs. conventional intersections ... 10
Table 2: Comparison between the different scenarios of crash influence area ... 22
Table 3: Crash data descriptive statistics ... 23
Table 4: Explanatory variables descriptive statistics ... 24
Table 5: Descriptive Statistics of DLTs ... 27
Table 6: Descriptive Statistics for the Conventional Intersections ... 28
Table 7: Operational Measures Descriptive Statistics ... 30
Table 8: SPFs for Empirical Bayes’ expected crash frequency calculation (full sample size) ... 32
Table 9: CMFs for DDIs resulting from the before-after methods ... 33
Table 10: Safety Performance Functions from the cross-sectional analysis (full sample size) .... 35
Table 11: CMFs for the Implementation of DLTs by Crash Type (B-A study with CG) ... 38
Table 12: SPFs of DLTs Implementation (Cross-Sectional Analysis) ... 40
Table 13: CMFs of DLTs Implementation (Cross-Sectional Analysis) ... 41
Table 14: Operational Performance General Linear Model ... 42
Table 15: Construction Costs of Existing DLT Intersections ... 44
Table 16: The Monetary Value of Safety Effect ... 44
1
CHAPTER 1: INTRODUCTION
Transportation professionals are challenged to achieve the mobility needs of high traffic
demand with limited available resources. Drivers, pedestrians, and bicyclists have a bad experience
at roadway at-grade intersections due to the increasing delay time and the exposure to safety risks.
However, conventional intersections sometimes cannot mitigate these transportation problems.
Consequently, many transportation engineers are investigating innovative intersection designs to
enhance mobility and safety at intersections (Autey et al., 2013). These alternative intersections
have different types and configurations (i.e., Continous Greens intersections, Median U-Turn
intersections, etc.). However, all these configurations have a common important feature which is
the elimination of left-turn movements at the main intersection. This results in reducing the number
of potential conflict points and possible mobility and safety improvement. Two common
alternative intersection designs are the diverging diamond interchange (DDI) and the displaced
left-turn intersection (DLT) which is also known as continuous flow intersection (CFI).
The diverging diamond interchange is a popular alternative interchange design for
improving traffic flow and reducing congestion. It is similar to the conventional diamond
interchange except for how the left and through movements navigate between the ramp terminals.
The purpose of this interchange design is to accommodate left-turning movements onto arterials
and limited-access freeways while eliminating the need for a left-turn bay and a signal phase at the
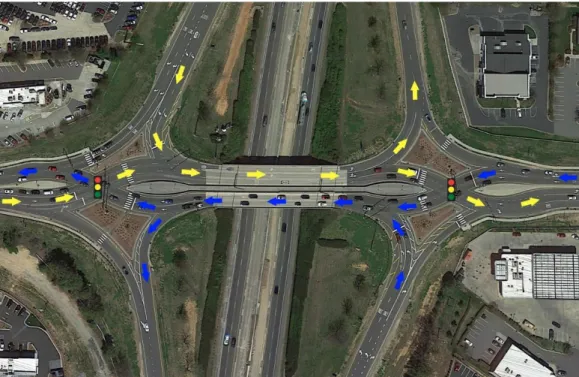
signalized ramp terminals. Figure 1 shows the typical movements that are accommodated in a DDI.
The freeway is connected to the arterial by two on-ramps and two off-ramps in a manner similar
to that of a conventional diamond interchange.
However, the main difference between a DDI and a conventional diamond interchange is
left-2
turning vehicles to cross the approaching through vehicles. This is achieved by shifting cross street
traffic to the left side of the street between the signalized crossover intersections.
Figure 1: Different traffic movements at a typical DDI design (I-77 & Catawba Ave, Cornelius, North Carolina)
On the other hand, at displaced left-turn intersections, left-turn traffic is laterally displaced.
In other words, left-turning traffic crosses over the opposing through movement at a location that
is several hundred feet upstream of the major intersection. This upstream crossover location is
typically controlled by a signal. The left-turning traffic then travels on a separated roadbed, which
is on the outside of the opposing through lanes, as those vehicles proceed toward the major
intersection. When these left-turning motorists reach the major intersection, they can proceed
without conflict concurrently with the opposing through traffic.
The main feature of the DLTs is the relocation of the left-turn movement on an approach
to the other side of the opposing roadway, which consequently eliminates the left-turn phase for
3
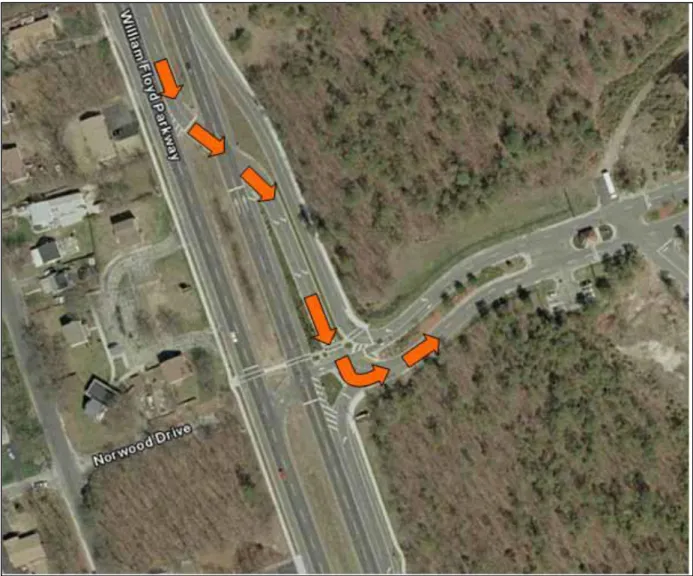
would normally turn left at the main intersection first crosses the opposing through lanes at a
signalized intersection, several hundred feet upstream of the main intersection.
Figure 2: Left-turn crossover movement at a three-legged partial DLT in Shirley, New York
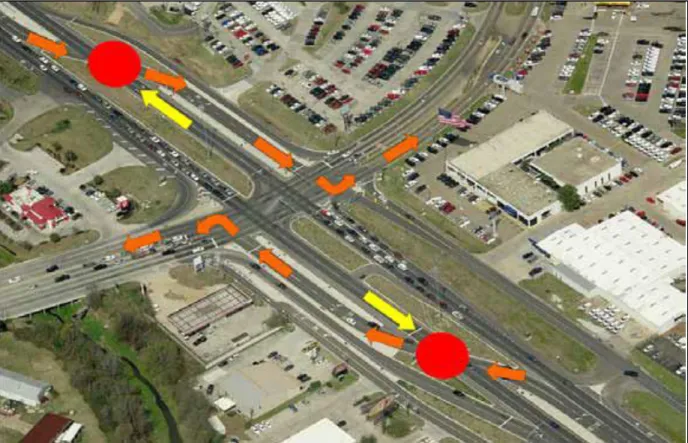
Figure 3 (Hughes et al., 2010) shows a partial DLT where the DLT movement provisions
have been implemented on two opposing approaches on the major road in this case. In most cases,
the DLTs are on the major roadway. The left-turn movements of the minor road continue to take
4
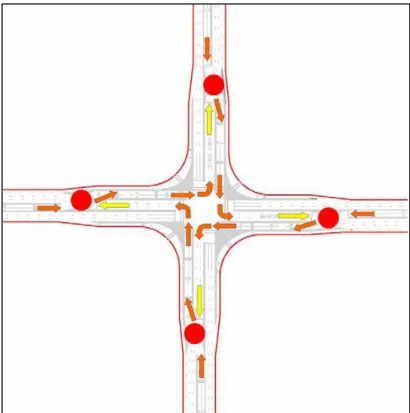
Figure 3: Left-turn crossover movement at a partial DLT in Baton Rouge, Louisiana For the full DLT intersection, the left-turn movements are relocated to crossovers on all
four approaches, as shown in Figure 4 (Hughes et al., 2010). In the figure, the red circle indicates
a signal-controlled crossover, the orange arrows indicate left-turn crossover movements, and the
yellow arrows indicate opposing through movements at a crossover controlled by a signal. There
are five junctions with traffic signal control at a full CFI- the main intersection and the four
left-turn crossovers. Furthermore, Figure 5 (Hughes et al., 2010) shows how the DLT intersection is
5
Figure 4: Illustration of left-turn cross movements at full DLT
6
CHAPTER 2: LITERATURE REVIEW
Safety Performance of DDIs
One of the common concerns related to DDI is wrong-way driving. Vaughan et al. (2015)
monitored five DDIs for 6 months using video camera footage data. The analysis showed that
wrong-way maneuvers tended to occur more often when vehicles were first entering the DDI. Also,
wrong-way maneuvers were found to occur more frequently at night than during the day. However,
no crashes were identified to be associated with these wrong-way driving events.
The FHWA diverging diamond interchange informational guide (Schroeder et al., 2014)
compared the number of conflict points of the DDI with the conventional diamond interchange. It
was shown that the conventional diamond interchange has 26 conflict points, while the DDI has
only 14. The DDI design is assumed to have safety benefits due to the reduced conflict points,
especially crossing conflicts.
Many previous studies have discussed the safety performance of DDIs. Chilukuri et al.
(2011) estimated CMFs for one DDI in Missouri using the before-after with comparison group
method. They showed that the total and left-turn crashes were reduced by 46% and 72%,
respectively. They claimed that the reduction in left-turn crashes is due to how left-turn movements
are handled within the DDI.
B. R. Claros et al. (2015) estimated CMFs for 6 operational DDIs in Missouri using naïve,
Empirical Bayes (EB), and comparison group (CG) methods. For the EB method, they used the
calibrated safety performance functions which are provided by the Highway Safety Manual (not
specific calibrated SPFs for Missouri). They found that converting conventional diamond
interchanges to DDIs reduced total, fatal-and-injury, and PDO crashes by 45%, 61%, and 39%,
7
Hummer et al. (2016) evaluated the safety effectiveness of 6 DDIs in Missouri, Kentucky,
New York, and Tennessee using the before-after with comparison group method. The results
showed that the total crashes were reduced by 33%. The injury crashes were reduced by 41%.
B. Claros et al. (2017a) used the EB method to estimate the safety effect of the DDI on
adjacent facilities. They showed that the DDI design has no effect on the crashes that occurred on
the exit and entrance speed-change lanes. For signalized intersections near DDI ramp terminals,
the EB analysis showed a 6.5% decrease in fatal-and-injury crashes, which was not statistically
significant. The analysis also showed that total and PDO crashes increased by 12% and 19.5%,
respectively. However, they concluded that there is no strong evidence that DDIs have positive or
negative safety impact on the adjacent facilities.
B. Claros et al. (2017b) studied the safety performance of 9 DDIs in Missouri using the EB
method. This study outperformed Claros et al. (4) by using location-specific safety performance
functions not the HSM calibrated SPFs. They showed that the implementation of DDI reduced the
total, fatal-and-injury, and PDO crashes by 37.5%, 55%, 31.4%, respectively.
More recently, Nye et al. (2019) evaluated the safety performance of DDIs based on 26
DDIs in 11 states by using the observational before-after with comparison group method. They
recommended CMF values for the total, angle, and rear-end crashes of 0.633, 0.441, 0.549,
respectively. They also found that fatal-and-injury crashes were reduced by 54%. However, they
provided statistical significance measures for the total crashes only and did not prove the statistical
significance of other crash types, which is one of the drawbacks of this study.
In summary, many previous studies have analyzed the safety performance of DDIs using
different approaches. However, none of these studies considered a significant sample size
8
was conducted based on 26 DDIs, the sample size is still relatively small given that there are 99
DDIs that are operational in the U.S. Moreover, no research has been conducted on the safety
performance functions (SPFs), as well as the contributing factors of crash occurrence at DDIs. In
this study, the author aims to evaluate the safety performance of DDI based on nationwide
implementation data across 24 states. Multiple CMFs for different crash types are developed by
using different approaches. Also, SPFs are developed for every crash type to investigate the safety
impact of various geometric design attributes.
Safety Performance of DLTs
Hughes et al. (2010) explored the number of conflict points at DLTs. They found that the
total number of conflict points at a DLT is 30 compared to the 32 conflict points at a conventional
intersection. Inman (2009) analyzed the conflict points’ diagram of a conventional four-leg
at-grade intersection and a DLT. The results showed that a DLT has two fewer crossing points than
the conventional four-leg at-grade intersection.
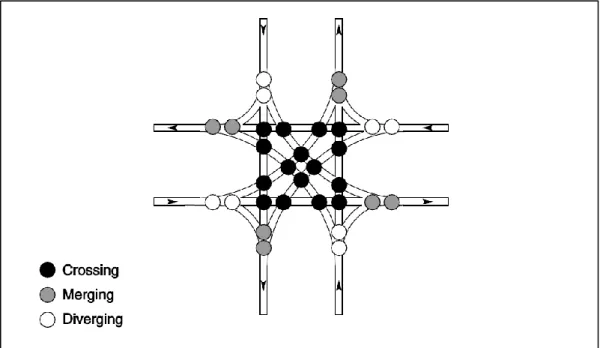
Steyn et al. (2014) compared the conflict points of a DLT (on major roads) to those of a
typical four-leg intersection (Figure 6, Figure 7 and Figure 8) (Steyn et al., 2014). The results
showed that there was a 6% to 12% decrease in conflict points for a four-leg signalized
9
Figure 6: Conflict points for a conventional intersection
10
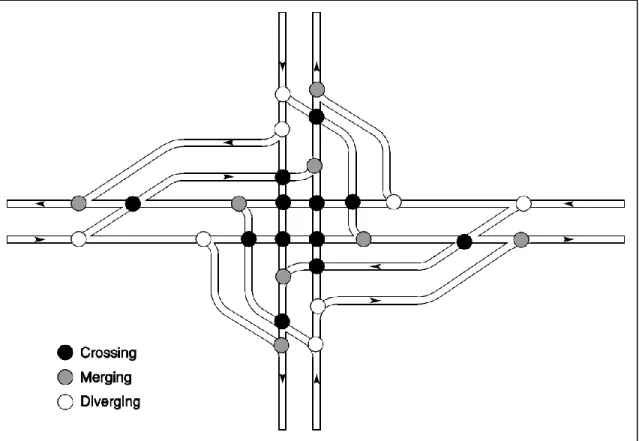
Figure 8: Conflict points for a DLT with four displaced left-turns
Table 1 (Steyn et al., 2014) compares the number of conflict points of DLT and
conventional intersections. In case of three-legged intersections, the number of conflict points are
nine in both types. On the other hand, CFIs have less conflict points compared with conventional
intersections at four-legged intersections.
Table 1: Comparison of conflict points: DLT vs. conventional intersections
Number of Intersection Legs Number of Crossovers on a DLT Conflict Points Conventional DLT
3 1 9 9
4 2 32 30
11
Previous safety studies have analyzed a limited number of DLT intersections to determine
if there is significant safety benefits from them. However, more research is needed to consider an
additional number of intersections with more years of available crash data.
Park and Rakha (2010) analyzed the safety impacts of this design based on video analysis
for two DLT intersections in Utah and Louisiana. They found that the installation of this design
resulted in a large number of hazardous maneuvers although the number of conflict events
decreased by 50%. They claimed that these hazardous maneuvers are due to driver unfamiliarity
with this type of intersections.
Another study (Louisiana Department of Transportation, 2007) explored the impact of the
implementation of a DLT intersection at US-61 and LA-3246, Baton Rouge. They used a simple
before-after study and concluded that the number of crashes decreased by around 25%. However,
they considered a small crash interval (only 18 months) and a limited sample size (only one
intersection).
The Federal Highway Administration report (Steyn et al., 2014) stated that DLT
intersections resulted in 6% to 12% reduction in conflict points compared to a conventional
four-leg intersection. Tarko et al. (2008) evaluated the safety impacts of this design on the basis of
conflict points analysis. It stated that this design may result in some safety benefits as it reduces
the potential conflict points.
Zlatkovic (2015) used the Empirical Bayes before-and-after method to evaluate the safety
performance of 8 DLTs in Utah. He concluded that the conversion of conventional intersections
to DLTs reduced the total crashes by 12%. However, the analyzed crash data was not sufficient
enough to provide representative safety measures. The reason is that the crash database included
12
which means that there is less than one year of crash data after their implementation.Operational
Performance of DLTs
Many studies have analyzed the operational performance of DLT intersections in
comparison to conventional intersections for different traffic volumes. In most cases, the
alternative design has shown better performance in terms of the operational measures of
effectiveness (i.e., delay, throughput, etc.).
Esawey and Sayed (2007) compared both the DLT and the upstream signal crossover
design to a conventional intersection using VISSIM. The authors stated that the alternative design
showed a reduction in delay time in comparison to conventional intersections. They attributed this
reduction to the greater left-turn storage space available in the DLT design.
Dhatrak et al. (2010) compared the operational performance of a DLT intersection to a
similar alternative design called the parallel flow intersection (PFI) using VISSIM. This study
analyzed the maximum throughput for both left-turn and through movements. The results showed
that DLT can serve more left-turn movements of up to 177 vehicles per hour. The authors attributed
this to the fact that DLT has fewer stops for both left-turn and through movements.
Another study Olarte and Kaisar (2011) compared the operational performance of three
alternative designs, the DLT, the diverging flow design, and the left-turn bypass intersection. It
stated that the DLT showed an average delay less than 20 seconds per vehicle while the other
alternatives did not operate well.
In addition, a study (Jagannathan & Bared, 2004) evaluated the operational performance
of the DLT in comparison to conventional intersections using VISSIM. It concluded that the
reduced number of phases on approaches with DLT crossovers resulted in delay savings up to
13
Another study (Yang et al., 2013) claimed that DLT can decrease the average delay per
vehicle, total travel time and the average number of stops per vehicle by 35%, 15%, and 7%,
respectively. Zhao et al. (2015) stated that the DLT outperforms the conventional intersection in
terms of increasing the intersection capacity up to 75%.
In summary, many studies have been conducted to address the operational performance of
DLT intersections. However, the safety performance of this alternative design has not been
analyzed sufficiently due to the limited number of sites and available crash data years after
implementation. Consequently, this study aims to investigate the safety effects of converting
conventional four-leg signalized intersections to DLTs. In addition, it aims at providing reliable
crash modification factors to be included in the database of CMF Clearinghouse and used as a
reference for transportation authorities that are interested in implementing this type of alternative
intersection design. Moreover, the operational performance of DLTs is investigated based on
high-resolution traffic data. Furthermore, evaluation of the different aspects of costs and benefits are
14
CHAPTER 3: METHODOLOGY
To investigate the safety effects of converting conventional intersections to treated ones
(i.e., DLT and DDI), crash modification factors (CMFs) were estimated. According to the
Highway Safety Manual (2010), a CMF is defined as the change in the number of crashes at any
location due to a change in one condition in case of all other characteristics are the same. If the
calculated CMF is significantly greater that one, this means that the proposed solution caused an
increase in the number of crashes. On the other hand, if it is lower than one, this indicates the
number of crashes decreased due to the proposed change. However, the CMF value may be
approximately one which means that the change has no significant effect on the number of crashes.
Before-and-After with Comparison Group
Two approaches were employed to evaluate the safety effectiveness of DDIs and DLTs.
The first method is a before-and-after study with the comparison group. This method evaluates the
safety performance of the alternative design not only based on the treatment sites’ number of
crashes but also use the crash data of the comparison sites (conventional intersections) which did
not experience any change. This approach accounts for other factors (i.e., traffic volume trends,
time) that could affect crash reduction or increase rather than the proposed treatment (Hauer,
1997). However, the comparison group should be similar to the treatment group in terms of
operational and geometric characteristics. A suitable comparison group should have a ratio of crash
counts in the after period to those in the before period similar to it in the treatment group (Gross
et al., 2010). Hauer (1997) suggested using a series of sample odds ratios to evaluate the suitability
of the comparison group using Equation (1). Based on these sample odds ratios, the sample mean
15
significantly close to one. After selecting the appropriate comparison group, the CMF could be
calculated using Equations 2-4. Significance measures (i.e., confidence interval) can be calculated
to assess the reliability of the calculated CMF (Gross et al., 2010).
𝑠𝑎𝑚𝑝𝑙𝑒 𝑜𝑑𝑑𝑠 𝑟𝑎𝑡𝑖𝑜 = (𝑇𝑟𝑒𝑎𝑡.𝑏𝑒𝑓𝑜𝑟𝑒∗ 𝐶𝑜𝑚𝑝.𝑎𝑓𝑡𝑒𝑟)/(𝑇𝑟𝑒𝑎𝑡.𝑎𝑓𝑡𝑒𝑟∗ 𝐶𝑜𝑚𝑝.𝑎𝑓𝑡𝑒𝑟) 1 +𝑇𝑟𝑒𝑎𝑡.1 𝑎𝑓𝑡𝑒𝑟+ 1 𝐶𝑜𝑚𝑝.𝑏𝑒𝑓𝑜𝑟𝑒 (1) Where,
Treat.before = the number of crashes at the treatment group in year i
Comp.before = the number of crashes at the comparison group in year i
Treat.after = the number of crashes at the treatment group in year j
Comp.after = the number of crashes at the comparison group in year j
𝐶𝑀𝐹 = (𝑁𝑜𝑏𝑠𝑒𝑟𝑣𝑒𝑑,𝑇,𝐴/𝑁𝑒𝑥𝑝𝑒𝑐𝑡𝑒𝑑,𝑇,𝐴) 1 + (𝑉𝑎𝑟(𝑁𝑒𝑥𝑝𝑒𝑐𝑡𝑒𝑑,𝑇,𝐴)/(𝑁𝑒𝑥𝑝𝑒𝑐𝑡𝑒𝑑,𝑇,𝐴)2) (2) 𝑁𝑒𝑥𝑝𝑒𝑐𝑡𝑒𝑑,𝑇,𝐴 = 𝑁𝑜𝑏𝑠𝑒𝑟𝑣𝑒𝑑,𝑇,𝐵∗ 𝑁𝑜𝑏𝑠𝑒𝑟𝑣𝑒𝑑,𝐶,𝐴 𝑁𝑜𝑏𝑠𝑒𝑟𝑣𝑒𝑑,𝐶,𝐵 (3) 𝑉𝑎𝑟(𝑁𝑒𝑥𝑝𝑒𝑐𝑡𝑒𝑑,𝑇,𝐴) = (𝑁𝑒𝑥𝑝𝑒𝑐𝑡𝑒𝑑,𝑇,𝐴)2( 1 𝑁𝑜𝑏𝑠𝑒𝑟𝑣𝑒𝑑,𝑇,𝐵+ 1 𝑁𝑜𝑏𝑠𝑒𝑟𝑣𝑒𝑑,𝐶,𝐵+ 1 𝑁𝑜𝑏𝑠𝑒𝑟𝑣𝑒𝑑,𝐶,𝐴) (4)
Where Nobserved,T,B, Nobserved,T,A, Nobserved,C,B and Nobserved,C,A are the observed number of crashes in
16 Empirical Bayes Before-After Approach
For the Empirical Bayes before-after method, henceforth referred to as EB method, the
expected number of crashes for a treated site in the ‘after’ period is estimated based on the crash
history of the treated site and the crash history of a group of reference sites with similar yearly
traffic trend, physical characteristics, and land use. One of the main advantages of the EB method
is that it accurately accounts for the changes in crash frequencies in the ‘before’ and ‘after’ periods
at the treatment sites that may be due to regression-to-the-mean bias. The EB method introduces
an estimate for the expected crash frequency of similar untreated sites using safety performance
functions, which relates the crash frequency of the sites to their traffic and geometric
characteristics.
The estimation of the expected crashes at treatment sites is based on a weighted average of
information from treatment and reference sites, as shown in Equation (5) (Hauer, 1997):
𝑁𝑒𝑥𝑝𝑒𝑐𝑡𝑒𝑑,𝑇,𝐵 = 𝑆𝑃𝐹𝑤𝑒𝑖𝑔ℎ𝑡 ∗ 𝑁𝑝𝑟𝑒𝑑𝑖𝑐𝑡𝑒𝑑,𝑇,𝐵 + (1 − 𝑆𝑃𝐹𝑤𝑒𝑖𝑔ℎ𝑡) ∗ 𝑁𝑜𝑏𝑠𝑒𝑟𝑣𝑒𝑑,𝑇,𝐵 (5)
Where SPF weight is a weight factor estimated from the over-dispersion parameter of the
SPF. The evidence from the reference sites is the output from the SPF, which is a regression model
that provides an estimated crash frequency of a given roadway facility. In this study, the negative
binomial model was used to develop SPFs, which fit the crash data of the reference sites with their
geometric and traffic parameters. A typical SPF will be in the following form:
𝑁𝑝𝑟𝑒𝑑𝑖𝑐𝑡𝑒𝑑 = 𝑒(𝛽0+𝛽1𝑥1+𝛽2𝑥2+⋯+𝛽𝑛𝑥𝑛) (6)
Where,
𝛽𝑖: Regression parameters,
𝑥1: The logarithmic value of AADT, and 𝑥𝑖 (i > 1) represent other traffic and geometric parameters
17
It should be noted that the estimates from Equation (5) are the number of crashes in the ‘before’ period. Since it is required to get the estimated number of crashes at the treatment site in the ‘after’ period; the estimates obtained from Equation (5) are adjusted by multiplying the ratio of the predicted number of crashes in the ‘after’ period to that in the ‘before’ period, as shown in Equation 7 (Hauer, 1997).
𝑁𝑒𝑥𝑝𝑒𝑐𝑡𝑒𝑑,𝑇,𝐴 = 𝑁𝑒𝑥𝑝𝑒𝑐𝑡𝑒𝑑,𝑇,𝐵∗ (
𝑁𝑝𝑟𝑒𝑑𝑖𝑐𝑡𝑒𝑑, 𝑇,𝐴
𝑁𝑝𝑟𝑒𝑑𝑖𝑐𝑡𝑒𝑑, 𝑇,𝐵) (7)
Then the variance of Nexpected, T,A and the CMF can be calculated similarly to the
before-after with CG method using Equations (8), (9):
𝑉𝑎𝑟(𝑁𝑒𝑥𝑝𝑒𝑐𝑡𝑒𝑑,𝑇,𝐴) = 𝑁𝑒𝑥𝑝𝑒𝑐𝑡𝑒𝑑,𝑇,𝐴∗ (𝑁𝑝𝑟𝑒𝑑𝑖𝑐𝑡𝑒𝑑, 𝑇,𝐴 𝑁𝑝𝑟𝑒𝑑𝑖𝑐𝑡𝑒𝑑, 𝑇,𝐵) ∗ (1 − 𝑆𝑃𝐹𝑤𝑒𝑖𝑔ℎ𝑡) (8) 𝐶𝑀𝐹 = (𝑁𝑜𝑏𝑠𝑒𝑟𝑣𝑒𝑑,𝑇,𝐴 𝑁𝑒𝑥𝑝𝑒𝑐𝑡𝑒𝑑, 𝑇, 𝐴)/(1 + ( 𝑉𝑎𝑟(𝑁𝑒𝑥𝑝𝑒𝑐𝑡𝑒𝑑, 𝑇, 𝐴) 𝑁𝑒𝑥𝑝𝑒𝑐𝑡𝑒𝑑, 𝑇, 𝐴2 ) (9) Cross-Sectional Analysis
The second method is a cross-sectional analysis which was conducted for two reasons.
First, to compare the safety performance between DLTs and conventional intersections. Second,
to determine factors that affect the safety performance of DDIs and DLTs (i.e., operational and
geometric characteristics). This method is based on developing a safety performance function
which represents the relation between the response variable (crash frequency) and predictors (i.e.,
intersection type, traffic volume, etc.). Since the response variable is considered as count data,
Poisson and negative binomial distributions are the most common distributions that can model this
18
for overdispersion. The proposed model and its parameters are shown in Equation (10). A CMF could be calculated by exponentiating the parameter of the variable related to the proposed change
(e.g., 1 if DLT and 0 if conventional). Furthermore, the significance level of the CMF could be
inferred based on the significance of the associated parameter.
𝑌𝑖 = 𝑒𝑥𝑝[𝛽0+ 𝛽𝑋𝑖 + 𝑙𝑜𝑔𝑒(𝑦𝑒𝑎𝑟) + 𝜀𝑖] (10)
Where,
Yi = predicted number of crashes at intersection i βo = model intercept
β = set of parameters associated with the independent variables Xi = set of independent variables
year = the number of crash-years
εi = a gamma-distributed error with mean 1 and variance α which allows for overdispersion
Operational Performance Analysis
To evaluate the operational performance of DLTs, a statistical model was developed using
high-resolution traffic data to describe the factors affecting congestion at this type of intersection.
There are several measures of effectiveness that are used to assess the operational performance of
intersections (i.e., throughput, queue length, delay, etc.). In this study, the average delay per
vehicle was selected as a response variable and other geometric and operational variables were
19
CHAPTER 4: DATA PREPARATION
Data Preparation for DDI Analysis
As of August 2019, there are 99 DDIs across the U.S. with different years of
implementation. However, not all of these DDIs are valid for the analysis because 10 DDIs were
recently implemented in 2019 or 2018 with not enough crash data after their implementation.
Moreover, 4 DDIs were designed to be different from the regular DDI (e.g., partial or 3-leg DDIs).
As a result, the remaining number of DDIs is 85, which are located in 27 states. Consequently, we
contacted the DOTs of the 27 states asking for multi-year crash and traffic data. Since not all of
the DOTs were able to provide access for the requested crash data, we ended up with considering
80 DDIs in 24 states including Missouri (18), North Carolina (11), Utah (8), Minnesota (6),
Georgia (5), Kansas (4), Indiana (3), Colorado (3), Texas (3), Virginia (2), Nevada (2), Michigan
(2), Tennessee (2), Florida (1), Idaho (1), Iowa (1), Kentucky (1), New Mexico (1), New York (1),
Ohio (1), Oregon (1), Pennsylvania (1), Wisconsin (1), and Wyoming (1).
For every treatment site, several comparison sites were selected. Since most of the DDIs
were conventional diamond interchange before being converted, the comparison sites were also
selected from the conventional diamond interchanges. For each DDI, three comparison sites that
have similar AADT values were selected from the same state where the DDI is located to ensure
that the treatment site (DDI) and its comparison sites have similar driver behavior patterns. In total,
240 comparison diamond interchanges were selected for the 80 DDIs.
It should be noted that this sample is not valid for all types of analysis methods that are
proposed in this study. The full sample is valid only for the cross-sectional analysis, which only
focuses on the treatment sites after their implementation, regardless of what they were before that.
20
the treatment implementation. In our case, not all the DDIs were diamond Interchanges before
converting them to DDIs. The majority (65 out of 80) were diamond interchanges, while some of
them were other types (i.e., cloverleaf interchange, intersection) or not even a junction. As a result,
different numbers of DDIs were utilized for different analyses. Specifically, 80 DDIs were used
for the cross-sectional analysis, while 65 DDIs were used for the before-after analysis.
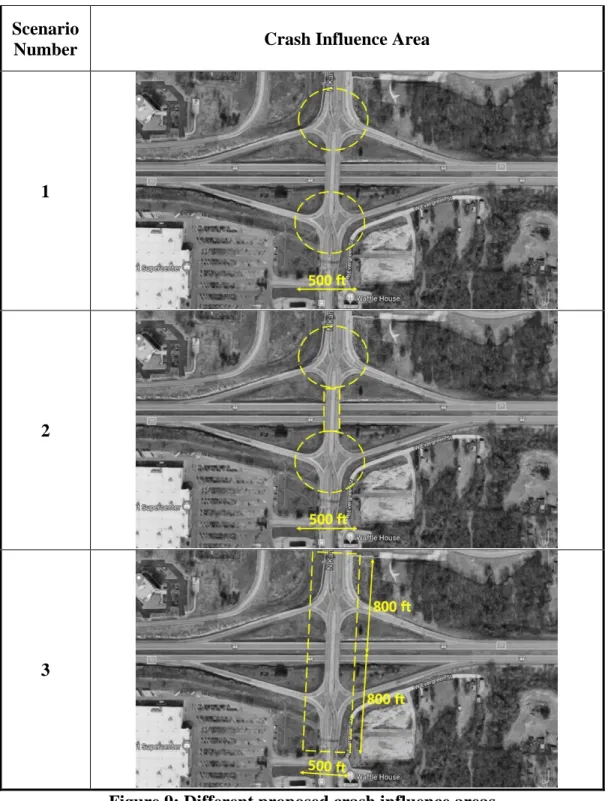
In order to calculate the crash frequency at the designated interchanges, a crash influence
area should be determined. Since the purpose of this study is to address the safety effects of
converting the diamond interchange to DDI, the research team only focused on the crash
frequencies at the crossovers/ramp terminals, which are the main differences between DI and DDI.
Three different scenarios were proposed for the crash influence area based on the literature review,
as shown in Figure 9:
1) 250 feet buffer from the center of each crossover/ramp terminal (Bonneson et al., 2012);
2) 250 feet buffer from the center of each crossover/ramp terminal in addition to the
segment between the crossovers;
3) A large buffer covering 800 feet along the arterial from the freeway centerline in both
21 Scenario
Number Crash Influence Area
1
2
3
Figure 9: Different proposed crash influence areas
The first scenario is based on the NCHRP project No. 17-45 (Bonneson et al., 2012), while
the third scenario is based on Nye et al. (2019). It should be noted that the second scenario is the
22
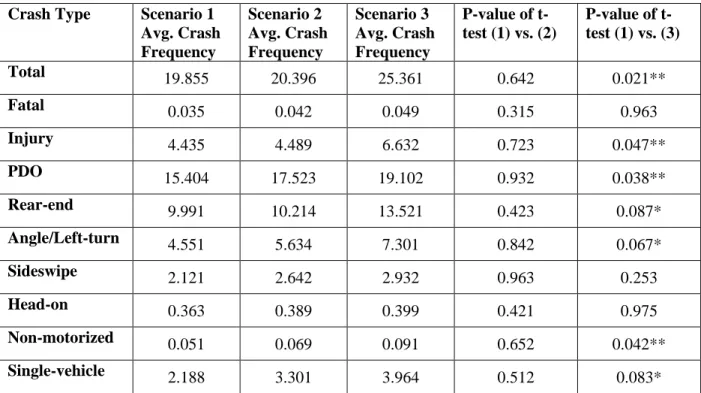
which may have a significant effect on crash frequency. To select the most appropriate scenario,
statistical significance tests were conducted to compare the average crash frequencies of each
scenario by crash type, as shown in Table 2: Comparison between the different scenarios of crash
influence area. The null hypothesis of the t-test assumes that there is no difference between the
two scenarios. The table shows that there is no strong evidence to reject the null hypothesis when
comparing the 1st and 2nd scenarios. On the other hand, there is a significant difference between
the crash frequencies of the 1st and the 3rd scenarios for most crash types and severities.
Table 2: Comparison between the different scenarios of crash influence area
Crash Type Scenario 1
Avg. Crash Frequency Scenario 2 Avg. Crash Frequency Scenario 3 Avg. Crash Frequency P-value of t-test (1) vs. (2) P-value of t-test (1) vs. (3) Total 19.855 20.396 25.361 0.642 0.021** Fatal 0.035 0.042 0.049 0.315 0.963 Injury 4.435 4.489 6.632 0.723 0.047** PDO 15.404 17.523 19.102 0.932 0.038** Rear-end 9.991 10.214 13.521 0.423 0.087* Angle/Left-turn 4.551 5.634 7.301 0.842 0.067* Sideswipe 2.121 2.642 2.932 0.963 0.253 Head-on 0.363 0.389 0.399 0.421 0.975 Non-motorized 0.051 0.069 0.091 0.652 0.042** Single-vehicle 2.188 3.301 3.964 0.512 0.083*
*** significant at 99%, ** significant at 95%, and * significant at 90%.
Based on the statistical significance tests, the 1st scenario was selected for calculating the
crash frequencies. Although the 3rd scenario has a significant difference from the 1st scenario, the
authors believe that it may be not appropriate in this study because the distance 1600 feet could
23
Based on the selected crash influence area, the yearly number of crashes was calculated at
the DDIs and the comparison diamond interchanges by crash type. The descriptive statistics of the
crash data are shown in Table 3. It should be noted that the average crash frequency was calculated
by averaging over the years and the locations. For most of DDIs, the crash data was available for
at least 5 years, however, for a few recently implemented DDIs, the crash data was available for
two or three years only after the implementation. As shown in Table 3, the average crash
frequencies of the DDIs are lower than that of the comparison diamond interchanges for most crash
types, which may imply that the DDIs are safer than the conventional diamond interchanges.
However, this is not strong evidence, and more reliable statistical analyses should be conducted.
Table 3: Crash data descriptive statistics
Variable
Diamond Interchange (N=240)
DDI (N=80)
Mean Stdev Min Max Mean Stdev Min Max
Total 21.744 24.450 0.154 107.307 19.855 22.459 0.231 82 Fatal 0.026 0.047 0 0.154 0.035 0.051 0 0.151 Injury 5.093 5.405 0.077 18.923 4.435 4.612 0.013 15.54 PDO 16.625 19.421 0.077 90.154 15.404 18.072 0.154 66.464 Rear-end 10.332 13.042 0.145 53.462 9.991 12.442 0.211 51 Angle/Left-turn 5.378 6.323 0.154 27.615 4.551 4.902 0.114 13.701 Sideswipe 1.923 2.775 0.113 14.231 2.121 3.012 0.012 10.85 Head-on 0.509 0.715 0 3.769 0.363 0.391 0 1.231 Non-motorized 0.043 0.070 0 0.231 0.051 0.074 0 0.232 Single-vehicle 2.764 3.314 0 14.769 2.188 2.252 0.077 7.462
Moreover, many explanatory variables were identified and collected, including the AADTs
of the freeway, the arterial and ramps if available, speed limits, the number of lanes for each traffic
24
the 80 DDIs and their comparison sites, while only 47 DDIs and their comparison sites were
provided with freeway ramp AADTs. To balance the effects of sample size and the completeness
of AADT, two modeling strategies were considered in developing SPFs. The first strategy includes
all the 80 DDIs and their comparison sites with only arterial AADTs. The second strategy includes
47 DDIs and their comparison sites with the consideration of total vehicles entering the DDI
(TEV), which is the summation of the AADTs of the freeway exit ramps and the arterial. Other
important factors that are related to the geometric configuration of DDIs were also considered,
such as crossovers’ distance and configuration type. The crossovers’ distance indicates the distance between crossovers in the case of DDI and the distance between ramp terminals in the case of the
conventional diamond interchange. The configuration type indicates whether the interchange is
overpass or underpass, which means the arterial passes over or under the freeway. Table 4 shows
the descriptive statistics of all the collected explanatory variables.
Table 4: Explanatory variables descriptive statistics
Variable Diamond interchange (N=240) (N=80) DDI
Mean Stdev Min Max Mean Stdev Min Max
Freeway Exit Ramp AADT* 6086.8 4097.12 488 21060 6049.19 3870.80 503 18000 Arterial AADT 18934.93 10088.23 1489 46783 21224.08 13287.98 1295 76100 Distance between crossovers/ramp terminals (ft) 667.96 251.65 228.60 1656.07 731.92 244.38 364.23 1651.51 Freeway Exit Speed Limit 36.22 8.2 25 40 39.71 4.13 25 45 Arterial Speed Limit 43.25 3.22 40 55 48.89 4.16 35 55 Distance to the nearest intersection (ft) 954.68 712.33 291 1863 845.32 413.52 176 1147 Configuration Type(overpass=1, underpass=0) 0.63 0.49 0 1 0.70 0.46 0 1 Skew Angle (˚) 12.65 9.63 0 38 15.52 13.52 0 45 Lighting 0.71 0.13 0 1 0.85 0.15 0 1
25
Table 4 (Continued)
Variable Diamond interchange (N=240) (N=80) DDI
Mean Stdev Min Max Mean Stdev Min Max
Pedestrian Facility type (median=1, sidewalk=0) 0.23 0.15 0 1 0.62 0.32 0 1 Freeway Exit Right Turn Control Type(signalized=1, unsignalized=0) 0.34 0.05 0 1 0.74 0.38 0 1
Freeway Exit Left
Turn Lanes 1.13 0.14 1 2 1.22 0.05 1 2
Arterial Left Turn
Lanes 0.89 0.09 0 1 0 0 0 0
Freeway Exit
Right Turn Lanes 1.05 0.08 0 2 1.12 0.32 1 2
Arterial Right
Turn Lanes 0.78 0.12 0 1 0.65 0.08 0 1
Arterial Through
Lanes 2.17 0.28 1 3 2.45 0.11 1 3
Data Preparation for DLT Analysis
Two types of data were collected for this analysis. First, historical crash data was acquired
from different states to assess the safety performance of these intersections. Although there are
more than 30 DLTs in the US, only 13 intersections were considered in this study due to limited
data availability. The reason is that some DLTs were implemented before 2009 and there is no
available historical crash data for years before their implementation date. The crash data before
implementation is necessary for conducting the before-after analysis which is the first method used
in this study. The studied DLTs are located in four states which are Utah, Colorado, Louisiana,
and Ohio. However, most of them (10 out of 13) are located in Salt Lake City metropolitan area,
UT. For each DLT, two conventional intersections were selected as a part of the comparison group.
The conventional intersections were chosen considering some constrains (i.e., same number of
legs, same control type, comparable traffic volumes, etc.). The total sample size was 39
26
the transportation authorities in the previously mentioned states since year 2008 up to the latest
available year. However, the statewide crash data should be manipulated to prepare the crash
frequency at each studied intersection. Since DLTs consist of both main intersection and crossover
left-turn locations, different effectiveness regions of intersections were considered:
1) 250 feet buffer from the center of the main intersection.
2) Large buffer covering all the left-turn crossovers and the main intersection
3) 250 feet buffer from the center of the main intersection and 50 feet buffer from the center
of each crossover point
These different scenarios resulted in different crash frequencies at each intersection.
However, preliminary analysis showed that the third scenario is the most realistic. This is
predictable because the first scenario does not consider crashes related to the crossover and the
second scenario considers crashes that may be related to neither the main intersection nor the
crossover. In addition to crash data, operational and geometric characteristics (i.e., AADT, DVMT,
skew angle, speed limit, etc.) were collected for each intersection.
Table 5 and Table 6 show the descriptive statistics for DLTs and conventional
intersections, respectively. The crash data is summarized for 5 years after each DLT
implementation (not all DLTs were constructed in the same year). The descriptive statistics show
that DLTs have an average crash frequency of 168.17 crashes per intersection and the conventional
intersections have 141.26 crashes per intersection. This indicates that DLTs might not have safety
27
Table 5: Descriptive Statistics of DLTs
Variables Mean Stdev. Min. Max.
Crash Type Total crashes 168.17 77.10 53 365 Fatal-and-Injury 52.88 31.47 15 145 PDO 115.29 49.77 38 220 Single-vehicle 9.94 5.15 3 20 Multi-vehicle 141.29 65.88 44 304 Non-motorized 1.64 2.34 0 8 Explanatory Variables
Major AADT (vehicles/day) 49827.24 14220.42 20288 70000
Minor AADT 23883.06 13094.50 6075 43000
Total Entering Vehicles (vehicles/day) 73710.29 23433.65 28223 104000
Major DVMT (vehicle miles/day) 6707.51 1914.29 2731.08 9423.08
Minor DVMT 2296.45 1259.09 584.13 4134.62
Total DVMT 7835.74 2406.89 3056.88 11041.67
Skew Angle (˚) 6.235 10.317 0 32
Skewed (yes=1, no=0) 0.294 0.470 0 1
Major Speed Limit (mph) 48.235 6.359 40 60
Minor Speed Limit 39.706 4.832 30 45
Lighting (yes=1, no=0) 0.941 0.243 0 1
Pedestrian Crossing (yes=1, no=0) 0.882 0.332 0 1
28
Table 6: Descriptive Statistics for the Conventional Intersections
Variables Mean Stdev. Min. Max.
Crash Type Total crashes 141.26 69.24 34 313 Fatal-and-Injury 48.47 24.49 11 120 PDO 92.85 46.56 23 220 Single-vehicle 7.588 5.02 2 22 Multi-vehicle 119.05 57.96 29 260 Non-motorized 3.44 3.01 0 15 Explanatory Variables
Major AADT (vehicles/day) 40985.38 8278.54 17652 54000
Minor AADT 16923.00 9968.77 2116 38000
Total Entering Vehicles (vehicles/day) 57908.38 14214.71 21467 92000
Major DVMT (vehicle miles/day) 3881.19 783.95 1671.59 5113.64
Minor DVMT 1602.56 944.01 200.38 3598.48
Total DVMT 5483.75 1346.09 2032.86 8712.12
Skew Angle (˚) 3.35 7.746 0 25
Skewed (yes=1, no=0) 0.14 0.35 0 1
Major Speed Limit (mph) 41.91 6.74 35 60
Minor Speed Limit 36.02 6.71 20 50
Lighting (yes=1, no=0) 0.82 0.38 0 1
Pedestrian Crossing (yes=1, no=0) 0.94 0.23 0 1
29
The second type of data considered for this study is high-resolution traffic data which has
been proposed to evaluate the operational performance of DLTs. The source of this data is the
ATSPM which is a traffic signal management system (FHWA). This data describes various traffic
signal events (i.e., green phase start, detector on/off) provided for every second. Although the DLT
intersections are implemented in different states, we were able to obtain high-resolution traffic
data only from Utah. Consequently, this operational analysis considered only the DLTs located in
UT and their comparison intersections. The data was collected for 7 days from 04/01/2019 to
04/08/2019. This time interval was selected to consider all the traffic volume fluctuations by day
and night throughout the week. This data provided the operational measure of performance used
in this analysis which is intersection delay and other traffic measures like through and left-turn
volumes. These traffic volumes are acquired from the responses of the advance and stop detectors
located at the intersection. On the other hand, the intersection delay was provided using Equation
11 which depends on the number of arrivals and departures during the signal green and red times.
Please refer to (Day et al., 2014) for further details regarding the method of calculating the delay.
Furthermore, other operational and geometric characteristics (i.e., speed limit, skew angle)
were collected to check if they affect the intersection operational performance. Table 7 shows the
descriptive statistics for the most important variables related to the intersection operation. It
indicates that DLTs can accommodate higher through and left-turn traffic volumes than the
conventional intersections. They also provide lower delay time for the users. This is consistent
with the previous studies that claimed DLTs have great operational benefits. Nevertheless, a
detailed analysis should be conducted to check the validity of this conclusion.
𝑑 = ∫ [𝑞(𝑡𝑜) + 𝐴(𝑡) − 𝐷(𝑡)]𝑑𝑡 (11) 𝑡𝑜+𝑇
𝑡𝑜
30
q(t0) = queue length at time to (number of vehicles)
A(t) = arrival rate (vehicles per unit time)
D(t) = service, or departure, rate (vehicles per unit time)
to = beginning of analysis period
T = duration of analysis period
Table 7: Operational Measures Descriptive Statistics
Variable Mean Stdev. Min. Max.
DLT Conv. DLT Conv. DLT Conv. DLT Conv.
Delay (Sec/Veh) 18.27 20.34 4.78 2.96 5.75 13 22.75 26.50
Through Volume (vph) 3701.20 3074.05 926.54 596.70 2021 1958 4748 4321 Left Turn Volume (vph) 1064.90 852.80 383.55 231.50 594 578 1886 1456
31
CHAPTER 5: SAFETY PERFORMANCE OF DDIs
Before-After Analysis
Two before-after approaches, before-after with comparison group (CG) and Empirical
Bayes before-after (EB), were conducted to evaluate the safety performance of DDIs. For the EB
method, two modeling strategies were considered for the analysis. The first strategy included 65
DDIs and their reference sites with only arterial AADTs. The other strategy included 37 DDIs with
their reference sites considering all vehicles entering the DDI (TEV). The key difference between
the two methods is how to calculate the expected number of crashes after the DDI implementation.
In the CG method, the expected number of crashes is calculated based on the observed
crash frequencies at the comparison sites before and after the treatment in addition to the observed
crash frequency at the treated sites before the implementation. On the other hand, the EB method
calculates this expected number based on the predicted crash frequency at the treated sites before
and after the implementation. These predictions were conducted based on specific safety
performance functions, which were developed using a reference group. The selected comparison
group was used as a reference group for the EB method. It should be noted that, for the EB method,
there was not much difference between the two proposed modeling strategies. However, the results
of the strategy considering partial sample size were discarded since the full sample size strategy
provided more statistically significant SPFs’ parameters.
Table 8 shows the developed SPFs that were used to calculate the predicted and then the
expected crash frequencies in case of the full sample size. These SPFs were developed in terms of
the arterial volume. The table shows significant positive effects of either the arterial AADT or the
32
Table 8: SPFs for Empirical Bayes’ expected crash frequency calculation (full sample size)
Crash Type Intercept LnAADT_Arterial Dispersion
Total Coef 3.0458 0.0132* 0.6137 P-value <.0001 0.0862 Fatal&Injury Coef 1.118 0.047* 0.5701 P-value 0.1392 0.0540 PDO Coef 2.919 0.0312* 0.6346 P-value 0.0001 0.0689 Rear-end Coef 2.6995 0.0631** 0.7424 P-value 0.0012 0.0457 Angle/Left-turn Coef 1.8336 0.0193* 0.5447 P-value 0.0143 0.0800 Sideswipe Coef 0.3125 0.0249* 0.8625 P-value 0.7445 0.0798 Head-on Coef 0.2512 0.0875 0.9813 P-value 0.8323 0.4684 Non-motorized Coef -9.1573 0.6431** 1.3365 P-value 0.0037 0.0406 Single-vehicle Coef -0.9155 0.1801** 0.5662 P-value 0.2653 0.0307
** significant at 95%, and * significant at 90%.
Table 9 shows the crash modification factors (CMFs) associated with converting the
conventional diamond interchange to DDI. The CG method shows that the DDI can decrease the
crash frequency of the total, fatal-and-injury, PDO, rear-end, and angle/left-turn crashes by 26%,
49%, 19%, 18%, and 68%, respectively. On the other hand, the EB method shows that it can
decrease them by 14%, 44%, 8%, 11%, and 55%, respectively. It is clearly shown that the two methods concluded similar trends, while the CMF values of the EB method are slightly higher than
those of the CG method. This may be due to the regression to the mean effect. In other words, the
CG method showed a higher crash reduction. However, a proportion of this reduction may be due
to the regression to the mean effect that the EB approach can successfully account for. It should
be noted that the reduction in rear-end crashes makes sense because left-turn freeway traffic
volumes do not have to stop immediately at the end of the exit ramp as in the conventional diamond
33
the number of crossing conflict points at the DDI is lower than it at the conventional diamond
interchange.
Table 9: CMFs for DDIs resulting from the before-after methods
Crash Type
B-A with CG EB B-A (full sample size)
CMF P-value CMF P-value Total 0.736*** <0.001 0.858*** <0.001 Fatal&Injury 0.515*** <0.001 0.558*** <0.001 PDO 0.812*** 0.006 0.920*** <0.001 Rear-end 0.824** 0.039 0.887*** 0.002 Angle/Left-turn 0.319*** <0.001 0.448*** <0.001 Sideswipe 1.156 0.538 1.241 0.475 Head-on 0.378 0.478 0.643 0.412 Non-motorized 1.232 0.726 1.762 0.394 Single-vehicle 1.166 0.488 0.845 0.213 *** significant at 99%, ** significant at 95%. Cross-Sectional Method
Using the Cross-Sectional analysis, safety performance functions were developed for each
crash type based on the collected crash data and explanatory variables for the two modeling
approaches. The first, includes 80 DDIs and their comparison sites, while the second includes 47
DDIs and their comparison sites. Similar to the EB method, using the full sample size using the
arterial AADT provided more significant parameters, thus the results of the other approach using
the TEV is not shown here. These SPFs included all the significant explanatory variables along
with the natural logarithm of the traffic volume variable (arterial AADT) and the dummy variable
DDI (1 if the interchange is DDI and 0 if it is a diamond interchange).
Table 10 presents the developed SPFs for the total crashes and each crash type. It shows that the variable “LnAADTarterial” has positive effect on crash frequency for the total number of crashes, as well as other crash types (i.e., fatal-and-injury, PDO, angle/LT, non-motorized and
34
the total, fatal-and-injury, PDO, rear-end, and angle/LT crashes, which means that DDIs have
lower crash numbers than the conventional diamond interchanges. This finding is consistent with
the results of the before-after methods.
The SPFs also showed that the speed limit variables, which are “Arterial Speed Limit” and “Freeway Exit Speed Limit”, have positive effects on the crash frequency. The increase of the arterial’s speed limit can significantly increase the total crashes, while the increase of the freeway exit’s speed limit can significantly increase the total crashes as well as the angle crashes. The developed SPF for PDO crashes shows that signalizing the freeway right-turn exit has a negative
effect on the frequency of PDO crashes. The variables of “Distance to Adjacent intersection” and “Adjacent Intersection Control Type” did not show any significant effects on safety performance.
35
Table 10: Safety Performance Functions from the cross-sectional analysis (full sample size) Crash Type
Intercept LnAADTarterial DDI Distance
Between Crossovers Config. Type Distance To adjacent Adjacent Intersect. Cont.Type Freeway Exit Sp. Limit Arterial Speed Limit Fr Ex Rt Ct Type Total Coef 3.6846 0.0530** -0.2722*** -0.0005*** 0.1343 -0.0001 0.0154 0.0063** 0.0214* P-value <.0001 0.0312 0.0037 0.0029 0.1086 0.1333 0.8465 0.0305 0.0721 Fatal&Injury Coef 0.8986 0.0970* -0.4816*** -0.0004** 0.1462 -0.0001 0.0320 0.0543 P-value 0.0921 0.0614 <.0001 0.0196 0.8484 0.3372 0.6897 0.2415 PDO Coef 2.7615 0.0256* -0.2008*** -0.0006*** -0.8912* P-value <.0001 0.0625 0.0317 <.0001 0.0817 Rear-end Coef 2.4541 0.0741 -0.0220** -0.0006*** P-value <.0001 0.2143 0.0416 0.0012 Angle/Left-turn Coef 1.8766 0.0208* -0.8098*** -0.0004** 0.0180 -0.0002 -0.0304 0.2144* 0.7316 P-value 0.0007 0.0697 <.0001 0.0297 0.8336 0.5321 0.7077 0.0632 0.2422 Sideswipe Coef 0.9158 0.0517 -0.1156 -0.0006*** P-value 0.4266 0.4560 0.3625 0.0097 Head-on Coef 1.2411 -0.0348 -0.3293 P-value 0.3739 0.6891 0.7481 Non-motorized Coef -7.3772 0.7416*** 0.5558 0.6417*** P-value 0.0121 0.0008 0.4174 0.0088 Single-vehicle Coef 0.1970 0.1366*** 0.1812 -0.0008*** 0.2098** P-value 0.8092 0.0096 0.5274 <.0001 0.0104 *** significant at 99%, ** significant at 95%, and * significant at 90%.
DDI (DDI=1, conventional diamond interchange=0) Configuration Type (underpass=1, overpass=0)
Adjacent Intersection Control Type (signalized=1, unsignalized=0) Freeway Exit Right-turn Control Type (signalized=1, unsignalized=0)
36
Furthermore, the variable of “Distance between Crossovers/Ramp Terminals” has a negative effect on the crash frequency of the total crashes as well as the fatal-and-injury, PDO, rear-end, angle/LT,
and single-vehicle crashes, which means that the longer distance between crossovers/ramp
terminals is associated with lower crash frequencies. For more clarification of the safety effect of
the distance between crossovers/ramp terminals, Figure 10 shows the relation between the average
crash frequency and the distance between crossovers/ramp terminals in case of all other variables are constant. For instance, if the crossovers’ distance of an interchange increases from 600 to 800 feet, the average total crash frequency could decrease from 12 to 8 crashes per year, which means
around 33% decrease.
Figure 10: Effect of crossovers’ distance on average crash frequency
In addition, the attribute of configuration type “underpass” has a positive effect on the
non-motorized and single-vehicle crashes, which means that the interchanges with the underpass
configuration have more crashes than those of the interchanges with the overpass configuration. 0 5 10 15 20 25 30 35 40 45 0 200 400 600 800 1000 1200 1400 1600 1800 Cr ash Fr equency (y ea rly) Crossover Distance (ft)
37
This may be because the overpass configuration provides more space for the non-motorized users
38
CHAPTER 6: SAFETY AND OPERATIONAL PERFORMANCE OF DLTs
Safety Analysis
Table 11 summarizes the results of the safety analysis using the first proposed safety
analysis method for this analysis (before-and-after method with the comparison group). It shows
that DLTs can significantly increase the total number of crashes. In addition, they can increase
particularly fatal-and-injury, single-vehicle crashes. However, they have the potential to reduce
non-motorized crashes (p-value=0.103). Overall, about 11% of the total crashes have increased,
and 22% and 7% fatal-injury and PDO crashes, respectively, have also increased after the
implementation of DLTs. The most significant increasing crash type is single-vehicle which has
increased by 52%. However, no significant change was observed in other types like rear-end,
head-on and sideswipe.
Table 11: CMFs for the Implementation of DLTs by Crash Type (B-A study with CG)
Crash Type CMF S.E. P-value
Total crashes 1.112** 0.046 0.015 Fatal-and-Injury 1.224** 0.090 0.013 PDO 1.069** 0.034 0.045 Single-vehicle 1.519** 0.221 0.019 Non-motorized 0.612 0.238 0.103 Angle 1.244 0.149 0.102 Rear-end 0.946 0.095 0.570 Head-on 0.713 0.288 0.318
Sideswipe same direction 0.967 0.220 0.882
*** significant at 99% confidence level, ** significant at 95% confidence level, and * significant at 90% confidence level.
39
To sum up, the before-after method showed that DLTs can significantly increase total,
angle and single-vehicle crashes. The crash increase may be due to the drivers’ confusion with the
non-traditional left-turn maneuver. On the other hand, the potential decrease of non-motorized
crashes may be due to excluding the left-turn maneuver at the main intersection. Consequently,
this may reduce the conflict between the vehicles turning left and the crossing pedestrians.
The cross-sectional analysis was conducted to validate the results of the before-after
method and investigate if there are operational or geometric characteristics that affect the crash
frequency. Table 12 and Table 13 show the safety performance functions (SPFs) and the crash
modification factors (CMFs) resulting from the cross-sectional analysis. First, the safety
performance functions of implementing DLTs by each crash type are shown in Table 12. They
show that the variable ‘DLT*Ln(DVMT)’ has a positive effect on most of the crash types except
the non-motorized crashes. This implies that DLTs could increase the crash frequency in
comparison to conventional intersections. It is possible that drivers may be confused about the new
operation rules of DLTs and this resulted in more crashes. In contrast, DLTs tend to have a smaller
number of crashes involving pedestrians and bicyclists. This may be due to prohibiting left-turn
vehicle movements at the main intersection. Moreover, the variable IRI (International Roughness
Index) significantly increases the total and PDO crashes, which makes sense because higher IRI
values indicate poor pavement conditions. Furthermore, the variable ‘Speed difference’
significantly decreases most of the crash types which implies that the crash frequency decreases
when the minor street has a low speed limit. This is predictable because the lower speeds at the
40
Table 12: SPFs of DLTs Implementation (Cross-Sectional Analysis)
Crash type Interception Ln(DVMT) Ln(DVMT) *
DLT Speed dif. IRI Dispersion
Total crashes Coef. -2.248 0.586
** 0.050*** 0.002* 0.145 S.E. 2.696 0.2954 0.018 0.001 0.042 Fatal-and-Injury Coef. -0.952 0.384 0.040 *** -0.033*** 0.129 S.E. 2.106 0.244 0.019 0.012 0.043 PDO Coef. -2.830 0.623 ** 0.067*** -0.028*** 0.002** 0.108 S.E. 2.398 0.264 0.017 0.010 0.001 0.034
Single vehicle Coef. 3.534 -0.334 0.064
*** -0.022 0.092 S.E. 2.478 0.288 0.023 0.014 0.056 Non-motorized Coef. 5.646 -0.714 -0.062 * 0.313 S.E. 4.017 0.468 0.0387 0.208 Angle Coef. -1.213 0.424 0.039 * -0.042*** 0.001 0.206 S.E. 3.647 0.3961 0.024 0.0149 0.001 0.065 Rear-end Coef. -4.709 0.798 *** 0.051*** -0.020* 0.001 0.156 S.E. 2.840 0.310 0.174 0.011 0.000 0.048 Head-on Coef. -2.510 0.407 0.070 -0.081 ** 0.001 0.401 S.E. 6.571 0.729 0.052 0.033 0.002 0.200 Sideswipe same direction Coef. -3.880 0.569 0.081 -0.034*** 0.002*** 0.055 S.E. 2.302 0.249 0.018 0.012 0.001 0.044
*** significant at 99% confidence level, ** significant at 95% confidence level, and * significant at 90% confidence level. Speed dif. refers to the difference between the major and minor roads’ speeds