National Conference on Computational Technologies-(NCCT-2016),
Organized by Dept. of Computer Science & Application, University of North Bengal – India Available online at: www.ijcseonline.org
Page No. 016
Research Paper Volume-4, Special Issue-1 E-ISSN: 2347-2693
Histogram Peak Normalization Based Threshold to Detect Brain Tumor
from T1 Weighted MRI
Mr. Kanishka Sarkar*
Research Personal Dept. of Computer Sc. and App.University of North Bengal Raja Rammohanpur , India [email protected]
Mr. ArdhenduMandal
Assistant Professor Dept. of Computer Sc. and App.University of North Bengal Raja Rammohanpur , India
Mr.Rakesh Kumar Mandal
Assistant Professor Dept. of Computer Sc. and App.
University of North Bengal Raja Rammohanpur , India [email protected]
Abstract—Medical imaging is a process of creating images of interior body organs or parts which is very useful for diagnose, clinical analysis and treatment of specific disease. Magnetic Resonance Imaging (MRI) is amedical imaging technique used primarily in medical settings to produce high quality images of the inside of the human body or parts. MRI has become effective way to study brain tumors.Threshold based image segmentation is a common technique often used to detect the tumor object. The literature survey depicts that most of the existing methods have ignored the poor quality images. In this paper a method has been proposed based on histogram segmentation to detect the brain tumor from T1 weighted MRI images. T1 weighted MRI images of brain has been takenas input. This system includes image filtering, image segmentation, and object extraction for the purpose. The whole procedure has been implemented in MATLAB.
Index Terms—Magnetic Resonance Image (MRI), Histogram segmentation, Brain tumor, Histogram peak difference
I. INTRODUCTION
Image segmentation is the process of partitioning a digital image into different regions. Which play an important role in the field of surgical planning, post surgical assessment, abnormality detection and alike. That’s why it is important to design an image processing based computer vision application that performs accurate segmentation of medical images[3].This is very difficult in nature because medical images commonly have very poor contrast, unknown irregular noise, weak boundaries and non homogeneity[12] like properties. Statistically, tumors are the second cause of cancer related deaths in the under 20 aged children and under 40 aged males. It is also the fifth cause of cancer related deaths in females ages 20 to 39[13-17].Brain tumor is a cluster of abnormal cells growing in the brain or close to brain[9]. Brain Tumor can be mainly two types: (1) Benign and (2) malignant[5-8]. A scan is the first step to identify the presence of a brain tumor. A scan creates computerized images of the brain and spinal cord by examining it from different angles. Most Commonly used scanning and imaging techniques are: (i) Computed Axial Tomography (CAT or CT Scan).(ii) Magnetic Resonance Imaging (MRI)[1-6].
National Conference on Computational Technologies-(NCCT-2016),
Organized by Dept. of Computer Science & Application, University of North Bengal – India
Page No. 017
Figure 1: Percent of New Cases by Age Group[18].Most of the existing methods i.e. [23-26]have ignored the images which are of poor quality with noise and low brightness and use histogram thresholding as a pre-processing step[7]. Here,in this paper it has been tried to overcome such limitation.Here,it has been shown that histogram peakNormalizationthreshold basedsegmentation can be used as aefective method for detecting the brain tumor.
II. RELATED WORK
Manoj K Kowar and SourabhYadav et at[7] present an efficient segmentation technique using the concept of symmetric structure of brain. By calculating the difference between two symmetric parts the algorithm decides whether a tumor is present or not.EashaNoureen and Dr. Md. Kamrul Hassanet at[20] also use the same concept.Swathi P S, DeepaDevassy, Vince Paul and Sankaranarayanan P Net at[21] use the symmetric structure concept of brain to find the threshold find and then useANN to do proper segmentation. But if the tumor grows in both of the segments uniformly then this methods will not be able to perform the detection.
Figure 2: Symmetrical structure of the brain[7] III. PROPOSEDWORK
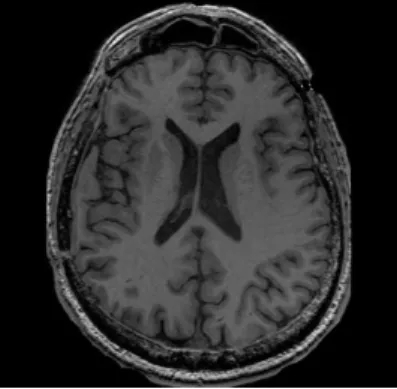
T1 weighted images are useful for brain parenchyma in which brain appears medium gray and CSF (Cerebrospinal fluid) is dark gray, and air is nearly black. Most tumors appear dark, with low signal intensity. Fat has high signal intensity on T1[11]. Gadolinium contrast added to the T1 may “light up” a tumor or abscess. If a lesion has dark signal on T1, and bright signal with gadolinium, it is a “contrast enhancing” lesion. The enhancement may be the same throughout the lesion, making it “homogeneously enhancing”as shown in Figure 3.
National Conference on Computational Technologies-(NCCT-2016),
Organized by Dept. of Computer Science & Application, University of North Bengal – India
Page No. 018
Or, it may enhance only around the edges, making it “ring enhancing” as in a brain abscess, or in this lung met [19]as shown in Figure 4.Figure 4:T1 weighted brain tumor mage with ring enhancing
Figure 5:T1 weighted brain MRI normal image Based on the above idea the following Stepshas been developed:
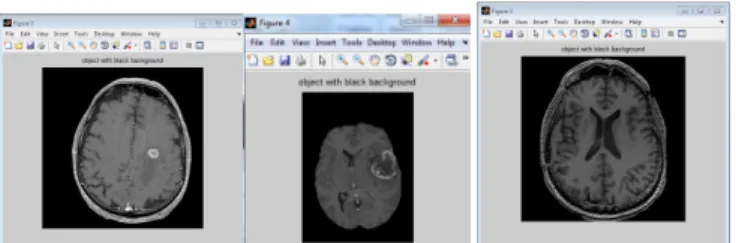
Step1:Remove the backgroundinput image by masking brain object
Step 2:Find the histogram peak(P) and then find the normalization point (NP).
Step 3: Perform segmentation using normalization point NP. A Normalization point (threshold) can be applied to segment the object and background. Threshold is defined mathematically as shown below [10]:
C(i,j)= 255 , ≥ 0 , < (1) Where, T is Threshold.
Step 4:Extract the approximate skull area.
Step 5:Determining the position of tumor with respect to skull. IV. METHODOLOGY
Our presented work based on the histogram peaks. From the peaks it has been tried to get a threshold which can differentiate cerebrum and remaining part (skull and tumor). Then by removing the skull part the tumor object is found. The flow chart given bellow depicts the entire process
National Conference on Computational Technologies-(NCCT-2016),
Organized by Dept. of Computer Science & Application, University of North Bengal – India
Page No. 019
Figure 6: Flowchart of the method usedStep1:Preprocessing
After reading the image, ithas been convertedin gray scale image.Then the background part has been removed with the help of masking image. To form the masking image,the imagehas been converted into binary image.Thenthe binary imagehas been divided into four equal size segments say A, B, C, D. As skull has higher intensity valuethan cerebrum part and it is the outer part of brain, it takes white color in the binary image.
So, for each segment we scan each row and after getting a white pixel we set each pixel of the row with intensity value=1. Then we join the four segments and form a masking image(say X).
X=[A B; C D]; Output as shown in below
READ THE IMAGE
PREPROCESSING THE INPUT IMAGE
DETERMINATION OF SKULL AREA
COMPUTATION THE MAXIMUM HISTOGRAM PEAK
DETERMINE THE NORMALIZATION BOUNDARY POINT
SEGMENTATION USING THRESHOLD POINT
SUPERIMPOSE THE APPROXIMATE SKULL ON SEGMENTED IMAGE
STOP
National Conference on Computational Technologies-(NCCT-2016),
Organized by Dept. of Computer Science & Application, University of North Bengal – India
Page No. 020
Figure 7: Masking image of Figure 3, Figure 4 and Figure 5With the help of masking image the brain object has been found with a background of zero intensity. I=I.*uint8(X);
Where, I is Threshold is the input image.
Then the image has been filteredusing median to remove the thermal noise.
Figure 8:Figure 3, Figure 4 and Figure 5 without background. Step 2: Skull area determination
A approximate skull area of width 5 has been obtained by scanning the image row wise and using the same concept discuss in step 1, after getting a white pixel we set next 4 pixel to white. Again the image has been scaned in column wise and perform the same again. By mergeing this two newly generated images (say A1 and B1)anew image(say Y)has been constructed which depicts the skull of 5 pixels width.
Y=[A1;B1];
Output as shown in below.
Figure 9: Approx skull area of Figure 3, Figure 4 and Figure 5 Step3: Computation of maximum peak of the histogram
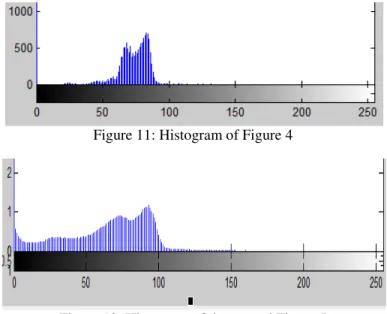
From the histogram of the filtered image the maximum peak (P) has been calculated from range 20 to 256[22].
National Conference on Computational Technologies-(NCCT-2016),
Organized by Dept. of Computer Science & Application, University of North Bengal – India
Page No. 021
Figure 11: Histogram of Figure 4Figure 12: Histogram of the second Figure 5 Step 4: Computation the normalization boundary point
Then a normalization point (NP) has been obtained such that for minimum value of P the following condition holds. 10*NP<= P.
Then the image has been normalized by setting non background and smaller intensities than the boundary pointby the intensity value of Normalization point.
The output is shown below:
Figure 13: Normalization image of Figure3, Figure4 and Figure5 Step 5: Segmentation using Normalization point
Then the resultant image has been segmented by setting all the intensities which is less than or equal to NP by 0 otherwise 255. I(i,j)= 0, , ≤
255, ℎ
The output is shown below:
Figure 14: Segmented image of Figure 3, Figure 4 and Figure 5 Step 6: Superimpose the skull
Skull is very important to determine the position of tumor with respect to skull. Because it helps the physician to percept the exact position of tumor in the brain. That’s way here the approximate skull area has been superimposed to the segmented image. The output is shown below:
National Conference on Computational Technologies-(NCCT-2016),
Organized by Dept. of Computer Science & Application, University of North Bengal – India
Page No. 022
Figure 15: Final output of Figure3,Figure4 and Figure 5V. RESULTS
Table 1: Result statistic Sl No. MRI image Segmented
image Expected output Actual output Remarks 1 Tumor present Tumor present Ok 2 Tumor present Tumor present Ok 4 Tumor present Tumor present Ok 4 Tumor present Tumor present Ok 5 Clean Clean Ok 6 Clean Clean Ok 7 Clean Clean Ok 8 Tumor present Clean Fail
National Conference on Computational Technologies-(NCCT-2016),
Organized by Dept. of Computer Science & Application, University of North Bengal – India
Page No. 023
10 Tumor present Tumor present OK 11 Tumor present Tumor present Ok(Hard to distinguish Noise and Tumor) 12 Tumor present Tumor present Ok 13 Tumor present Tumor present Ok 14 Tumor present Tumor present Ok 15 Clean Clean Ok VI. LIMITATIONThe proposed algorithm performs well for homogeneously enhancing[19] as the hole tumor takes bright color than non tumor region in the cerebrum part. But in case of ring enhancing if the size of tumor is such small then it is difficult to identify the tumor in respect of segmentation noise as shown in case 11. Another limitation is as in the case 8, very poor quality images with ring enhancing are not detectable here.
VII. FUTUREWORK
The brain tumor detection is a critical application. In this paper it is tried to design an algorithm using the histogram segmentation to detect the tumor. As the resultis very satisfactory it can be concluded that the algorithm achieves at least some level of our determination. In future the algorithm can further developed for more precise result. Artificial neural network can be further introduced with this algorithm to design an expert system.
ACKNOWLEDGEMENT
This work is carried out for the project entitled “Design and Development of Artificial Neural network based Expert system to diagnose Human Brain Tumor from CT scan and MRI images” under the scheme “ XII plan UGC assistance under Innovative Research Activities” in the Department of Computer Science and Application, University of North Bengal, India.
National Conference on Computational Technologies-(NCCT-2016),
Organized by Dept. of Computer Science & Application, University of North Bengal – India
Page No. 024
REFERENCES[1] http://neuroinstitute.org/btc/brain-tumor.html
[2] Leonard V. Crowley, An Introduction to Human Disease: Pathology and Pathophysiology Correlations.9th ed., Jones & Bartlett Publishers, 2013, pp. 192-209,
[3] PankajSapra, Rupinderpal Singh, ShivaniKhurana, “Brain Tumor Detection Using Neural Network.” International Journal of Science and Modern Engineering. Vol. 01(09), pp. 83-88, August, 2013.
[4] Pankaj Kr. Saini, Mohinder Singh, “Brain Tumor Detection In Medical Imaging Using Matlab.” International Research Journal of Engineering and Technology.Vol. 02(02), pp. 191-196, May, 2015.
[5] M.Karuna, Ankita Joshi, “Automatic Detection And Severity Analysis Of Brain Tumors Using Gui In Matlab.”International Journal of Research in Engineering and Technology. Vol. 02(10), pp. 586-594, October 2013.
[6] Geetika Gupta, RupinderKaur, ArunBansal, MunishBansal, “Analysis and Comparison of Brain Tumor Detection and Extraction Techniques from MRI Images.” International Journal of Advanced Research in Electrical,Electronics and Instrumentation Engineering. Vol. 03(11), pp. 13272-13284, November 2014.
[7] Manoj K Kowar and SourabhYadav, “Brain Tumor Detction and Segmentation Using Histogram Thresholding.”International Journal of Engineering and Advanced Technology. Vol. 01(04), pp. 16-20, April 2012.
[8] HarneetKaur ,SukhwinderKaur,“Improved Brain Tumor Detection Using Object Based Segmentation.”International Journal of Engineering Trends and Technology. 13(01), pp. 10-17, July 2014.
[9] Gerard P. Montague. Who Am I? Who Is She?: A Naturalistic,Holistic, Somatic Approach to Personal Identity. Berlin, Germany:Walter de Gruyter, pp. 103-123, 2012.
[10] P.K.Srimani and Shanthi Mahesh, “A Comparative Study of Different Segmentation Techniques for Brain Tumour Detection.” International Journal of Emerging Technologies in Computational and Applied Sciences. Vol. 04(02), pp. 192-197, March-May 2013.
[11] Jin Liu, Min Li, Jianxin Wang Fangxiang Wu, Tianming Liu, and Yi Pan, “Survey of MRI-Based Brain Tumor Segmentation Methods.” Tsinghua Science And Technology, Vol. 19(6),pp. 578-595, December 2014.
[12] Eman Abdel-Maksoud, Mohammed Elmogy, Rashid Al-Awadi, “Brain tumor segmentation based on a hybrid clustering technique” Egyptian Informatics Journal. 16(01). Pp 71-81, March 2015.
[13] C. Croisille, M. Souto, M. Cova, S. Wood, Y. Afework, J.E. Kuhlman, E.A. Zerhouni. Pulmonary nodules, “Improved detection with vascular segmentation and extraction with spiral CT”. Radiology 197, pp.397-401, 1995.
[14] T. Tozaki, Y. Kawata, N. Noki, H. Ohmatsu, K. Eguchi, N. Moriyama. “Three-dimensional analysis of lung area using thin slice CT images”. Medical Imaging Proc SPIE, Vol. 2709, pp.02-11, 1996.
[15] M.L. Giger, K.T. Bae, H. MacMahon. “Computerized detection of pulmonary nodules in computed tomography images”. Invest Radiology. Vol. 29(4), pp.459-465, 1994.
[16] S. Toshioka, K. Kanazawa, N. Niki, H. Satoh, H. Ohmatsu, K. Eguchi, N Moriyama. “Computer aided diagnosis system for lung cancer based on helical CT images, image processing.” KM Hanson, ed. Proc SPIE 3034, pp.975-984, 1997.
[17] J. Toriwaki, A. Fukumura, T. Maruse. “Fundamental properties of the gray weighted distance transformation” Trans IEICE Japan, Vol. J60-D(12), pp.1101-1108, 1977.
[18] http://seer.cancer.gov/statfacts/html/brain.html accessed on08-01-2016
[19] http://neurosurgerybasics.com/brain/brain-mri-a-systematic-reading/accessed on 10-01-2016
[20] EashaNoureen, Dr. Md. Kamrul Hassan, “Brain Tumor Detection Using Histogram Thresholding to Get the Threshold point”. Vol. 09(05), pp.14-19, Sep – Oct 2014.
[21] Swathi P S ,DeepaDevassy , Vince Paul ,Sankaranarayanan P N., “Brain Tumor Detection and Classification Using Histogram Thresholding and ANN”. Vol. 06 (01), pp.173-176, 2015.
[22] KanishkaSarkar, ArdhenduMandal and Rakesh Kumar Mandal,” Brain Tumor Detection from T1 Weighted MRI Using Histogram Peak Difference Threshold”, in Proc. of National Conference on Research Trends in Computer Science and Application (NCRTCSA-2015), pp. 32-37, Nov. 07, 2015.
[23] Halder, Amitava, ChandanGiri, and AmiyaHalder. "Brain tumor detection using segmentation based Object labeling algorithm." In Electronics, Communication and Instrumentation (ICECI), 2014 International Conference on. IEEE, pp. 1-4, 2014.
[24] Salah, Mohamed Ben, Idanis Diaz, Russell Greiner, Pierre Boulanger, Bret Hoehn, and Albert Murtha."Fully Automated Brain Tumor Segmentation Using Two MRI Modalities." Advances in Visual Computing, Springer, pp. 30-39, 2013.
[25] Bhattacharjee, Rupsa, and MonishaChakraborty. "Brain tumor detection from MR images: Image processing, slicing and PCA based reconstruction." In Emerging Applications of Information Technology (EAIT), 2012 Third International Conference on, pp. 97-101.IEEE, 2012.
[26] Parisot, Sarah, HuguesDuffau, StéphaneChemouny, and Nikos Paragios."Graph-based detection, segmentation & characterization of brain tumors." In Computer Vision and Pattern Recognition (CVPR), 2012 IEEE Conference on, pp. 988-995, 2012
![Figure 2: Symmetrical structure of the brain[7]](https://thumb-us.123doks.com/thumbv2/123dok_us/9758017.2858361/2.918.277.670.120.349/figure-symmetrical-structure-of-the-brain.webp)