Applications of non-invasive brain-computer interfaces for communication
and affect recognition
by
Md Rakibul Mowla
B.S., Chittagong University of Engineering & Technology, Bangladesh, 2010
AN ABSTRACT OF A DISSERTATION
submitted in partial fulfillment of the
requirements for the degree
DOCTOR OF PHILOSOPHY
Mike Wiegers Department of Electrical and Computer Engineering
Carl R. Ice College of Engineering
KANSAS STATE UNIVERSITY
Manhattan, Kansas
Abstract
Various assistive technologies are available for people with communication disorders.
While these technologies are quite useful for moderate to severe movement impairments,
certain progressive diseases can cause a total locked-in state (TLIS). These conditions
in-clude amyotrophic lateral sclerosis (ALS), neuromuscular disease (NMD), and several other
disorders that can cause impairment between the neural pathways and the muscles. For
people in a locked-in state (LIS), brain-computer interfaces (BCIs) may be the only possible
solution. BCIs could help to restore communication to these people, with the help of external
devices and neural recordings.
The present dissertation investigates the role of latency jitter on BCIs system performance
and, at the same time, the possibility of affect recognition using BCIs. BCIs that can
recognize human affect are referred to as affective brain-computer interfaces (aBCIs). These
aBCIs are a relatively new area of research in affective computing. Estimation of affective
states can improve human-computer interaction as well as improve the care of people with
severe disabilities. The present work used a publicly available dataset as well as a dataset
collected at the Brain and Body Sensing Lab at K-State to assess the effectiveness of EEG
recordings in recognizing affective states.
This work proposed an extended classifier-based latency estimation (CBLE) method using
sparse autoencoders (SAE) to investigate the role of latency jitter on BCI system
perfor-mance. The recent emergence of autoencoders motivated the present work to develop an
SAE based CBLE method. Here, the newly-developed SAE-based CBLE method is applied
to a newly-collected dataset. Results from our data showed a significant (p <0.001) negative
correlation between BCI accuracy and estimated latency jitter. Furthermore, the SAE-based
In the aBCI-related investigation, this work explored the effectiveness of different features
extracted from EEG to identify the affect of a user who was experiencing affective stimuli.
Furthermore, this dissertation reviewed articles that used the Database for Emotion Analysis
Using Physiological Signals (DEAP) (i.e., a publicly available affective database) and found
that a significant number of studies did not consider the presence of the class imbalance in
the dataset. Failing to consider class imbalance creates misleading results. Furthermore,
ignoring class imbalance makes comparing results between studies impossible, since different
datasets will have different class imbalances. Class imbalance also shifts the chance level.
Hence, it is vital to consider class bias while determining if the results are above chance. This
dissertation suggests the use of balanced accuracy as a performance metric and its posterior
Applications of non-invasive brain-computer interfaces for communication
and affect recognition
by
Md Rakibul Mowla
B.S., Chittagong University of Engineering & Technology, Bangladesh, 2010
A DISSERTATION
submitted in partial fulfillment of the
requirements for the degree
DOCTOR OF PHILOSOPHY
Mike Wiegers Department of Electrical and Computer Engineering
Carl R. Ice College of Engineering
KANSAS STATE UNIVERSITY
Manhattan, Kansas
2020
Approved by:
Major Professor David E. Thompson
Copyright
c
Abstract
Various assistive technologies are available for people with communication disorders.
While these technologies are quite useful for moderate to severe movement impairments,
certain progressive diseases can cause a total locked-in state (TLIS). These conditions
in-clude amyotrophic lateral sclerosis (ALS), neuromuscular disease (NMD), and several other
disorders that can cause impairment between the neural pathways and the muscles. For
people in a locked-in state (LIS), brain-computer interfaces (BCIs) may be the only possible
solution. BCIs could help to restore communication to these people, with the help of external
devices and neural recordings.
The present dissertation investigates the role of latency jitter on BCIs system performance
and, at the same time, the possibility of affect recognition using BCIs. BCIs that can
recognize human affect are referred to as affective brain-computer interfaces (aBCIs). These
aBCIs are a relatively new area of research in affective computing. Estimation of affective
states can improve human-computer interaction as well as improve the care of people with
severe disabilities. The present work used a publicly available dataset as well as a dataset
collected at the Brain and Body Sensing Lab at K-State to assess the effectiveness of EEG
recordings in recognizing affective states.
This work proposed an extended classifier-based latency estimation (CBLE) method using
sparse autoencoders (SAE) to investigate the role of latency jitter on BCI system
perfor-mance. The recent emergence of autoencoders motivated the present work to develop an
SAE based CBLE method. Here, the newly-developed SAE-based CBLE method is applied
to a newly-collected dataset. Results from our data showed a significant (p <0.001) negative
correlation between BCI accuracy and estimated latency jitter. Furthermore, the SAE-based
In the aBCI-related investigation, this work explored the effectiveness of different features
extracted from EEG to identify the affect of a user who was experiencing affective stimuli.
Furthermore, this dissertation reviewed articles that used the Database for Emotion Analysis
Using Physiological Signals (DEAP) (i.e., a publicly available affective database) and found
that a significant number of studies did not consider the presence of the class imbalance in
the dataset. Failing to consider class imbalance creates misleading results. Furthermore,
ignoring class imbalance makes comparing results between studies impossible, since different
datasets will have different class imbalances. Class imbalance also shifts the chance level.
Hence, it is vital to consider class bias while determining if the results are above chance. This
dissertation suggests the use of balanced accuracy as a performance metric and its posterior
Table of Contents
List of Figures . . . xii
List of Tables . . . xiv
Acknowledgements . . . xv Dedication . . . xvii Preface . . . xviii 1 Introduction . . . 1 1.1 Fundamentals . . . 1 1.1.1 Electroencephalography (EEG) . . . 1
1.1.2 Brain-Computer Interfaces (BCIs) . . . 3
1.2 Motivation . . . 6
1.2.1 P300 Speller Experiment . . . 7
1.2.2 Affective Computing Experiment . . . 8
1.3 Outline . . . 11
2 Enhancing P300-BCI Performance Using Latency Estimation . . . 12
2.1 Introduction . . . 12
2.2 Experimental Data and Methods . . . 14
2.2.1 Data Description . . . 14
2.2.2 Classifier Basics and Terminology . . . 15
2.2.4 Wavelet Transforms . . . 18 2.2.5 Second-level Classifier . . . 19 2.2.6 Performance Measurement . . . 19 2.3 Results . . . 20 2.4 Discussion . . . 24 2.5 Limitations . . . 27 2.6 Conclusion . . . 27
3 Comparison of Classification Techniques to Predict BCI Accuracy Using CBLE . . 29
3.1 Introduction . . . 30 3.2 Methods . . . 32 3.2.1 Experimental Setup . . . 32 3.2.2 Participants . . . 33 3.2.3 EEG Pre-processing . . . 33 3.2.4 Classification Strategy . . . 34 3.2.5 Performance Evaluation . . . 38 3.3 Results . . . 39
3.3.1 Friedman Test with Post Hoc Analysis . . . 40
3.3.2 Wilcoxon Signed-Ranks Test . . . 41
3.3.3 Effect of Number of Electrodes . . . 41
3.3.4 Effect of Classification method . . . 42
3.3.5 Relation Between BCI Accuracy and P300 Latency Variations . . . . 42
3.3.6 Predicting BCI Accuracy Using CBLE . . . 42
3.4 Discussion . . . 43
3.4.1 Limitations . . . 45
4 Affective Brain-Computer Interfaces: A Tutorial to Choose Performance Measuring
Metric . . . 47
4.1 Introduction . . . 47
4.2 Related Work . . . 50
4.3 Data Description . . . 53
4.3.1 Database for Emotion Analysis Using Physiological Signals (DEAP) . 53 4.3.2 Data collected at Brain and Body Sensing (BBS) lab . . . 53
4.3.3 Pre-processing . . . 54 4.4 Methods . . . 55 4.4.1 Feature Sets . . . 55 4.4.2 Classification . . . 58 4.5 Performance Metrics . . . 60 4.5.1 Balanced Accuracy . . . 60 4.5.2 F1 Measure . . . 63 4.6 Results . . . 64 4.6.1 DEAP Dataset . . . 65
4.6.2 Data from BBS lab . . . 68
4.7 Discussion . . . 69
4.8 Conclusion . . . 71
5 Conclusion and Future Work . . . 73
5.1 Conclusion . . . 73
5.2 Contributions . . . 74
5.2.1 Performance Enhancement of P300 Speller . . . 74
5.2.2 Comparison of Classification Techniques to Predict BCI Accuracy Us-ing CBLE . . . 74
5.2.3 Performance Assessment of Affective BCIs . . . 75
5.3 Limitations . . . 76
5.4 Future Work . . . 76
Bibliography . . . 78
List of Figures
1.1 EEG electrodes placement . . . 2
1.2 Basic diagram of a BCI system . . . 3
1.3 Grand average P300 . . . 5
1.4 Grid matrix of classical P3 speller display . . . 5
1.5 Number of articles on BCIs . . . 6
1.6 Simulated latency jitter . . . 7
1.7 Visualization of the experimental setup for P300 speller. . . 8
1.8 Visualization of the affective BCI experimental setup . . . 10
2.1 classifier scores as function of time shift for a participant with ALS . . . 17
2.2 Averages of classifier scores and wavelet approximation coefficient . . . 19
2.3 Changes in BCI Utility for participants with ALS using the proposed method 21 2.4 Changes in BCI Utility for participants with NMD using the proposed method 22 2.5 Changes in BCI Utility for control participants using the proposed method . 22 2.6 Box plots of the BCI Utility changes for LS, SWLDA and SVM on different sessions. . . 23
2.7 Changes in BCI Utility versus sCBLE (the standard deviation of CBLE-estimated P300 latency from target flashes). . . 24
3.1 A Visual interface of P3 speller experiment . . . 32
3.2 Mean rank based Post hoc . . . 40
3.3 Basic diagram of BCI system . . . 43
4.1 Example of the circumplex model where emotions are expressed in the valence
and arousal dimensions . . . 50
4.2 Average valence and arousal ratings of picture sets used . . . 54
4.3 Average valence, arousal and dominance classification rate for DEAP dataset 65
List of Tables
2.1 Online and offline BCIs accuracy for participants with ALS . . . 20
3.1 Sentences used in the P300 Speller copy spelling mode . . . 33
3.2 Adjusted P-values of pairwise multiple comparisons using Wilcoxon
signed-ranks test . . . 41
4.1 The average classification rate in terms of balanced accuracy and the lower
bound credible intervals of balanced accuracies. . . 66
Acknowledgments
The work presented in this dissertation is the outcome of five years of research, but the
effort and dedication required to reach this stage are immeasurable. During this course of
time, many people have had close interaction with me, without whose support I would not
have pursued a doctoral degree.
I want to take this opportunity to express my deep gratitude to Md. Intekhab Alam,
Homayun Kabir,Dr. Syed Moshfeq Salaken, andDr. Md. Tanvir Hasan for their continuous
support and motivation to start my career as a researcher. I would also like to show my
gratitude to Dr. Siew-Cheok Ng from the University of Malaya, Malaysia, who introduced
me the biomedical signal processing methods and electroencephalography (EEG) data.
My parents, especially my mother and sister, encouraged me in every step of my academic
endeavor. I am thankful to them. My wife, who supported me during the dissertation writing
period, also deserves to be mentioned here.
I feel very fortunate to have Dr. David E. Thompson as my major advisor. I want to
extend my deepest gratitude to him for allowing me to work with him. His support and
mentorship gave me the courage to complete this dissertation. It was always very gratifying
to discuss with him about research and, at the same time, out-of-research topics.
Rachael I. Cano and Katie J. Dhuyvetter ran most of the EEG sessions for the affective
experiment, while Jesus D Gonzalez-Morales, Jacob Rico-Martinez, and Daniel A. Ulichnie
ran most of the EEG sessions for the P3 speller experiment. All of their names deserved to
be mentioned here, without a doubt. My labmate, Dr. Ahmad Suliman, was also a great
support for me here at the BBS lab.
I also want to thank my doctoral committee members, especially Dr. Bala Natarajan
and Dr. Dwight D. Day for their support in the past few years. I am also thankful to the
Mike Wiegers Department of Electrical and Computer Engineering for providing financial
The involvement of human participants with the P3 Speller experiment was approved
by the Kansas State University Institutional Review Board under protocol No. 8320. The
affective BCI research was approved by the Kansas State University Institutional Review
Board under protocol No. 8328.
This material is based upon work supported in part by the National Science Foundation
under Award No. 1910526 and in part by Kansas State University faculty startup funds.
Any opinions, findings, and conclusions or recommendations expressed in this dissertation
Dedication
To my parents for their endless love and encouragement.
To my wife for bearing with me during the writing phase.
Preface
This dissertation is comprised of manuscripts in various stages of submission and
publi-cation except, for the introduction and conclusion chapters. The text and figures in Chapter
2 are re-used with permission, and the permission is documented on the appendix A. Data
used in chapter2were provided by the Direct Brain Interface lab of the University of
Michi-gan led by Dr. Jane Huggins. Data used in chapter 3 & 4 were all collected at the Brain
and Body Sensing lab of Kansas State University.
I have aimed to minimize the recurring and overlapping texts, but some passages have
been used verbatim from the published works. While I made every effort to properly fit these
published and submitted manuscripts with the story of this dissertation some repetition is
Chapter 1
Introduction
The increasing number of research articles on Brain-Computer Interfaces (BCIs) in the past
few years manifests the potential of BCIs both in medical and non-medical applications.
BCI technologies are now moving from the lab into industrial and commercial applications.
However, these technologies are still in the initial stage, and require effort and skill to achieve
accuracy and usability. In this dissertation, an attempt to further improve BCI performance
will be made in two different applications. The first application is BCIs as a communication
tool, and the second is BCIs as an affective measurement tool. In this chapter, a few basic
definitions and terminologies related to BCI, and to this dissertation, are provided. This
chapter also presents the motivation of this dissertation work and an introduction to the
experimental environment.
1.1
Fundamentals
1.1.1
Electroencephalography (EEG)
The first electrical current variations and spontaneous current variations due to visual
stim-ulation in rabbits and monkeys were reported by Caton (1875). Later these findings were
confirmed in other independent studies by Beck and Cybulski (1891) for rabbits and dogs.
EEG.
AF7
Fp1 Fpz Fp2 AF8
AF3 AFz AF4
F7 F5 F3 F1 Fz F2 F4 F6 F8 FT9 FT7 FC5 FC3 FC1 FCz FC2 FC4 FC6 FT8 FT10 T7 C5 C3 C1 Cz C2 C4 C6 T8 TP7 CP5 CP3 CP1 CPz CP2 CP4 CP6 TP8 P7 P5 P3 P1 Pz P2 P4 P6 P8
PO3 POz PO4
PO7 O1 PO10 O2 PO8 PO9
Figure 1.1: This figure shows EEG electrode placement on the scalp used during EEG data recording. The orange-colored circle is used to indicate electrode positions used in Fig. 1.3.
EEG records the electrical activity of large, synchronously firing populations of neuron
using electrodes placed along the scalp (Niedermeyer and da Silva, 2005). EEG has many
applications because of its non-invasive nature. Typically, EEG has a magnitude range of
10−50µV. Electrode placement in the EEG cap usually follows the standard international 10/20 or 10/10 systems, approved by the American Clinical Neurophysiology Society (ACNS;
former American Electroencephalographic Society). The international 10/20 system provides
a method for placing a relatively small number of electrodes (typically 21). An extended
10/20 system and 10/10 system were introduced to facilitate a higher number of electrodes,
and has been accepted as standard by ACNS (Society, 1994). The EEG data used in this
dissertation were recorded using the extended 10/20 electrode placement system. The exact
1.1.2
Brain-Computer Interfaces (BCIs)
BCIs use brain signals to provide a direct method of interaction with computers and other
devices (Wolpaw et al., 2002) without using peripheral nerves and muscles. BCIs are also
sometimes referred to as brain-machine interfaces (BMIs) (Tonet et al., 2008; Lee et al.,
2009; Nicolas-Alonso and Gomez-Gil, 2012) in the literature.
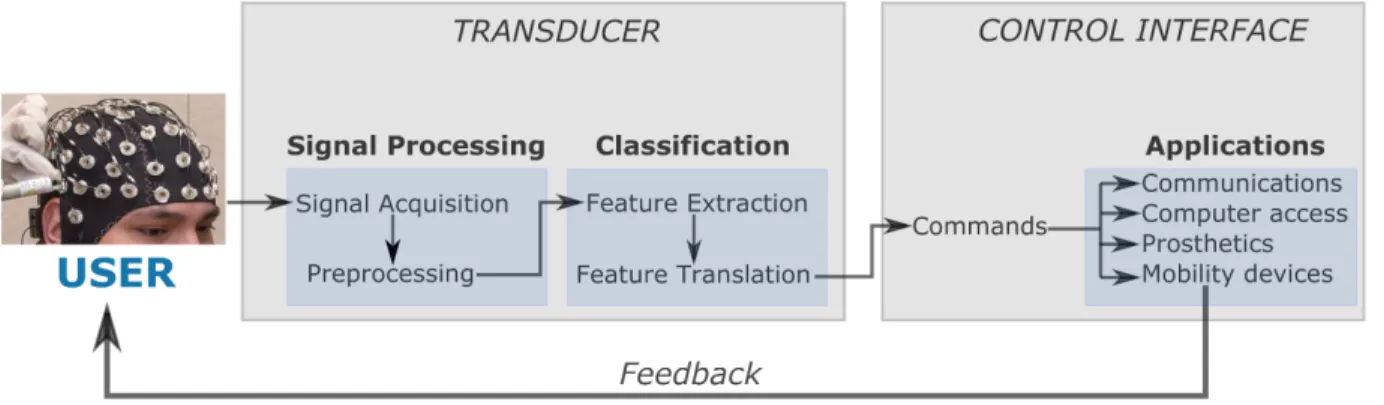
Fig. 1.2shows a general diagram of the BCI system. The first level, called the transducer
(TR) level, includes signal processing and classification. The next level, which converts
transducer output into a control output, is referred to as the control interface (CI) (Dal Seno
et al., 2010; Thompson et al., 2014); for example, in a BCI for spelling, the task of the CI
is to combine the classification outputs from the TR level to find the target character. The
CI may also incorporate other assistive tools such as a word prediction program in the P300
speller BCI (Ryan et al., 2010). A third level, consisting of the human experience of using
the BCI, has been suggested by Thompson et al. (2014).
USER
Signal Acquisition Preprocessing Feature Extraction Feature Translation CONT OL I T RF C Applications Commands Signal Processing ClassificationFigure 1.2: A basic design diagram of a brain-computer interface system. The signals pro-duced by the brain activity are recorded from the scalp using an EEG cap. The signals are preprocessed (e.g., bandpass filtering), and features are extracted (e.g., spectral density, brain rhythms, or raw EEG signals). Classifiers translate these features into certain predefined classes, and the CI uses those classes to translate into commands (e.g., a right-hand mo-tor intent can be translated into “move the cursor right”). At the same time, the CI also sends feedback to the user so that the user can modulate his/her brain activity for better performance.
P300 Event Related Potentials
Event-related potentials (ERPs) are tiny voltage fluctuations in the brain’s electrical activity
in response to specific events (e.g., sensory, motor, or cognitive) or stimuli (Blackwood
and Muir, 1990). BCIs for communication mostly uses a particular type of ERPs that are
commonly known as P300 or P3 ERPs. P300 ERPs are a type of ERPs that are the brain
responses elicited by rare stimuli, with a characteristic positive polarity approximately 300ms
post-stimulus (Fabiani et al.,1987). However, the measured ERPs are mixed with unrelated
brain activity, as well as interference from non-neuronal sources (eye-blinks, eye-movements,
muscle movements) and instrumental noise. These factors lead to the well-known difficulty
in recovering ERPs from single trials. The ERPs are buried under the background EEG
signals (D’Avanzo et al.,2011) and that background EEG has a much larger amplitude than
ERPs.
Therefore, ERPs have a very low signal-to-noise ratio (SNR) and, additionally, may
contain stimulus artifacts caused by the repetitive presentation of visual stimuli (Martens
et al.,2009). Hence, the P300 is hard to identify in single-trials. The most common P3 ERPs
visualization method depends on averaging multiple trials. Averaging helps to obtain the
P300 by suppressing the background EEG signals as the P300 is time-locked to the stimulus
onset (Romero et al.,2015;Nelson and McCleery,2008). Fig. 1.3 shows a typical P300 ERP
at a few electrode locations averaged over 440 target trials.
P300 Speller
One of the most well-known types of BCI is the P300 or the P3 Speller introduced byFarwell
and Donchin (1988), which uses the P300 ERPs.
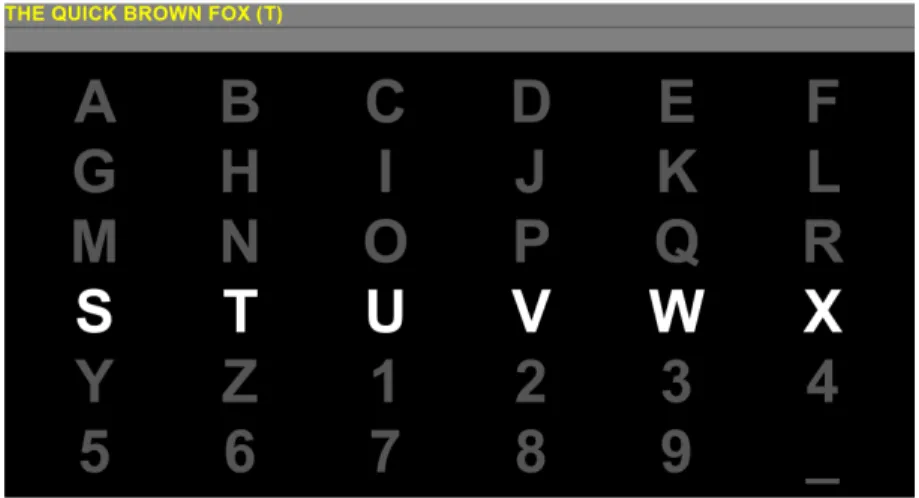
In classical P3 Speller implementations, a grid matrix of 6×6 or more characters and commands are presented to the user. Columns and rows are highlighted/intensified in
ran-dom order while the user focuses on the desired character. The probability of the intensified
row or column containing the target character in one sequence of 12 flashes, six rows, and
0 200 400 600 800 Time(sec) Fpz Fz Cz Pz PO7 PO8 Grand averages of P300 6 V
(a) Grand averages at few electrode locations.
0 200 400 600 800 Time(sec) -4 -3 -2 -1 0 1 2 Amplitude( V)
Mean of Grand averages
Target Non-target
(b) Mean response of grand averages.
Figure 1.3: Example of typical P300 responses at a few selected electrode locations. The selected electrode locations are shown in Fig. 1.1 as orange colored circle. These responses were constructed using the average of 440 target trials.
i.e., a rare event that will elicit a P300 response. A classical P300 speller display matrix
implemented in BCI2000 (Schalk et al., 2004) is shown in Fig. 1.4.
Figure 1.4: 6×6 grid matrix of a classical P3 speller display. This screen capture of a P300 speller display was captured in the BCI2000 environment (Schalk et al., 2004).
1.2
Motivation
BCIs can help to restore communication for people with severe movement impairments such
as amyotrophic lateral sclerosis (ALS), neuromuscular disease (NMD), brainstem stroke,
cerebral palsy, and spinal cord injury (McFarland and Wolpaw, 2011). This kind of
alter-native form of communication would help to improve quality of life and may also reduce
the cost of intensive care (Nicolas-Alonso and Gomez-Gil, 2012). These factors explain the
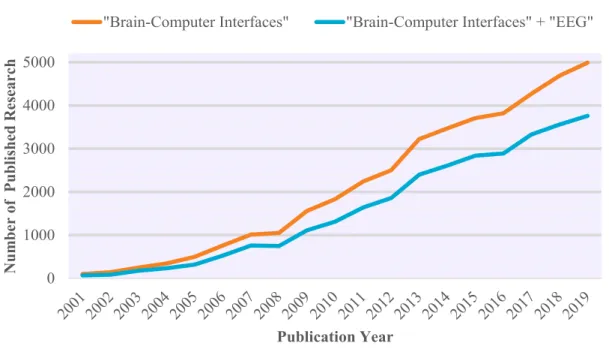
increasing interest in such technologies. Fig. 1.5 shows the growing number of BCI related
research articles from the year 2001 to 2019. The orange line in Fig. 1.5 indicates the
num-ber of BCI related articles while the blue line shows the numnum-ber of EEG-based BCI articles
indexed in Google Scholar.
0 1000 2000 3000 4000 5000 N u m b e r of Pub li s h e d R e s e ar c h Publication Year
Publication trends of BCIs research
"Brain-Computer Interfaces" "Brain-Computer Interfaces" + "EEG"
Figure 1.5: Number of BCIs related publication. The graph shows number of publications from Google Scholar using “Brain-Computer Interfaces” and “Brain-Computer Interfaces” + “EEG” as keywords.
This dissertation will attempt to explore two different applications of BCIs: (i) P3 speller
for communication and (ii) affect (i.e., emotion) recognition. For the P3 speller part, this
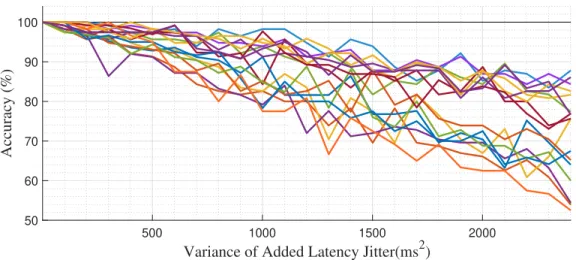
Spelling accuracies are plotted against added normally-distributed P3 latencies (i.e.,
sim-ulated jitters) in Fig. 1.6. More details of this simulated latency work can be found in
Thompson et al. (2019). Fig. 1.6 shows evidence of the relationship between P3 latency
variations and spelling accuracy and thus motivated to further investigate the relationship.
500 1000 1500 2000
Variance of Added Latency Jitter(ms2) 50 60 70 80 90 100 Accuracy (%)
Figure 1.6: Normally-distributed added latency jitter versus P3 spelling accuracy.
1.2.1
P300 Speller Experiment
The P300 Speller (Farwell and Donchin, 1988) is one of the prevalent applications of BCIs,
and can serve as a communication tool for patients with the diseases as mentioned earlier
(Sellers and Donchin, 2006). Due to the very low SNR of P300 ERPs, a common technique
of extracting P300 ERPs is based on signal averaging. However, the ERPs can vary in terms
of latency and amplitude due to mental fatigue, stress, attention, and several other medical
conditions (Boksem et al.,2005;Mowla et al.,2018a). In some cases averaging may be useful,
but the averaging does not allow us to do single-trial analysis. Research has shown that P300
latency variability is strongly related to the cognitive function and provides a measure of
cognitive health (Polich and Herbst, 2000). Hence, averaging causes the loss of important
information related to P300 variability.
In this dissertation, the goal of the P300 speller experiment is to develop and validate a
Single-trial estimation of the P300 will help to understand the underlying cognitive
pro-cess of ERPs and also to improve the speed of BCI systems. In this experiment, data were
collected while participants performed the copy-spelling task using BCI2000’s (Schalk et al.,
2004) row-column P300 speller paradigm. Each participant completed nine copy-spelling
tasks in three sessions on different days. In each session, participants copy-spelled three
sen-tences. Chapter3consists of further details on this experiment, including the sentences used
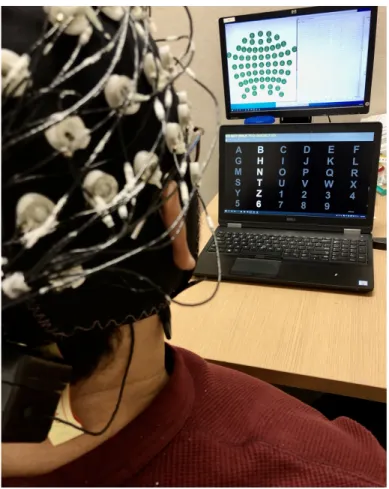
and participants’ demographics. Fig. 1.7 shows a participant performing the copy-spelling
task of the P3 experiment.
Figure 1.7: Visualization of the experimental setup for P300 speller.
1.2.2
Affective Computing Experiment
Understanding the human mind is a capability people would like to have, and is an active
processes are interrelated with a complex network (Schwarz,2000). Hence affective state has
an essential role in human decision making process (Forgas, 1995). The ability to manage
affective states is related to the skills of logical reasoning, learning, and extracting critical
information (Salovey and Mayer,1990). However, to achieve the ability to manage affective
states requires an understanding of affective responses.
The first question that needs to be answered is “how can we understand affective
re-sponses?” The answer to this question is not straightforward, because affect involves several
internal and external processes of the human body and organs. Rather, it is easier to answer
a question like, “what are the physiological indicators that can be used to detect affective
states?” Numerous studies have attempted to answer this question because it was a major
topic of interest for affective computing researchers (Cacioppo and Tassinary, 1990).
Sev-eral indicators can be used for affect recognition, such as pupil diameter (Oliva and Anikin,
2018), heart rate variability (Quintana et al., 2012), skin conductance (Nakasone et al.,
2005), temperature (Levenson et al., 1992), voice tone (Petrushin, 1999), muscle tension,
facial expressions (Pantic and Rothkrantz, 2000) and many others. But these indicators
will fail to recognize true affect if someone can disguise his or her emotions (Picard et al.,
2001). Hence, estimation of affective states is a challenging task and requires other sources
of physiological signals which are hard to alter.
The obvious choice is neural signals, because the brain is the center of processing all these
emotions and feelings. Specifically, the thalamus, hypothalamus, hippocampus, cingulate
cortex, and the amygdala are considered to be responsible for emotion processing (Dalgleish,
2004). Hence, it should be possible to detect affect from neurophysiological signals. Systems
that do this are named affective brain-computer interfaces (aBCIs) (M¨uhl et al.,2014). These
aBCIs can be based on invasive or non-invasive technologies. However, to estimate affective
state, one might not choose to implant electrodes on his or her brain. Thankfully, with
the advent of few completely non-invasive brain imaging techniques, it became possible to
record brain signals without any surgical procedure. The available methods are magnetic
resonance imaging (fMRI), positron emission tomography (PET), electroencephalography
spatial resolution but low temporal resolution because of their dependence on metabolic
changes. On the other hand, EEG and MEG have a high temporal resolution but low spatial
resolution.
EEG-based systems are preferable for multiple reasons. The first is the unobtrusive
nature of the EEG based systems. Second, the ability to be recorded using wearable devices
which makes the system mobile. Finally, EEG acquisition systems are cheaper and less
complicated than other techniques (M¨uhl et al., 2015). Because of these advantages, EEG
based systems are a practical choice for aBCIs. The next task, before using aBCIs for
detecting affect is to express different affective states on a measurable scale. For this purpose,
Russell (1980) proposed an emotional state model known as the circumplex model based on
the dimensions of valence and arousal dimension.
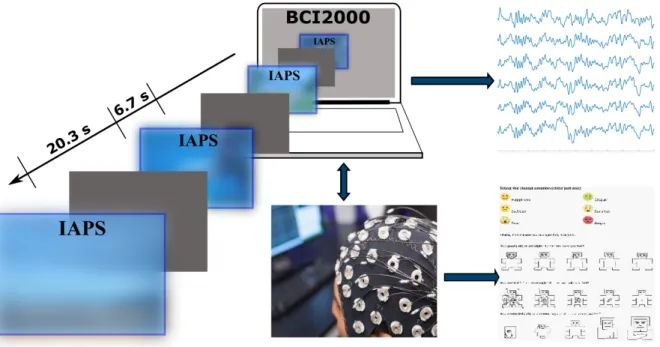
Figure 1.8: Visualization of the experimental setup for affective computing.
In the affective computing experiment, a set of visual stimuli was presented to the
partic-ipants and simultaneously EEG data was recorded. This experiment used the international
affective picture system (IAPS) (Lang et al.,2008) images as the stimuli. For the interfacing
sub-jects. Each picture was displayed for 6.7 seconds and a blank display followed for 20 more
seconds for participants’ self report on a printed self-assessment manikins (SAM) (Bradley
and Lang, 1994) for each stimulus to rate them in valence, arousal, and dominance on a
discrete 5-point scale. Fig. 1.8 shows a simplified flow diagram of the experimental setup.
1.3
Outline
The first goal of this dissertation was to investigate the relationship of the P3 latency
vari-ations with BCI performance and utilize that relvari-ationship to improve BCI performance. A
method using classifier-Based Latency Estimation (CBLE) and wavelet transform to enhance
the P3 speller performance is introduced in Chapter2to accomplish the first goal. Further, a
state-of-art classification technique using sparse autoencoders (SAE) is used and compared
with least squares (LS) and step-wise linear discriminant analysis (SWLDA) methods for
CBLE. The comparison is presented in Chapter 3. The second goal of this dissertation
was to explore the potentials of the BCIs system to recognize emotion. Chapter 4 explores
the usability of BCIs in the area of affective computing and emotion recognition. Finally,
Chapter 5 includes the concluding remarks, future directions based on the presented work,
Chapter 2
Enhancing P300-BCI Performance
Using Latency Estimation
Copyright notice: The following text is reformatted from “Enhancing P300-BCI performance
using latency estimation.” as published in Brain-Computer Interfaces. The text appear here
with permission from Taylor & Francis, who owns all copyright to the work. The final and
published version of this chapter can be found in (Mowla et al., 2017).
In this chapter, the Classifier-Based Latency Estimation (CBLE) and wavelet transform
was used to enhance the P3 speller performance. The CBLE method uses a classifier to
estimate the latency variance. Hence a second-level classifier was used to classify the target
characters. Least squares (LS), step-wise linear discriminant analysis (SWLDA), and support
vector machine (SVM) classifiers were used in this chapter as the second-level classifier.
2.1
Introduction
Brain-Computer Interfaces (BCIs) use brain signals to provide a direct method of
interac-tion with computers and other devices (Wolpaw et al., 2002). BCIs can help to restore
communication for people with severe movement impairments such as amyotrophic lateral
cord injury (McFarland and Wolpaw, 2011). One of the most common BCI applications is
the P300 or P3 Speller indroduced by Farwell and Donchin (Farwell and Donchin, 1988),
which uses event-related potentials (ERPs), including the P300 – a positive deflection
ap-proximately 300ms post-stimulus. In classical P3 Speller implementations, a grid matrix of
6×6 or more characters and commands are presented to the user. Subsets of the matrix,
usually rows and columns, are flashed in a random order (c.f. (Townsend et al.,2010)). The
probability of the flashed row/column containing the target character is 1/6, which creates
a rare event that will elicit a P300 response. A classifier can detect those elicited P300
responses and identify target characters (Fabiani et al., 1987). With a few exceptions (e.g.
(Kindermans et al., 2014a,b)), classifiers must be trained on data from each participant, as
all event-related potentials (ERPs) including the P300 are participant-specific.
Researchers have tried different feature extraction and classification methods for the P3
Speller in search of better performance (see e.g. (Krusienski et al., 2006)). Early research
used step-wise linear discriminant analysis (SWLDA) and showed that SWLDA performed
well as a P3 Speller classifier (Sellers and Donchin, 2006; Donchin et al., 2000; Krusienski
et al., 2008). For the 2003 BCI competition data, support vector machines (SVM) (Kaper
et al., 2004; Rakotomamonjy and Guigue, 2008) outperformed other classifiers, though the
performance was dependent on proper tuning parameters. Other recent works used Bayesian
Linear Discriminant Analysis (BLDA) and Fisher’s Linear Discriminant Analysis (FLDA)
(Hoffmann et al., 2008) and Convolutional Neural Network (CNN) (Cecotti and Graser,
2011) for classification. All these above-mentioned works reported some improvement on
performance compared with prior studies.
Early research on the P300 found that P300 latency and reaction time varies between
people (McCarthy and Donchin, 1981; Kutas et al., 1977). Magliero found that the latency
of the P300 depends on the stimulus evaluation process (Magliero et al., 1984). These and
other studies have shown that P300 latency varies, and that this variation is related to
age, cognitive disabilities and other factors (Picton, 1992; Polich, 2007). Latency varies
within-user, within the same session (Fjell et al., 2009; Thompson et al., 2012) and even
and BCI speed (Polich and Herbst, 2000). Though P300 latency is an important factor
for the P3 Speller, only a few very recent studies have attempted to explicitly calculate or
correct for P300 latency. Researchers used Bayesian methods (D’Avanzo et al., 2011) and
spatiotemporal filtering methods (Li et al.,2009) to estimate properties of single-trial
event-related potentials (ERPs), including latency estimates. But, surprisingly only one study has
been found in the literature which attempted to correct latency jitter (Walhovd et al.,2008),
using a maximum-likelihood estimation (MLE) method. In Thompson et al. (2012), we
proposed a classifier-based latency estimation (CBLE) method to estimate the P300 latency.
In that work, the latency estimates were primarily used to predict BCI performance from
small datasets.
In this study, we used a wavelet transform of the CBLE scores as input features to another
classifier, improving overall BCI performance. As for the CBLE method it relies upon, this
new technique should be helpful regardless of the classifier used. The new technique should
dynamically account for latency variation on a per-flash basis, unlike previous work such as
Iturrate et al. (2014), which showed improved BCI performance from a static correction for
the average latency in different tasks.
2.2
Experimental Data and Methods
2.2.1
Data Description
An earlier study by Thompson et al. (2012) demonstrated a classifier-based latency
esti-mation technique to estimate and predict BCI accuracy from small datasets, which will be
discussed later in section 2.2.3. Some of the data used here were previously reported in
(Thompson et al., 2012, 2009), and all other data were taken using the same protocol. This
protocol involved three separate visits (sessions) for each participant. There are three data
files per session, with an additional training file in the first session. This study includes data
from all files from sessions one, two and three. Results are shown separately for the average
participants included 9 people with ALS, 4 people with NMD, and 20 control participants
with no motor impairments. Only people who completed the study are included.
EEG data were collected using a 16-electrode cap from ElectroCap International, with
mastoid reference and ground. The electrodes were fixed in the cap at F3, Fz, F4, T7, T8,
C3, Cz, C4, Cp3, Cp4, P3, Pz, P4, PO7, PO8, and Oz according to the 10-20 electrode
place-ment system. The data were amplified and digitized at 256 Hz using a g.USBamp (Guger
Technologies). Stimulus presentation and recording was controlled through the BCI2000
software platform.
Online classification was performed using least squares (LS). The training file was used to
create a participant-specific classifier that was used in all three sessions. A heuristic based
on training accuracy was used to set the number of times each row and column flashed
(sequences). Each data file contains at least 23 characters of BCI typing; users corrected
mistakes using a backspace selection within the BCI, so the number of characters varies
between files. For additional details, see Thompson et al. (2012).
2.2.2
Classifier Basics and Terminology
Perhaps because classifiers and machine learning techniques have broad application domains,
their terminology is not yet perfectly standardized. In this work, we will be discussing three
classifiers - Least Squares (LS), Step-Wise Linear Discriminant Analysis (SWLDA), and
Sup-port Vector Machine (SVM). The earlier CBLE work (Thompson et al.,2012) demonstrated
better performance on the dataset used here using LS classification method. A comparison
study (Krusienski et al., 2006) showed that SWLDA provides the best overall performance
characteristics for practical P300 Speller classification. Another related study showed that
the linear SVM classifier performed better in identifying P300 ERPs compared to Fisher
linear discriminant analysis (FLDA) (Combaz et al., 2012). Hence this study will examine
these three (LS, SWLDA, Linear-SVMs) classification methods as the second-level classifier.
Each method is a linear classifier, meaning that it works by taking a weighted sum of the
“observation” or measurement, in our case once per “flash.” In typical binary classification
tasks, the sign function is applied to the score for each observation, in order to estimate the
class “label” - whether the observation in question belongs to the positive or negative class.
The classifiers we use differ primarily in how the weights (which then are used to calculate
the score) are chosen. The score, ˆy, is calculated using the following equations (Murphy,
2012) : LS: yˆ(x) =XWˆ LS where,X = 1 x and ˆWLS = (XTX)−1XTy (2.1) LDA: yˆ(x) = wT(x−x0) where, w= P−1 (µ1−µ0) and x0 = 1 2(µ1 +µ0)−(µ1−µ0) log(π1/π0) (µ1−µ0)T P−1 (µ1−µ0) π is the prior probability of membership in each class
(2.2)
SVM: yˆ(x) = ˆw0+ N X
i=1
αik(xi,x) Where, αi =λiyi, λ is the `1 regularization term. (2.3)
P3 Spellers are unusual among binary classification tasks, because each row and column
is flashed multiple times while the user is trying to produce a single output character. The
sign function is therefore not used, and instead the scores (ˆy) for the multiple observations
of each row and column are averaged. Then the maximum-scoring row and column are
chosen. Note that as these three classifiers are all linear (we used a linear kernel for the
SVM), this process is equivalent to averaging the features from multiple observations prior
to classification.
2.2.3
CBLE
Traditional P300 classification uses a single time window locked to the stimulus presentation,
-100 -50 0 50 100 Time(ms) -15 -10 -5 0 5 10 15 20
Classifier Score (Unitless)
Classifier scores: Target
(a) Target characters.
-100 -50 0 50 100 Time(ms) -15 -10 -5 0 5 10 15 20
Classifier Score (Unitless)
Classifier scores: Non-Target
(b) Non-target characters.
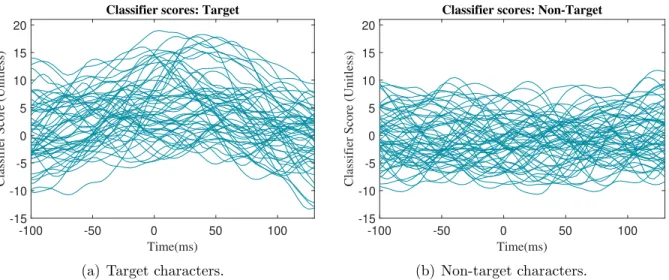
Figure 2.1: Sample classifier scores as function of time shift of participant K143 (participant with ALS).
based latency estimation (CBLE) creates many copies of that time window, each offset by
an integral number of amplifier samples; for example, if the sampling rate was 1kHz, one
window might be -1 to 799 ms, and another 1 to 801 ms. The “first-level classifier” (here,
LS) is applied to the data in each window, producing a score as described above. Thus, the
method produces a vector of scores, with one element per time shift used.
In Thompson et al. (2012), the time shift that produced the maximum score was used
as an estimate for the latency difference between the new P300 response and the average
P300 response from training data. The variance of that latency difference estimate on target
characters was used to predict BCI performance. The vector of scores was not used directly,
although we did note that there are strong differences in the shape of the scores for target
and non-target characters. In this work, by contrast, we wanted to use the full vector of
scores directly, to aid in detection of the P300 response.
Fig. 2.1 shows the CBLE scores as a function of time shift from a participant with ALS,
for several representative flashes. Fig. 2.2(a) shows the average across all flashes, which
reflects the overall shape of the responses to target flashes. The CBLE scores from most
target flashes show a peak near 0 time shift; different flashes produce different peak times.
classifier performance. For non-target characters there are no visible peaks which is also
expected behavior in this paradigm. A few naive approaches were to (i) align all the
single-trials based on CBLE and use the aligned single-trials to train a second-level classifier, (ii) use the
CBLE outputs along with the non-aligned trials as extra features for a second-level classifier
and (iii) use the CBLE scores alone to train a second-level classifier. We tested each of
these approaches on pilot data and found the third approach more useful than the others.
However, latency jitter is still visible in the fact that the CBLE scores peak at non-zero
time shift; we wanted to reduce the number of features for the end classifier and also reduce
the latency jitter. Given the characteristic shape of the CBLE scores for target flashes, we
thought a frequency domain transform such as wavelets would be valuable.
2.2.4
Wavelet Transforms
Wavelet transforms are generally used for decomposing signals into multiple time-frequency
domains. However, they also can be used for feature reduction. We accomplished both
purposes by computing the wavelet approximation coefficients of CBLE scores. For a signal
with N −1 samples, x(t) = {x(1), . . . , x(N −1)}, the approximation coefficients can be calculated from equation 2.4 (Chun-Lin, 2010):
Wφ[j0, k] = 1 √ N X n x(n)Φj0,k(n) (2.4)
There are many wavelet families; we applied different mother wavelet transformations on
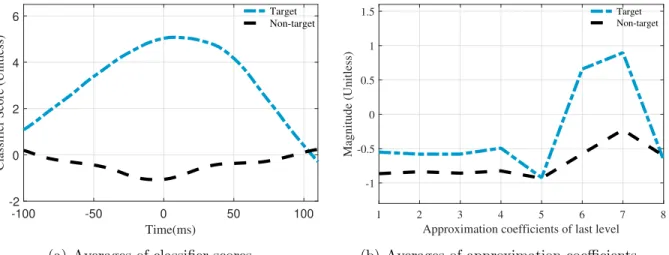
session 1 data for several participants, and that found the Daubechies-4 mother wavelet,
particularly the 5 level wavelet decomposition, produced good results while significantly
reducing the number of features. To find the approximation coefficients of last level we
used MATLAB defaultappcoef.mfuction. Fig. 2.2(b) shows the averages of approximation
-100 -50 0 50 100 Time(ms) -2 0 2 4 6
Classifier Score (Unitless)
Target Non-target
(a) Averages of classifier scores.
1 2 3 4 5 6 7 8
Approximation coefficients of last level
-1 -0.5 0 0.5 1 1.5 Magnitude (Unitless) Target Non-target
(b) Averages of approximation coefficients.
Figure 2.2: Averages of classifier scores which are shown in Fig. 2.1(a) & Fig. 2.1(b) and wavelet approximation coefficient for target and non-target characters.
2.2.5
Second-level Classifier
Wavelets reduced the dimensionality of the CBLE scores while still showing a difference
between target and non-target characters, but a classifier is still needed to make decisions
based on the wavelet coefficients. We investigated three classifiers (LS, SWLDA, and SVM)
as “second-level” classifiers, which were given only the wavelet coefficients as input features.
The scores from these second-level classifiers were used in the typical P3 Speller fashion - each
flash was scored by the second-level classifier, and the scores for each row and column were
averaged individually. The row and column with the highest average score was designated
as the selected output character. Both first- and second-level classifiers were trained using
only the training data file.
2.2.6
Performance Measurement
Because the goal of this work is improving communication accuracy and speed, a performance
metric capturing throughput was chosen. Although Information Transfer Rate is often used
for the P3 Speller, we have chosen BCI utility (Dal Seno et al., 2010), in line with the
suggestions in (Thompson et al.,2014,2013). BCI utility (U) is calculated using the formula
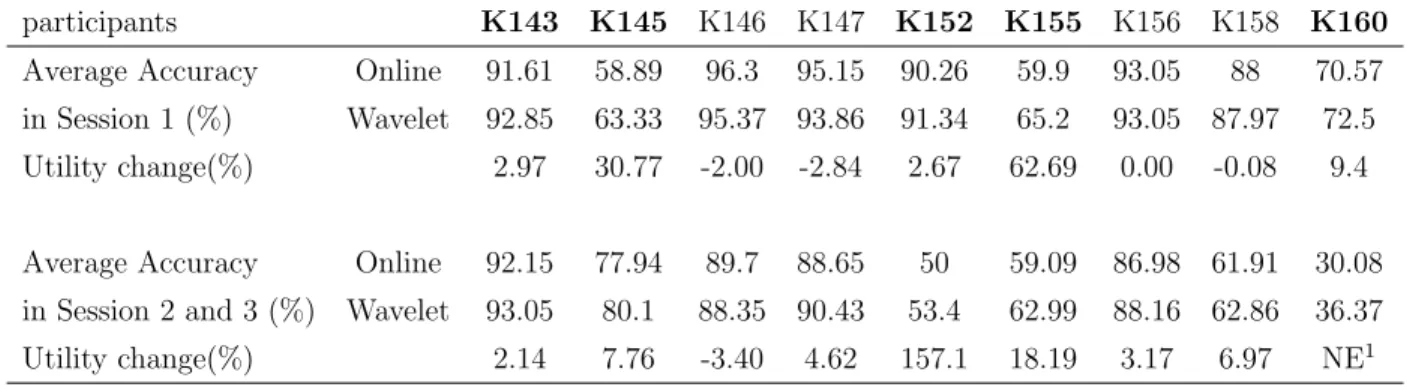
Table 2.1: Performance in different sessions for participants with ALS. Bolded participants show consistent improvement.
participants K143 K145 K146 K147 K152 K155 K156 K158 K160
Average Accuracy Online 91.61 58.89 96.3 95.15 90.26 59.9 93.05 88 70.57
in Session 1 (%) Wavelet 92.85 63.33 95.37 93.86 91.34 65.2 93.05 87.97 72.5
Utility change(%) 2.97 30.77 -2.00 -2.84 2.67 62.69 0.00 -0.08 9.4
Average Accuracy Online 92.15 77.94 89.7 88.65 50 59.09 86.98 61.91 30.08
in Session 2 and 3 (%) Wavelet 93.05 80.1 88.35 90.43 53.4 62.99 88.16 62.86 36.37
Utility change(%) 2.14 7.76 -3.40 4.62 157.1 18.19 3.17 6.97 NE1
1 NE: Utility does not exists.
U = 2p−1
c , this is only valid for (2p−1)>0, i.e, p > 0.5 (2.5)
where c is the time per selection, and p is the probability of correctly selecting a symbol
or character in the interface. We calculated this probability by assuming it was constant for
all characters and within the duration of each file. Backspaces, if required to produce correct
text, were counted as correct selections for calculating accuracy. These accuracies were then
averaged together if multiple files were used (as an example, if we report average session 1
accuracy).
BCI utility (U) is a useful metric in that it correctly calculates the rate of corrected
characters per unit time. In other words, BCI utility (U) is a measure of “corrected typing
speed,” or how quickly a person can produce corrected text.
2.3
Results
Table 2.1 shows the online accuracies and accuracies after the proposed method for a subset
of participants to demonstrate how BCI Utility changes with the change of accuracies. For
readability, we limited the table to only participants with ALS as they come from a potential
end-user population. Bolded participant identifiers indicate consistent improvement across
50 60 70 80 90 100 Original Accuracy (%) 0 50 100 150
Changes in BCI Utility (%)
Session 1: ALS Participants
K143 K145 K152 K155 K160 (a) 50 60 70 80 90 100 Original Accuracy (%) 0 50 100 150
Changes in BCI Utility (%)
Session 2 & 3: ALS Participants
K143 K145 K147 K152 K155 K156 K158 (b)
Figure 2.3: Changes in BCI Utility for participants with ALS versus online test accuracy in different sessions. Upper-triangle and lower-triangle indicates the BCI Utility increased and decreased, respectively. The diamond indicates no change. Participant IDs are shown only for improved performance, to allow the reader to assess consistency of improvement. below 90%.
Fig. 2.3 shows the improvement of BCI Utility for participants with amyotrophic lateral
sclerosis (ALS) after using the proposed technique. The technique shows greater
improve-ment for participants with lower online accuracy. Improveimprove-ment of performance is also
con-sistent in other sessions as shown in Fig. 2.3(b). Note participant K160 is not plotted in
Fig. 2.3(b) despite the improvement shown in Table 2.1 because this participant’s online
utility was zero and the percentage change become mathematically undefined. Mean change
in BCI Utility in session 1 is 11.5% and in session 2 and 3 is 24.57%.
Fig. 2.4 shows the improvement for participants with neuromuscular disease (NMD).
Again, larger benefit is shown for individuals with lower online accuracy. In session 2 and 3,
the performance improved for all four participants, but are larger in value for lower online
accuracies. Mean BCI Utility change for session 1 is 16.35% and for session 2 and 3 is 32.29%.
Fig. 2.5 shows the effect of the proposed technique on 21 control participants. Unlike
participants with ALS and NMD, there is no obvious pattern. Mean BCI Utility change in
session 1 is 2.03% and in session 2 and 3 is 16.59%.
30 40 50 60 70 80 90 100 Original Accuracy (%) 0 20 40 60 80 100
Changes in BCI Utility (%)
Session 1: NMD Participants K185 K190 K223 (a) 30 40 50 60 70 80 90 100 Original Accuracy (%) 0 20 40 60 80 100
Changes in BCI Utility (%)
Session 2 & 3: NMD Participants
K185 K190
K191
K223
(b)
Figure 2.4: Changes in BCI Utility for participants with NMD versus online test accuracy in different sessions. Upper-triangle and lower-triangle indicates the BCI Utility increased and decreased, respectively. Participant IDs are shown only for improved performance, to allow the reader to assess consistency of improvement.
60 70 80 90 100 Original Accuracy (%) -5 0 5 10 15 20
Changes in BCI Utility (%)
Session 1: Control Participants
K108 K111 K114 K119 K121 K166 K171 K172 K177 K178 K107 K113 K120 K179 K115 K117 K123 K183 (a) 60 70 80 90 100 Original Accuracy (%) -5 0 5 10 15 20
Changes in BCI Utility (%)
Session 2 & 3: Control Participants
K108 K111 K114 K115 K119 K121 K166 K171 K177 K178 K183 K113 K117 K120 K123 K172 (b)
Figure 2.5: Changes in BCI Utility for control participants versus online test accuracy in different sessions. Upper-triangle and lower-triangle indicates the BCI Utility increased and decreased, respectively. Diamonds indicate unchanged performance. Participant IDs are shown only for improved performance, to allow the reader to assess consistency of improve-ment.
LS SWLDA SVM -10 0 10 20 30 40 50
Changes in BCI Utility (%)
Session1: All Participants
(a) LS SWLDA SVM -10 0 10 20 30 40 50
Changes in BCI Utility (%)
Session 2 & 3: All Participants
(b)
Figure 2.6: Box plots of the BCI Utility changes for LS, SWLDA and SVM on different sessions.
performance with the new method, with a mean of 13% increase in BCI Utility. Nine
participants showed decreased performance, with a mean decrease of -2.89% in BCI Utility.
Five participants had no change in performance. Among these five, one participant had very
low online accuracy and the other four had online accuracies around 98%. Overall mean
change in BCI Utility for session 1 for all participants is 6.5%.
In session 2 and 3, two participants (K118, K160) had original accuracies of 32% and
30%. While their accuracy improved by 2 and 6 percentage points, neither showed
non-zero BCI Utility with or without the new method. Twenty-three additional participants
showed increased performance, with mean BCI Utility changes of 27.5%. Seven participants’
performance worsened with a mean of -1.6% utility change. Overall mean of utility changes
in session 2 and 3 is 20.75%.
We have also compared the performance of LS, SWLDA and SVM binary classifiers as the
second-level classifier. The results are shown in Fig. 2.6. In session 1, both LS and SWLDA
classifiers have median change above 0, and first quartile at or very near 0, indicating that
approximately 75% of the subjects experienced improvement or at least no decrease. For
SVM on session 1, the median is nearer to zero but the quartile is below zero. On session 2
and 3, the box plots are more similar between classifiers.
CBLE-20 30 40 50 60 70 80 sCBLE(ms) -100 -50 0 50 100 150 200 250 300
Changes in BCI Utility (%)
All session: All subjects
Figure 2.7: Changes in BCI Utility versus sCBLE (the standard deviation of CBLE-estimated P300 latency from target flashes).
estimated latency for all 288 files. The Fig. demonstrates that the changes in performance
are located at areas with higher estimated latency jitter.
Here, we have reported data for 32 participants overall. Modeling performance change
as a binomial random variable with ”success” being increased performance, the maximum
likelihood estimate (MLE) of increased performance probability is 0.67 with 95%
confi-dence interval of [0.54 0.78]. This can be interpreted as the technique being more likely
to help than do nothing or decrease performance. Using the two-sided p-value gives us
p2 = P64
s=43Bin(s|64,0.5) + P21
s=0Bin(s|64,0.5) = 0.0081<0.01.
If we define success more generously, as improving or at least not changing performance,
the MLE is 0.75 with 95% confidence interval of [0.63 0.85]. Two-sided p-value in this case
is given by p2 = P64 s=48Bin(s|64,0.5) + P16 s=0Bin(s|64,0.5) = 0.000077<0.001.
2.4
Discussion
From previous studies, it is obvious that P300 latency varies between individuals, between
individual and session (McCarthy and Donchin, 1981; Kutas et al., 1977; Fjell et al., 2009;
Thompson et al., 2012; Blankertz et al., 2011). The effect of latency variations between
individuals can be compensated by using subject-specific classification, and training on the
same day can address some of the between-session variations. But trial-to-trial variations in
latency make the classification task difficult and also affect BCI performance. This motivated
us to find a technique to correct latency variation and thus minimize the effect of latency
jitter on performance. Previously, the classifier-based latency estimation (CBLE) method
has been used to predict BCI performance (Thompson et al.,2012). Here, CBLE-estimated
latency has been used to improve BCI performance.
At the beginning of the investigation, we used CBLE-estimated latency to “correct” for
latency jitter on a trial-by-trial basis, and used the corrected trials as the “second-level”
classifier’s features. However, the improvement in performance was not significant enough
to merit reporting - without knowledge of the class labels, correcting for latency had the
unfortunate effect of maximizing the classifier score for examples that did not contain P300’s,
leading in many cases to less separable score distributions. Further investigations using
feature reduction techniques, such as wavelet transforms, provided better results. We found
that wavelet approximation coefficients of CBLE scores are also different for target and
non-target characters (Fig. 2.2(b)). That findings motivated us to use wavelet approximation
coefficients as features for our “second-level” classifier. For that “second-level” classifier,
we have compared LS, SWLDA and SVM. Though the performance for all three classifiers
was almost equal, it is notable that a comparitively simple classification technique, LS, was
found to be equally or more effective than SWLDA and SVM. This provides an insight that
using better feature transformation methods may give better results even while using simple
classification techniques.
The proposed technique appears to be helpful only for participants with lower accuracies
and higher estimated latency jitter, which are strongly correlated (Thompson et al., 2012).
The largest improvements were found among participants with ALS and NMD. Part of this is
because the BCI Utility metric highlights the importance of relatively small absolute changes
of accuracy of 4.4%, resulting in a 30.76% improvement in BCI Utility. However, BCI Utility
is measuring the capability of a person to produce corrected text - in other words, it is an
ecologically valid measure of communication throughput. While the accuracy changes are
small, for users who struggle with the BCI (accuracies in the 50-70% range), even small
changes can show large improvements in usability.
The two-sided p-value we have found demonstrates that the proposed technique
statisti-cally improves BCI performance. It should be noted that for some subjects, the performance
was already good enough that there was no need or room for improvement in accuracy. In
this case, it is desirable that our performance improvement technique would not decrease
performance for these individuals. Hence, we have also computed the two-sided p-value for
the performance improving or at least not changing the performance. That p-value was
also statistically significant and demonstrates that this method is more likely to help or do
nothing than to hurt performance.
While the improvements here are not large in magnitude (and not the orders of
magni-tude of improvement that are necessary to restore natural speech, for example), it is notable
that the improvements are much larger in our pool of participants from potential user
pop-ulations. The method does not completely compensate for the effects of latency jitter found
in (Thompson et al., 2012), and significant improvement is still required beyond this work
to bring all users to equal performance.
We believe the power of this method lies in its ability to correct for latency variation. Our
previous work has shown that latency variation as measured by CBLE is strongly inversely
correlated to BCI performance (Thompson et al., 2012). This has a compounding effect for
individuals with high online accuracies. If the online accuracy was near 100%, not only is
there little room for improvement in an absolute sense, but the participant almost certainly
demonstrated little latency variation. Since this method provides improvement by removing
latency variation, these individuals will see little benefit from this method. However, it
should be noted that target populations for BCI often experience lower performance than
controls, so this is not a critical weakness of this method.
without CBLE. This is in contrast with (Krusienski et al., 2006), and may be due to the
fact that the number of stimulus presentations for each participant was chosen based on LS
performance.
2.5
Limitations
CBLE itself has been demonstrated to be at least partially classifier independent (Thompson
et al., 2012). Therefore, it is possible that this boosting method could be applied with other
first-level classifiers being used to estimate the latency. However, we have not tested this
claim here. We did use a SWLDA-based CBLE with this approach, but the results were not
different enough to merit inclusion.
This is an offline analysis of existing data, and the method is not yet ready for online
implementation.
2.6
Conclusion
This work demonstrates an improvement in information throughput using a technique that
can be used with many classifiers, including the relatively simple LS classifier used here.
Interestingly, the improvement is the largest for participants with marginal accuracies, those
for whom the typical techniques produced some communication but not ideal performance.
This suggests that the technique helps to offset, but does not eliminate, the negative effect
of latency jitter on classification. Further work on removing latency jitter should continue
providing improved performance for individuals for whom current-generation BCIs do not
perform well.
Acknowledgement
The authors would like to thank all individuals involved in early stages of this investigation,
Funding
This work was supported in part by the National Institute of Child Health and Human
Development (NICHD), the National Institutes of Health (NIH) under grant R21HD054697
and by the National Institute on Disability and Rehabilitation Research (NIDRR) in the
Department of Education under grant H133G090005. The opinions and conclusions are
Chapter 3
Comparison of Classification
Techniques to Predict BCI Accuracy
Using CBLE
Copyright notice: The following text is reformatted from “A Comparison of Classification
Techniques to Predict BCI Accuracy Using Classifier-Based Latency Estimation.” as
sub-mitted for publication (Mowla et al.,2020a).
In this chapter, an extended CBLE method using sparse autoencoders (SAE) is proposed
and compared with LS- and SWLDA-based CBLE. The objective of this study is to
com-pare different classification techniques to predict BCI accuracy using the variance of CBLE
estimates. Here, the newly-developed SAE-based CBLE and previously used methods are
applied to a newly-collected dataset. Results showed a significant (p <0.001) negative
cor-relation between BCI accuracy and estimated latency jitter. This study showed that whole
CBLE worked regardless of the method and electrode count; the effect of the number of
3.1
Introduction
Brain-computer interfaces (BCIs) are an alternative communication technology for people
with severe neuromuscular disorders such as amyotrophic lateral sclerosis, cerebral palsy,
stroke, or spinal cord injury. BCIs are defined as systems that record brain signals, interpret
and translate those signals into an output device to perform user-desired actions (Shih et al.,
2012). One type of BCI is the P300 speller, first introduced by Farwell and Donchin (Farwell
and Donchin, 1988), which gained significant attention from BCIs researchers due to its
short training period and good performance (Bianchi et al., 2019). As the name suggests,
the P300 speller uses the P300 event-related potential (ERP), which is elicited by rare and
task-relevant stimuli (Donchin et al., 2000). In the standard P300 speller system, the user
observes different characters and commands in a matrix format and the columns and rows
are flashed in a random order. The user will count the number of times the target character is
flashed. An oddball paradigm is created due to the low probability of a flashed row/column
containing the target, which therefore elicits P300 ERPs.
However, the P300 is not a perfectly stereotypical waveform. Its amplitude and latency
vary widely for different users (Guger et al., 2009), and even for the same user in different
sessions (Fjell et al., 2009). These variations are influenced by many factors, such as age,
gender (Polich and Kok, 1995), fatigue, exercise (Yagi et al., 1999) and attention (Polich,
2007). One major effect of P300 latency variation is decreased system performance (
Thomp-son et al., 2012; Aric`o et al., 2014).
Because of such variations in P300 amplitude and latency, several studies have proposed
methods to estimate characteristics of the P300 potential including latency (e.g., D’Avanzo
et al. 2011; Li et al. 2009). But, fewer studies have examined the effect of this jitter on
P300 Speller performance; to our knowledge, the first was our paper on classifier-based
latency estimation (CBLE) (Thompson et al., 2012). A later study by another group also
independently confirmed a negative link between latency jitter and BCI performance (Aric`o
et al., 2014). Later, the CBLE estimates and a wavelet transform were used to provide the
resulted in an enhanced BCI performance. The potential of the CBLE method to predict
BCI performance made us interested in investigating a non-linear classifier based CBLE
method and the prediction accuracy of CBLE on a different dataset.
CBLE uses the classifier’s sensitivity to latency variability to estimate P300 latency. In
our previous work, it was claimed that i) CBLE is classifier independent and ii) CBLE can
be used to predict BCI accuracy. A comparison of least-squares (LS) and stepwise linear
discriminant analysis (SWLDA) was used to support the first statement. However, both LS
and SWLDA are linear classifiers, and SWLDA has the same solution subspace with LS for
binary classification problems (Ye,2007; Lee and Kim,2015). Hence classifier independence
was indicated, but not verified, particularly for non-linear classifiers.
In this work, we will extend our previous CBLE investigations using a sparse autoencoder
(SAE), and will examine if classifier independence holds for this non-linear classifier. Both
previously-used classification methods (LS, SWLDA) as well as the new non-linear method
(SAE) will be used with a new P300 dataset to further verify the ability of CBLE to predict
BCI accuracy. The motivation behind choosing these three classification methods are:
i) LS provided the best overall performance on the dataset used in CBLE’s original article
(Thompson et al.,2012),
ii) In a classifier comparison study (Krusienski et al.,2006) SWLDA provided the overall
best performance, and
iii) A recent study (Vaˇreka and Mautner,2017) showed that SAE provided the best overall
performance on their dataset for P300 speller. But SAE has never been used to estimate
ISI Stimulus 100 ms 67 ms SOA 7 ms
Figure 3.1: A Visual interface of the 6×6 matrix used in this study. A row or column intensifies for 67 ms, followed by a 100 ms pause. The front-most image shows an intensifi-cation of the column containing the character “T”. This is the current target, so a P300 is expected to be elicited by this intensification.
3.2
Methods
3.2.1
Experimental Setup
Data were collected from each participant in three sessions, i.e., on three different days,
using BCI2000’s (Schalk et al., 2004) row-column P300 speller paradigm. Each session
was comprised of copying three sentences. For each sentence, each row/column was either
intensified or replaced with Einstein’s face for 67 ms (stimulus duration) with an
inter-stimulus interval of 100 ms. The inter-stimulus onset asynchrony (SOA) was therefore 167 ms. A
complete set of 12 intensification or replacements is called a sequence. For each character,
we recorded data for 10 sequences. The copied sentences are shown in Table 3.1. The data
from the first sentence in session 01 was used as training data to train the online classifiers
and the data for remaining sentences were used as test data. The bolded sentences (one for
each session) used Albert Einstein’s iconic tongue face image instead of flashing.
EEG data were recorded using a Cognionics Mobile-72 EEG system with a sampling
frequency of 600Hz. The Mobile-72 EEG system is a high-density mobile EEG system with