R E S E A R C H
Open Access
Inferring gene regulatory networks from
asynchronous microarray data with AIRnet
David Oviatt
1, Mark Clement
1*, Quinn Snell
1, Kenneth Sundberg
1, Chun Wan J Lai
2, Jared Allen
3, Randall Roper
3From
The 2009 International Conference on Bioinformatics & Computational Biology (BioComp 2009)
Las Vegas, NV, USA. 13-16 July 2009
Abstract
Background:Modern approaches to treating genetic disorders, cancers and even epidemics rely on a detailed understanding of the underlying gene signaling network. Previous work has used time series microarray data to infer gene signaling networks given a large number of accurate time series samples. Microarray data available for many biological experiments is limited to a small number of arrays with little or no time series guarantees. When several samples are averaged to examine differences in mean value between a diseased and normal state, information from individual samples that could indicate a gene relationship can be lost.
Results:Asynchronous Inference of Regulatory Networks (AIRnet) provides gene signaling network inference using more practical assumptions about the microarray data. By learning correlation patterns for the changes in
microarray values from all pairs of samples, accurate network reconstructions can be performed with data that is normally available in microarray experiments.
Conclusions:By focussing on the changes between microarray samples, instead of absolute values, increased information can be gleaned from expression data.
Background
Sequencing the human genome is one of the great accomplishments in recent history. The knowledge gained through sequencing the human genome is vast and holds great implications for medical practice [1]. No single gene, however, decides how an organism grows and matures. Genes form regulatory networks where many genes interact to produce an observable pheno-type [2,3]. An understanding of gene regulatory net-works is the key that will open the door to major breakthroughs in fields as diverse as agriculture [4-6] and medicine [7-11].
Many factors can influence each gene’s expression at any moment. One or more proteins produced by other genes within the regulatory network can promote or inhibit the expression of a particular gene. An under-standing of how genes interact with each other is
essential to developing new drugs and treatments. In many studies where gene expression data is used, tens of samples from a diseased organism will be compared with tens of samples from normal individuals. Average values from these two pools may not show statistically significant fold changes because the expression value for a gene may naturally vary significantly between indivi-dual samples at different time points. It can be difficult to infer signaling information based on these average values.
As an illustration of this problem, imagine a car race. Two of the drivers have a wireless headset that allows them to communicate. Although they may never be in the same absolute position at the same time, their velo-city and acceleration could be correlated as they signal each other through their headsets. If you averaged the position of all cars throughout the race, these two cars may not appear to be more correlated in their position to each other than any other cars in the race. If you examine their velocity and acceleration, however, these two cars would appear to be much more correlated than
* Correspondence: [email protected] 1
Department of Computer Science, Brigham Young University, Provo, UT, USA
Full list of author information is available at the end of the article
© 2010 Clement et al; licensee BioMed Central Ltd. This is an open access article distributed under the terms of the Creative Commons Attribution License (http://creativecommons.org/licenses/by/2.0), which permits unrestricted use, distribution, and reproduction in any medium, provided the original work is properly cited.
other cars who may have more similar positions. The same effect can be observed in microarray data. The samples collected during an experiment may not show a correlation in their average values, but the changes (velocity and acceleration analogs) may be correlated. This correlation in changes can be an indicator that the genes are signaling each other, or that they are both being modulated by an external effect. This correlation can generate new hypotheses for connections that can be validated through biological experiments.
Asynchronous Inference of Regulatory Networks (AIR-net) unravels the complexity of regulatory networks using unsynchronized microarray data that is generally available to researchers to create a network based on the correlation of gene expression changes between microarray experiments. Expression values for all pairs of samples in a data set are compared to determine the correlation in changes between all sets of genes in the sample. Edges between genes whose changes appear to be correlated in the largest percentage of microarray pairs are inserted into the inferred gene regulatory net-work. AIRnet can then compare the network for the dis-eased and normal data sets to determine which pathways are being disrupted by the condition.
AIRnet has produced promising results when inferring realistic in-silico regulatory networks. In experiments with real mouse arrays, AIRnet has also produced a sig-nificant number of validated connections. Research is currently underway to validate predicted connections through in-vivo techniques.
Related work
Many strategies have been formulated to deduce gene regulatory networks from microarray data. In a paper written by Wanget al.[12], a strategy is proposed that uses multiple microarray samples from different experi-ments to find a gene regulatory network. Each of these data sets represents a unique experiment. Each experi-ment is assumed to represent a unique perturbation to the gene regulatory network. Gene regulatory networks are also assumed to be sparse. Differential equations are used to derive a general solution that is the best repre-sentation of the invariant parts of the different microar-ray data sets. Their results show that they are successful in reconstructing small networks. Our algorithm, unlike Wang et al.,does not utilize differential equations to form a model of the regulatory network, but employs a much simpler method that can be extended to whole genome studies. While differential equation based infer-ence techniques are limited to tens of genes, AIRnet has been shown to be effective with 44,000 gene probes. Another popular strategy developed by Liao et al.[13], called network component analysis, makes assumptions about power law relationships between genes and the
factors that influence their expression. They explain that microarray data is frequently given as a log ratio, thus being pseudo-linear. Then, based on these premises, a regulatory network can be written as E=A* P. Where
Eis the microarray data, Arepresents prior information about the network, andPrepresents samples of regula-tory signals. When there is no noise associated with this relationship, there is a unique analytic solution that can be found. In real applications, there is noise, and through the use of simulated and real data they are able to reconstruct gene relationships with acceptable accu-racy. Their results depend largely on the amount of noise present. A shortcoming of this approach is that prior information about a network needs to be known and expressed in matrix form. Another problem is that there are very stringent constraints on the characteris-tics of matrix A. A has to have full column and row rank, and if any connections are removed,Astill has to have full column and row rank. These restrictions make this method cumbersome to use and limits the datasets that it can be applied to. AIRnet’s algorithm can be applied to any set of microarray data and will extract as much of the signal that is present in the data.
A third method for discovering gene regulatory net-works has been implemented by Nathan Barker [14] in iBioSim. His method first divides the microarray expres-sion data into three categories; high, medium and low. Each gene is assigned one of these values based on its relative expression level when compared to each of the other genes’ expression levels. This categorization of genes assigns an approximately equal number of genes to each of the three categories. Barker’s algorithm then uses these categories to build an influence vector that shows the degree of influence each gene at one time point has on every other gene in the next time point. Barker’s algorithm assumes it has time series data when comparisons between samples are made. This assump-tion allows the algorithm to decide which gene is pro-moting or inhibiting another, rather than just find that there is a promoting or inhibiting relationship between two genes.
AIRnet takes a new approach to microarray analysis that avoids many of the pitfalls of existing approaches. The focus of the algorithm is on correlation between the changes of different genes instead of instantaneous probe values. This approach can be extended to full genome microarray studies, where differential equation based approaches are limited to small numbers of genes. AIRnet does not require prior information about gene interactions and through examining correlation in the changes in gene expression, it does not require time ser-ies data. Methods that require time serser-ies data are not practical with real microarray data. The simple fact that several samples are taken sequentially does not
guarantee that they are sequential as far as the biological model is concerned. The time taken for genes to inter-act with one another is too small for us to accurately measure, and certainly too small to be able to generate a microarray sample at each time step, which would be necessary to fulfill time series assumptions.
Other methods of microarray analysis are based on statistical significance tests. Gene Set Enrichment Analy-sis, proposed by Subramanianet al.[15], and Significance Analysis of Microarray Gene Sets, proposed by Dinu
et al.[16], are two methods that apply statistical tests to previously selected groups of genes, such as genes in the same signaling pathway. These methods attempt to identify whether the gene sets are associated with a par-ticular phenotype. Similarly, AIRnet can highlight a sub-set of genes within the entire network, either treating the subset as the entire network, or showing only genes, which are highly correlated with one or more genes in the specified subset. AIRnet will also compare networks to identify phenotype-specific gene correlations.
Results and discussion
Results were gathered fromin-silicoregulatory network data originally created for the DREAM3 competition [17]. This data was generated from a TRUE network, so inferred networks can be compared on an edge by edge basis to the original network. Although this kind of comparison is easy to perform, it lacks some biological reality. The second set of results was generated by examining real mouse microarray data. Edges in the net-work inferred by AIRnet were validated through public pathway databases. This approach is limited because a legitimate gene relationship inferred by AIRnet may not have been studied enough to make its way into a publi-cation. But these results show that the accuracy of the algorithm is not limited to simulated data.
In-silico validation
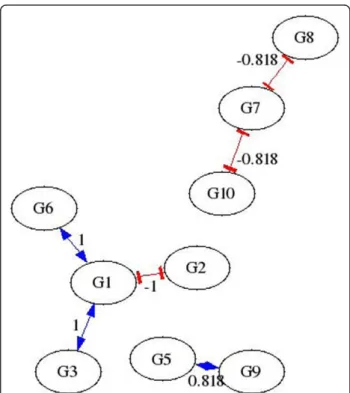
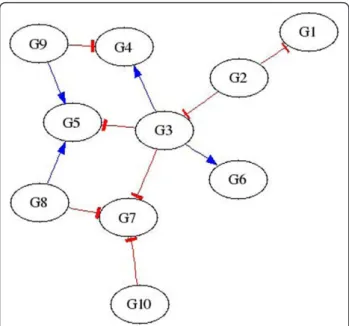
Three types of data are used to test AIRnet’s accuracy for each of the in-silico regulatory networks. The data types are labeled as heterozygous knock-down, null-mutant, and trajectory. The heterozygous knock-down and null-mutant data sets each contain data for the steady states of the wild-type as well as knock-down or knock-out data for each gene. Trajectory data sets are comprised of time series data, with 21 time points, for each network recovering from external perturbations. Each network is subjected to, and has data for, a num-ber of perturbations equal to 46% of the numnum-ber of genes within the network. Figures 1 and 2 depict regula-tory networks inferred by AIRnet using data produced by one of the networks generated for DREAM3. The
in-silico network is shown in Figure 3. Figures 1 and 2 show that higher threshold values produce more
selective networks by excluding connections for which the correlation between the two genes is not great enough. Visual verification, however, is not always the best method for measuring the accuracy of an inferred regulatory network, especially if the network is large.
Scoring metrics from the DREAM3 competition are used to verify the statistical significance of AIRnet’s reconstructed regulatory networks. The DREAM3 metrics calculate the AUROC and AUPR values and compare the resulting values with the AUROC and AUPR of 100,000 randomly generated networks to com-pute the probability of randomly creating a network with equal or greater AUROC and AUPR values, produ-cing a p-value for both the AUROC and AUPR. The AUROC p-values are combined by averaging the scores
Figure 1Sample AIRnet Network inferred using 40% threshold.
for same-sized networks. The same is done for the AUPR values. The averaged AUROC and AUPR p-values are subsequently combined as a log-transformed average,–log10(AU ROCp* AUPRp)/2. Each
log-trans-formed average provides a single value, which sum-marizes AIRnet’s accuracy for five individual, same-sized networks.
Because the graphs AIRnet produces are signed and undirected, the standards, against which AIRnet is being measured, were modified to be undirected as well.
The score, along with the AURR and AUROC p -values, are displayed in Table 1. The first row in each section of Table 1, the empty network, report the values obtained from a network with zero edges, or a network which assumes genes do not interact in any way with each other. The empty network is not produced by AIR-net, but is included as a baseline for comparing AIRnet’s accuracy using the supplied data types. Other rows cor-respond to the type of data used to infer the networks, as specified by the first column.
As seen in Table 1, the null-mutant data produces sig-nificantly better results than either of the other two data types. The networks AIRnet infers using null-mutant data appear to be only marginally better when inferring small networks, however, as the network size grows, the null-mutant produced networks’ accuracy grows at a much faster rate than the accuracy for networks pro-duced by either the heterozygous data, or the trajectory (time series) data.
It is interesting to note, using the trajectories data to infer networks gave the lowest scores of all the data types, in one case, scoring even lower than the empty
network even though the data was produced by a simu-lator with accurate time series outputs (Table 1).
Comparing the values in Table 1 with the 300 submis-sions to the DREAM3 competition ranks AIRnet in the top 5 performers. This comparison ignores directional-ity, which would probably lower the AIRnet ranking. The results are promising and more importantly, are obtained using microarray assumptions that can be met by most biological experiments.
Real microarray data
Microarray data was examined from an experiment with 11 euploid and 13 trisomic Ts1Cje mice to show the utility of AIRnet with real data. The euploid arrays were examined separately from the trisomic arrays and the resulting regulatory networks were then compared. One important feature of the AIRnet approach is the increased number comparisons that are possible. With 11 euploid arrays, there are 110 different pairs that can be examined for changes. If the data were treated as a time series, then only 10 comparisons could be made. If mean values were used, then there would be only one Figure 3True in-silico network
Table 1 AIRnet results for DREAM3 competition
Values for 10-gene networks. score AUPRp-value
average
AUROCp-value average empty
network
1.1816e+00 8.5675e-03 5.0578e-01 trajectories 1.6298e+00 2.1759e-03 2.5279e-01 heterozygous 2.2401e+00 3.6441e-04 9.0845e-02 null-mutant 2.8198e+00 4.1550e-05 5.5198e-02
Values for 50-gene networks. score AUPRp-value
average
AUROCp-value average empty
network
2.4438e+00 2.6065e-05 4.9687e-01 trajectories 2.6700e+00 6.1865e-06 7.3901e-01 heterozygous 2.6207e+00 7.7215e-06 7.4297e-01 null-mutant 1.4152e+01 5.2984e-26 9.3634e-04
Values for 100-gene networks. score AUPRp-value
average
AUROCp-value average empty
network
5.2312e+00 6.8572e-11 5.0297e-01 trajectories 3.8264e+00 4.7395e-08 4.6923e-01 heterozygous 5.2881e+00 6.3523e-11 4.1762e-01 null-mutant 3.7911e+01 1.0263e-71 1.4694e-05
AIRnet results for 3 network sizes from the DREAM3 competition. The empty network row shows values for graphs with 0 edges and provide a baseline to interpret the scores for other networks. The empty network scores were generated by submitting an empty file with no predictions to the DREAM score evaluator. The other rows correspond to the type of data used to infer the networks. In the score column, larger values are better. In the other two columns, smaller values are better. Scores reported are produced using an 80% threshold parameter for AIRnet.
comparison between the euploid and trisomic groups. With 13 trisomic arrays, there are 156 pairs of arrays.
The AIRnet analysis found 566 genes with significantly correlated changes in expression between arrays. Each edge in this network was then submitted to PathGen [18] to determine which inferred connections have been verified through wet-lab experiments. The PathGen database was created using data from KEGG PATH-WAY, PubMed abstracts, DIP (Database of Interacting Proteins), HPRD, Reactome, MIPS, BIND, IntAct and MINT. There are currently, over two million interac-tions included in the PathGen database. PathGen returned the number of intermediate nodes in the path-way found in the database corresponding to a direct connection inferred by AIRnet. The results in Table 2 show that nearly 70% of the interactions inferred by AIRnet exist with some number of intermediate genes in a public regulatory network database. It is difficult for most inference algorithms to identify all of the hops between two genes that are highly correlated. For this reason, we count an inferred connection as validated if there is multi-hop connection in a pathway database.
An inference rate of 70% is extremely good when compared to other inference algorithms. In order to quantify this quality an experiment was performed with 100 random networks of 566 genes. The same number of connections were made in these random networks as exist in the AIRnet results. These edges were then sub-mitted to PathGen to determine how AIRnet results would compare to random networks. Less than 30% of the connections in random networks were found in pathway databases, showing that AIRnet infers connec-tions that are significantly more likely to be real than random networks. The PathGen database is biased towards more studied regulatory pathways, so actual accuracy of AIRnet is probably higher than the 70% reported.
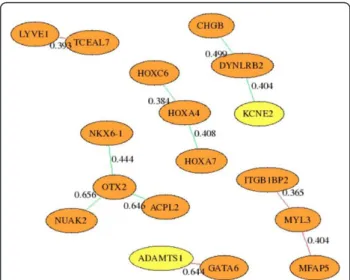
Another benefit of inferring a regulatory network based on changes in expression values between microar-rays is the ability to compare the network generated by diseased and normal arrays. In this experiment we com-pared the network generated by the 11 euploid microar-rays with the network generated by the 13 trisomic arrays. The results are plotted in Figure 4. The edge between ADAMTS1 and GATA6 is found only in the Euploid inferred network. This may indicate that having three copies of the trisomic gene ADAMTS1 may dis-rupt this connection to GATA6. Further research is being performed to validate this kind of hypothesis.
Conclusions
AIRnet infers regulatory networks from microarray data with practical assumptions. The microarray data does not have to have time-series characteristics and no con-straints are placed on the structure of the matrices. Net-works inferred by AIRnet are comparable in accuracy to the best algorithms participating in the DREAM3 com-petition even though many of these algorithms were more restrictive on the kind of data they could use. Edges predicted by AIRnet also compare favorably with experimentally validated regulatory networks found pub-lic databases [18]. Perhaps the most important aspect of this approach is scale. AIRnet can perform predictions on microarrays with 44,000 gene probes in less than 24 hours, making it practical for most analysis needs. This new approach of looking at correlation in changes, rather than comparisons of mean values can provide the understanding of gene regulatory networks necessary for
Table 2 AIRnet results on experimental data
Intermediate Genes Connections Percentage
1 148 0.41%
2 3110 8.71%
3 12253 34.34%
4 8065 22.60%
5 1349 3.78%
Validated AIRnet Connections 24926 69.87% Validated Random Network Connections 17841 27.90%
AIRnet inferred connections found in public databases. The table shows the number of connections in the AIRnet inferred network that have the given number of intermediate connections. A Connection count of one indicates that the genes are directly connected in the graph. A count of two indicates that the genes have one intermediate gene between them in the pathway database. The percentage shows the percentage of connections in the inferred network that have this Connection count. AIRnet connections were validated almost 70% of the time, where less than 30% of the connections in random networks were validated.
Figure 4Differences between Euploid and Trisomic regulatory networks inferred by AIRnet. Numbers on edges are the absolute value of the difference between the edge weight in Euploid and Trisomic samples. Red edges were found only in Euploid and Green edges were found only in Trisomic samples. Genes with three copies in the trisomic Ts65DN mice are shown in yellow.
the impending major breakthroughs in agriculture and medicine.
In the analogy where race car drivers were signaling to each other to change velocity, an examination of instan-taneous positions would not be able to detect this sig-naling. Only by looking at velocity could the correlation be detected. AIRnet examined the analogous velocity of changes in microarray data to detect correlations that can not be inferred by methods that focus on absolute values. AIRnet can be downloaded from http://dna.cs. byu.edu/airnet/
Methods
AIRnet infers a gene regulatory network by analyzing how genes change between microarray samples instead of focussing on their absolute values. Non-time series data from different samples are used to find correlated patterns in the way genes change. The samples collected during an experiment may not show a correlations in their average values, but the changes may be correlated. This correlation in changes can be an indicator that the genes are signaling each other, or that they are both being modulated by an external effect. The correlation of gene expression changes is used to create influence vectors, which highlight the genes with the highest probability of being correlated. Ultimately, AIRnet is designed to compare two networks of different geno-types, in order to draw out differences that will assist researchers with the development of treatments.
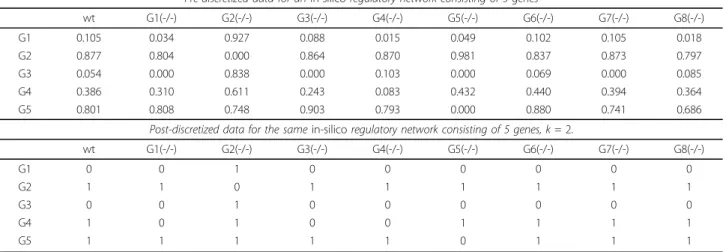
The first step in analyzing microarray data is discretizing the data (Table 3). While discretizing, the data for a single gene across all the samples is considered a single dataset. Each dataset is clustered usingk-means clustering. After all the data sets have been discretized, the data for each gene in every sample is classified as a number between 0 andk
–1. The new value represents the relative level of activa-tion for a particular gene, as compared between samples. The example in Table 3 shows data being discretized into two values (0 and 1), but users can select a larger number of discrete values for the discretization step. After discretiz-ing the data, AIRnet performs a pairwise comparison of the change in activation state between samples for all genes.
Comparing genesxandy, AIRnet calculates an influence vector,vxy, representing how correlatedxandyappear to
be (equations 1 and 2). An influence value is generated for each pair of microarrays and the vector contains the set of these values. Negative values ofvxyindicate a inhibiting
relation (negatively correlated) betweenxandy, while a positive value ofvxyindicates a promoting relation
(posi-tively correlated). Several other similarity metrics were examined, but this method provided the highest accuracy. Commonly used metrics such as the Pearson correlation coefficient do not apply well when looking for correlation of changes instead of correlation of absolute values.
v q f x x y y n n xy xy i j i j j i n i n = + − = + = −
∑
∑
( , , , ) *( ) / 1 1 1 1 2 (1) f x x y y x x y y x x y y i j i j i j i j i j i j ( , , , ) ( ) ( ) ( ) ( ); = > ∧ > < ∧ < 1 0 if or if if or ( ) ( ); ( ) ( ) ( ) ( x x y y x x y y x x y y i j i j i j i j i j i j = = − > ∧ < < ∧ > ∨ 1 )). ( , , , ) ( , , , ) ⎧ ⎨ ⎪ ⎪⎪ ⎩ ⎪ ⎪ ⎪ = = + = −∑
∑
q g x x y y g x x y y xy i j i j j i n i n i j i j 1 1 1 == = = − < − = = 1 2 1 if and | | if and x x y y x y k x x y y i j i j i i i j i j , , / ; , , | | otherwise. xi−yi >k ⎧ ⎨ ⎪ ⎪⎪ ⎩ ⎪ ⎪ ⎪ / ;2 0 (2)The Dialogue for Reverse Engineering Assessments and Methods (DREAM) organization creates benchmark data and metrics for evaluating the accuracy of gene regulatory network inference algorithms [17]. Table 4 shows example data for generating influence vectors. The columns represent different microarray samples for the DREAM knockout experiment. In the first section of Table 4, G1 changes from a 0 to a 1 between sample G1 (—/—) and G2(—/—). The same change is observed for G6. This would represent one vote for positive correla-tion for G1 and G6.
The second section of Table 4 illustrates an example of support for negative correlation. G1 changes from a 1 to a 0 between sample G2(—/—) and G3(—/—). G2 changes from a 0 to a 1 between sample G2(—/—) and G3(—/—) providing evidence for negative correlation.
In the third section of Table 4, G3 and G4 stay the same between sample G7(—/—) and G8(—/—). This would represent one vote for positive correlation for G3 and G4 since neither gene changed, even though their values are different. Change values for all pairs of samples are summed to generate the influence vector for a pair of genes.
Given a practical microarray experiment with 20 sam-ples, time series based algorithms would only be able to perform 19 comparisons between values, even if the experiments were performed with a perfect time period between samples. Due to the asynchronous nature of AIRnet inference, all pairs of samples can be used, resulting in 190 comparisons. Even with 10 samples, 45 comparisons can be performed in to determine which gene expression values are correlated in their changes.
Following the calculation of vxy for all values ofxand
y, AIRnet reconstructs the regulatory network by includ-ing edges that have the highest number of pairs of experiments where the expression changes are corre-lated. In our example with 10 experiments, there are 45 pairs of samples. If Gene A and Gene B both increased in 20 of these pairs and both decreased in 20 of the pairs and were uncorrelated in 5 of these pairs, then the degree of correlation would be (20 + 20)/45 = 0.88. The
edges between genes with the highest degree of correla-tion are included in the reconstructed network.
AIRnet produces a graph,Grepresentation of the reg-ulatory network, where each node, x, represents a single gene, and each edge, ({x,y},v) represents an interaction between x and y. The sign ofv shows the interaction between xand yas either promoting (positively corre-lated) or inhibiting (negatively correcorre-lated), while |v| shows the probability of xinteracting withy. To form
Table 4 Activation state change examples
equal, non-zero activation state changes - vxyincremented
wt G1(-/-) G2(-/-) G3(-/-) G4(-/-) G5(-/-) G6(-/-) G7(-/-) G8(-/-) G1 0 0 1 0 0 0 0 0 0 G2 1 1 0 1 1 1 1 1 1 G3 0 0 1 0 0 0 0 0 0 G4 1 0 1 0 0 1 1 1 1 G5 1 1 1 1 1 0 1 1 1 G6 0 0 1 0 0 0 0 0 0
equal magnitude, opposing-signed activation state changes - vxydecremented
wt G1(-/-) G2(-/-) G3(-/-) G4(-/-) G5(-/-) G6(-/-) G7(-/-) G8(-/-) G1 0 0 1 0 0 0 0 0 0 G2 1 1 0 1 1 1 1 1 1 G3 0 0 1 0 0 0 0 0 0 G4 1 0 1 0 0 1 1 1 1 G5 1 1 1 1 1 0 1 1 1 G6 0 0 1 0 0 0 0 0 0
activation state changes equal to zero - qxyincremented
wt G1(-/-) G2(-/-) G3(-/-) G4(-/-) G5(-/-) G6(-/-) G7(-/-) G8(-/-) G1 0 0 1 0 0 0 0 0 0 G2 1 1 0 1 1 1 1 1 1 G3 0 0 1 0 0 0 0 0 0 G4 1 0 1 0 0 1 1 1 1 G5 1 1 1 1 1 0 1 1 1 G6 0 0 1 0 0 0 0 0 0
Activation State Change Examples - genes are divided by row, samples are divided by column. Table 3 Data discretization
Pre-discretized data for anin-silicoregulatory network consisting of 5 genes
wt G1(-/-) G2(-/-) G3(-/-) G4(-/-) G5(-/-) G6(-/-) G7(-/-) G8(-/-) G1 0.105 0.034 0.927 0.088 0.015 0.049 0.102 0.105 0.018 G2 0.877 0.804 0.000 0.864 0.870 0.981 0.837 0.873 0.797 G3 0.054 0.000 0.838 0.000 0.103 0.000 0.069 0.000 0.085 G4 0.386 0.310 0.611 0.243 0.083 0.432 0.440 0.394 0.364 G5 0.801 0.808 0.748 0.903 0.793 0.000 0.880 0.741 0.686
Post-discretized data for the samein-silicoregulatory network consisting of 5 genes, k= 2.
wt G1(-/-) G2(-/-) G3(-/-) G4(-/-) G5(-/-) G6(-/-) G7(-/-) G8(-/-) G1 0 0 1 0 0 0 0 0 0 G2 1 1 0 1 1 1 1 1 1 G3 0 0 1 0 0 0 0 0 0 G4 1 0 1 0 0 1 1 1 1 G5 1 1 1 1 1 0 1 1 1
the graph, AIRnet adds the edges ({x,y},wxy), where wxy
= 1–|vxy|, for all values ofxandy. To prune edges out
of the graph, Kruskal’s Algorithm is used to find the minimum cost spanning tree of the graph G, with the addition of stopping the production of the minimum cost spanning tree when the value of |wxy| for the next
edge to be added falls below a user-defined threshold. The wxy values are then exchanged with their
corre-sponding vxy values. This algorithm creates a graph with edges between genes that are most highly corre-lated in their changes. This graph is similar to the mutial information graph produced by MINET [19].
Authors contributions
DO implemented the algorithm, wrote the documentation and created the source distribution. MC participated in the design of the algorithm and supervised the validation. QS participated in the design of the algorithm and validation. KS designed an initial version of the algorithm and helped in creating the companion program used for validation. CWL performed the validation with pathgen. JA performed trisomic mice experiments and compared results with other applications. RR provided vision for algorithm development and specification for program results. All authors read and approved the final manuscript.
Competing interests
The authors declare that they have no competing interests. Acknowledgements
Brigham Young University funded this research through a Mentoring Environment Grant. Purdue University Indianna University Indianapolis also provided travel funding for the collaboration. Publication of this supplement was made possible with support from the International Society of Intelligent Biological Medicine (ISIBM).
This article has been published as part ofBMC GenomicsVolume 11 Supplement 2, 2010: Proceedings of the 2009 International Conference on Bioinformatics & Computational Biology (BioComp 2009). The full contents of the supplement are available online at http://www.biomedcentral.com/1471-2164/11?issue=S2.
Author details
1Department of Computer Science, Brigham Young University, Provo, UT, USA.2Department of Chemistry and Biochemistry, Brigham Young University, Provo, UT, USA.3Department of Biology, Indiana University-Purdue University Indianapolis, Indianapolis, IN, USA.
Published: 2 November 2010 References
1. Collins FS, McKusick VA:Implications of the Human Genome Project for Medical Science.JAMA2001,285(5):540-544[http://jama.ama-assn.org/cgi/ content/abstract/285/5/540].
2. Davidson EH, Rast JP, Oliveri P, Ransick A, Calestani C, Yuh CH, Minokawa T, Amore G, Hinman V, Arenas-Mena C, Otim O, Brown CT, Livi CB, Lee PY, Revilla R, Rust AG, Pan Zj, Schilstra MJ, Clarke PJC, Arnone MI, Rowen L, Cameron RA, McClay DR, Hood L, Bolouri H:A Genomic Regulatory Network for Development.Science2002,295(5560):1669-1678 [http:// www.sciencemag.org/cgi/content/abstract/295/5560/1669].
3. Levine M, Davidson EH:From the Cover: Gene Regulatory Networks Special Feature: Gene regulatory networks for development.Proceedings of the National Academy of Sciences2005,102(14):4936-4942 [http://www. pnas.org/cgi/content/abstract/102/14/4936].
4. Carrari F, Urbanczyk-Wochniak E, Willmitzer L, Fernie AR:Engineering central metabolism in crop species: learning the system.Metabolic Engineering2003,5(3):191-200.
5. Li Cj, Li RW, Wang Yh, Elsasser TH:Pathway analysis identifies perturbation of genetic networks induced by butyrate in a bovine
kidney epithelial cell line.Functional and Integrative Genomics2006, 7(3):644-652.
6. Stephansky A, Leustek T:Histidine biosynthesis in plants.Amino Acids 2006,30(2):127-142.
7. Hoque MO, Kim MS, Ostrow KL, Liu J, Wisman GBA, Park HL, Poeta ML, Jeronimo C, Henrique R, Lendvai A, Schuuring E, Begum S, Rosenbaum E, Ongenaert M, Yamashita K, Califano J, Westra W, van der Zee AG, Criekinge WV, Sidransky D:Genome-Wide Promoter Analysis Uncovers Portions of the Cancer Methylome.Cancer Res2008,68(8):2661-2670 [http://cancerres.aacrjournals.org/cgi/content/abstract/68/8/2661]. 8. Ideker T, Sharan R:Protein networks in disease.Genome Res2008,
18(4):644-652 [http://www.genome.org/cgi/content/abstract/18/4/644]. 9. Rubenstein K:Systems Biology: A Disruptive Technology.CHI Insight
Pharma Reports2008.
10. van Greevenbroek M, Zhang J, Kallen CJ, Schiffers P, Feskens E, de Bruin T: Effects of interacting networks of cardiovascular risk genes on the risk of type 2 diabetes mellitus (the CODAM study).BMC Medical Genetics 2008,9:36 [http://www.biomedcentral.com/1471-2350/9/36]. 11. Zhu J, Zhang B, Schadt EE:A Systems Biology Approach to Drug
Discovery, Volume Volume 60 of.Advances in Genetics.Academic Press 2008.
12. Wang Y, Joshi T, Zhang XS, Xu D, Chen L:Inferring gene regulatory networks from multiple microarray datasets.Bioinformatics2006, 22(19):2413-2420 [http://bioinformatics.oxfordjournals.org/cgi/content/ abstract/22/19/2413].
13. Liao JC, Boscolo R, Yang YL, Tran LM, Sabatti C, Roychowdhury VP:Network component analysis: Reconstruction of regulatory signals in biological systems.Proceedings of the National Academy of Sciences2003, 100(26):15522-15527.
14. Barker NA:Learning Genetic Regulatory Network Connectivity from Time Series Data.PhD thesis,University of Utah 2007.
15. Subramanian A, Tamayo P, Mootha VK, Mukherjee S, Ebert BL, Gillette MA, Paulovich A, Pomeroy SL, Golub TR, Lander ES, Mesirov JP:Gene set enrichment analysis: A knowledge-based approach for interpreting genome-wide expression profiles.Proceedings of the National Academy of Sciences of the United States of America2005,102(43):15545-15550 [http:// www.pnas.org/content/102/43/15545.abstract].
16. Dinu I, Potter J, Mueller T, Liu Q, Adewale A, Jhangri G, Einecke G, Famulski K, Halloran P, Yasui Y:Improving gene set analysis of microarray data by SAM-GS.BMC Bioinformatics2007,8:242 [http://www.
biomedcentral.com/1471-2105/8/242].
17. Marbach D, Schaffter T, Mattiussi C, Floreano D:Generating Realistic in silico Gene Networks for Performance Assessment of Reverse Engineering Methods.Journal of Computational Biology2009. 18. Gustafson N, Clement K, Merris C, Flygare S, Sundberg K, Carrol1 H,
Clement1 M, Allen QSJ, Roper RJ:Pathgen: A Web Resource for Gene Network Generation.Tech. rep.Brigham Young University 2009. 19. Meyer P, Lafitte F, Bontempi G:minet: A R/Bioconductor Package for
Inferring Large Transcriptional Networks Using Mutual Information.BMC Bioinformatics2008,9[http://dx.doi.org/10.1186/1471-2105-9-461].
doi:10.1186/1471-2164-11-S2-S6
Cite this article as:Oviattet al.:Inferring gene regulatory networks from asynchronous microarray data with AIRnet.BMC Genomics201011(Suppl 2):S6.
Submit your next manuscript to BioMed Central and take full advantage of:
• Convenient online submission
• Thorough peer review
• No space constraints or color figure charges
• Immediate publication on acceptance
• Inclusion in PubMed, CAS, Scopus and Google Scholar
• Research which is freely available for redistribution
Submit your manuscript at www.biomedcentral.com/submit