Research Article
Antioxidant Activity and Total Phenolic and Flavonoid Content
of Various Solvent Extracts from
In Vivo
and
In Vitro
Grown
Trifolium pratense
L. (Red Clover)
Arash Khorasani Esmaeili, Rosna Mat Taha, Sadegh Mohajer, and Behrooz Banisalam
Institute of Biological Sciences, Faculty of Science, University of Malaya, 50603 Kuala Lumpur, Malaysia Correspondence should be addressed to Arash Khorasani Esmaeili; arash [email protected]
Received 20 January 2015; Revised 2 April 2015; Accepted 22 April 2015
Academic Editor: Paula I. Moreira
Copyright © 2015 Arash Khorasani Esmaeili et al. This is an open access article distributed under the Creative Commons Attribution License, which permits unrestricted use, distribution, and reproduction in any medium, provided the original work is properly cited.
In the present study the extracts ofin vivoandin vitrogrown plants as well as callus tissue of red clover were tested for their antioxidant activities, using different extraction solvent and different antioxidant assays. The total flavonoid and phenolic contents as well as extraction yield of the extracts were also investigated to determine their correlation with the antioxidant activity of the extracts. Among all the tested extracts the highest amounts of total phenolic and total flavonoids content were found in methanol extract ofin vivogrown plants. The antioxidant activity of tested samples followed the orderin vivoplant extract>callus extract>in vitroextract. The highest reducing power, 2,2-azino-bis-(3-ethylbenzothiazoline-6-sulphonic acid) (ABTS) radical scavenging, and chelating power were found in methanol extracts ofin vivogrown red clover, while the chloroform fraction ofin vivogrown plants showed the highest 2,2-diphenyl-1-picrylhydrazyl (DPPH) radical scavenging, superoxide anion radical scavenging and hydrogen peroxide scavenging compared to the other tested extracts. A significant correlation was found between the antioxidant activity of extracts and their total phenolic and total flavonoid content. According to the findings, the extract ofin vitroculture of red clover especially the callus tissue possesses a comparable antioxidant activity to thein vivocultured plants’ extract.
1. Introduction
As a member of the family Leguminosae or Fabaceae,
Trifolium pratense L. (red clover) is a short-lived biennial
plant which serves as food for livestock, but also as a health food for humans [1].
Red clover (Trifolium pratenseL.) has high concentrations of isoflavonoids, compounds largely distributed in the Legu-minosae family [2]. Many isoflavone preparations obtained from red clover are currently available as nutritional supple-ments [3]. Isoflavonoids are secondary metabolites divisible into isoflavones and pterocarpans. The main isoflavones in red clover are biochanin A and formononetin, both of which are found in abundance in leaves [4]. It also has antioxidant activity that may result from the presence of different flavonoids and other phenolic compounds such as phenolic acids, clovamides, and saponins. Apart from that,
it has also been adopted in traditional medicine to treat whooping cough, asthma, eczema, and eye diseases [5].
As shown in recent years, natural antioxidants discovered in plants have attracted some interest due to their widely acclaimed nutritional and therapeutic values. Antioxidant properties stand to be an essential mechanism of beneficial activity of plant-derived compounds and extracts.
Ethnopharmacological surveys have shed light on the fact that the therapeutic use of even 80% of 122 plant-derived drugs may have a link with their recommendations in traditional medicine [6]. Natural antioxidants have a diversity of biochemical activities, some of which include the inhibition of reactive oxygen species (ROS) generation, direct or indirect scavenging of free radicals, and alteration of intra-cellular redox potential [7]. Antioxidants have functioned to inhibit apoptosis because apoptosis was at first thought to be mediated by oxidative stress [8]. It is known that many
antioxidant substances have anticancer or anticarcinogenic properties [9, 10]. Epigallocatechin-3- gallate (EGCG) in green tea, for instance, has been reported to scavenge free radicals [11] and to hinder carcinogen-induced tumors in the skin, lung, forestomach, and colon of rodents [12].
Therefore, there has been undeniable evidence of interest when it comes to finding natural antioxidants from plant materials.
Studies regarding the bioactivities of various plants have assumed an important position because of the variations in the effectiveness of the plant extract with the solvent for extraction used, plant part used, the plants’ age, and geographic origin. The excessive use of medicinal plants for drug formulation also puts pressure on the need for more biomass of plants which can be met with biotechnological tools like micropropagation.
Our current work aims to evaluate the antioxidant prop-erties of the plant extracts, prepared from the aerial parts
of in vitro and in vivo grown red clover. We also seek to
examine the effects of extraction solvent on total phenolics, total flavonoids, and antioxidant activities of extracts from both thein vivoandin vitrogrown red clover.
2. Materials and Methods
2.1. In Vivo Plant Samples. Seeds of Trifolium pratense L.
were purchased from Stock Seed Farms (Murdock, US) and planted in polybags filled with coco peat, sand, and compost in the ratio of 1 : 1 : 1. The organic fertilizer was then added to each polybag and kept in the growth room (at temperature of
25 ± 1∘C, 16 hours photoperiod, 40𝜇mol/m2/s of photon flux density, and 60% relative humidity).
2.2. In Vitro Plant Samples. Some of the purchased seeds were
surface sterilized by first placing them under the running tap water for 30 minutes and were rinsed once using sterile distilled water and soaked in 50% Clorox for 2 minutes. The seeds were then washed 5 times using sterile distilled water and soaked in 10% Clorox for one minute. Again, the seeds were rinsed 5 times using sterile distilled water and dipped in 70% ethanol for 1 minute (inside laminar flow chamber). As the final step, the seeds were rinsed 5 times using sterile distilled water and blotted on sterilized filter paper. The MS (Murashige and Skoog) medium, without the addition of any hormones, served to germinate the sterilized seeds. Cultures were stored in growth room (at25 ± 1∘C, 16 hours photoperiod, 40𝜇mol/m2/s of photon flux density, and 60% relative humidity) until the grown plants are deemed suitable to be used for further investigation.
The in vitro regenerated red clover after six weeks of
culture was used as one of the plant materials in our current study.
The callus tissue of red clover was also produced using MS medium containing 1.5 mg/L BAP (6-benzylaminopurine) and 0.5 mg/L 2,4-D (2,4-dichlorophenoxyacetic acid). The node explants of 6 weeks old in vitro grown plants were cultured in the media. The six-week-old callus was collected as one of thein vitroplant materials/samples.
2.3. Extract Preparation. The aerial parts of in vivo and
in vitro grown plants and also the callus obtained from
in vitro culture were collected and dried in the dark. The
dried samples were powdered in an electronic blender before being used for solvent extraction. For the preparation of extract, 25 g of fine powder was extracted with 100 mL of 95% methanol at room temperature for 48 hours. The extracts were filtrated through Whatman number 1 and combined and this was followed by a concentration using rotary evaporator under pressure that was reduced at 45∘C. The filtrate obtained was suspended in distilled water (25 mL) and n-hexane (50 mL) was added to it, where the mixture was shaken well and the layers were enabled to be separated for 6 h. After separation of n-hexane layer again 50 mL of n-hexane was added to get the n-hexane fraction. In a similar manner, the protocol was repeated with the rest of the solvents (ethyl acetate and chloroform). Each fraction obtained was dried using a rotary evaporator [13]. The dry extract obtained with each solvent was weighed and the percentage yield was expressed in terms of the air-dried weight of plant materials. Samples were stored in an airtight container at –20∘C until it was time to conduct further analysis.
2.4. Determination of Antioxidant Activities
2.4.1. Total Phenolic Content. The total phenolic content
of the obtained extracts was spectrometrically analyzed in adherence to the Folin-Ciocalteu method [14]. In short, 100𝜇L of each extract (dissolved in methanol) or gallic acid standard solution was mixed with 2 mL of 2% (w/v) sodium carbonate solution. The mixture was then incubated for 5 minutes, and afterwards 100𝜇L of Folin-Ciocalteu reagent was added. After being left for 30 min at room temperature for color development, absorbance was measured at 750 nm using a spectrophotometer. Results are expressed as mg gallic acid equivalents (GAE) per gram dry matter of sample.
2.4.2. Total Flavonoid Content. Total flavonoid content was
ascertained based on the method by Zhishen et al. [15]. In brief, 50 mg of each fraction was dissolved in 10 mL of 80% aqueous methanol and filtered through Whatman filter paper number 42 (125 mm). In a 10 mL test tube, 300𝜇L of each extract, 3.4 mL of 30% methanol, 150𝜇L of 0.5 M NaNO2, and 150𝜇L of 0.3 M AlCl3⋅6H2O were added and mixed, followed by 5 min incubation and the addition of 1 mL of NaOH (1 M). Absorbance was measured at 510 nm with a spectrophotometer. The standard curve for total flavonoids was made using rutin standard solution (0–100 mg/L) using the same aforementioned procedure. The total flavonoid content was shown as milligram of rutin equivalents (CTE) per gram dry matter of extract.
2.4.3. Antioxidant Assays. Each sample was dissolved in 95%
2.4.4. DPPH Radical Scavenging Activity Assay. The DPPH radical scavenging assay was conducted following the method of Zhu et al. [16]. In brief, 2 mL of DPPH solution (0.1 mM, in methanol) was blended with 2 mL of the samples at varying concentrations (50, 100, 150, 200, 250, and 300𝜇g/mL). As the next stage, the reaction mixture was shaken and incubated in the dark at room temperature for 30 min, and the absorbance was read at 517 nm against the blank. Ascorbic acid and rutin standard as positive controls were prepared in a similar manner, as for the test group except for the antioxidant solution’s replacement. The inhibition of the DPPH radical by the sample was calculated based on the formula below:
DPPH scavenging activity(%)
= [(absorbance of control( −absorbance of sample)
absorbance of control) ]
× 100.
(1)
2.4.5. Superoxide Anion Radical Scavenging Assay. The assay
for superoxide anion radical scavenging activity leaned on a riboflavin-light-NBT system [17]. The reaction mix-ture had 0.5 mL of phosphate buffer (50 mM, pH 7.6), 0.3 mL riboflavin (50 mM), 0.25 mL phenazine methosul-phate (PMS) (20 mM), and 0.1 mL nitro blue tetrazolium (NBT) (0.5 mM), before 1 mL sample solution was added at varying concentrations (50, 100, 150, 200, 250, and 300𝜇g/mL). Reaction began as the reaction mixture was illuminated with different concentrations of the extracts using a fluorescent lamp. After 20 min of incubation, the absorbance was measured at 560 nm. Ascorbic acid was used as standard. The percentage of inhibition of superoxide anion generation was calculated based on the following formula:
Scavenging activity(%)
= (1 − absorbance of sample
absorbance of control) × 100.
(2)
2.4.6. ABTS Radical Scavenging Assay. The ABTS radical
scavenging assay was performed adhering to the method of Re et al. [18] with slight modification. The ABTS radical was generated through the oxidation of ABTS with potassium persulfate. In brief, the ABTS solution (7 mM) had reacted with potassium persulfate (2.45 mM) solution and was stored in the dark for 12–16 h to produce a dark coloured solution containing ABTS radical cation. Before being used in the assay, the ABTS radical cation was diluted with 50% methanol for an initial absorbance of about 0.70 (±0.02) at 745 nm, with the temperature control fixed as 30∘C. Free radical scavenging activity was evaluated by mixing 3 mL of ABTS working standard with 300𝜇L of test sample (50, 100, 150, 200, 300, 400, and 500𝜇g/mL) in a microcuvette. The decrease in the absorbance was measured at the exact time of 1 min after mixing the solution until it reached 6 min. The final
absorbance was noted then. The inhibition percentage was calculated based on the following formula:
Scavenging effect(%)
= [(absorbance of control−absorbance of sample) (absorbance of control) ]
× 100.
(3)
2.4.7. Hydrogen Peroxide Scavenging Activity. The capability
of scavenging hydrogen peroxide by the extract was deter-mined based on the method of Ruch et al. [19]. A hydrogen peroxide solution (2 mM) was prepared in 50 mM phosphate buffer (pH 7.4). Aliquots (0.1 mL) of the extracted sample (dif-ferent concentration of 50, 100, 150, 200, 250, and 300𝜇g/mL) were transferred into the test tubes and their volumes were made up to 0.4 mL with 50 mM phosphate buffer (pH 7.4). After adding 0.6 mL hydrogen peroxide solution, tubes were vortexed and the absorbance of the hydrogen peroxide at 230 nm was determined after 10 min, against a blank. The abilities to scavenge the hydrogen peroxide were calculated based on the following equation:
Hydrogen peroxide scavenging activity
= (1 − absorbance of sample
absorbance of control) × 100.
(4)
2.4.8. Reducing Power Assay. The reducing powers of the
samples were determined following the method of Atmani et al. [20]. Two millilitres of each extract solution (300𝜇g/mL) was mixed with 2 mL of phosphate buffered saline (0.2 M, pH 6.6) and 2 mL of potassium ferrocyanate (10 mg/mL). The incubation for this mixture was set at 50∘C for 20 min. In the next stage, 2 mL of trichloroacetic acid (100 mg/L) was added to the mixture. In a test tube, a volume of 2 mL from each of the above mixtures was mixed with 2 mL of distilled water and 0.4 mL of 0.1% (w/v) ferric chloride. The absorbance was measured at 700 nm after reaction was started for 10 minutes. The increased absorbance of the reaction mixture suggested that the reducing power was high.
2.4.9. Chelating Power. The ability of the extract to chelate
iron (II) was estimated based on the method of Dinis et al. [21] with minimal modification. Various sample solutions (50–300𝜇g/mL) were prepared with dissolving the extracts in the methanol. An aliquot of each sample (200𝜇L) was mixed with 100𝜇L of FeCl2⋅2H2O (2 mM) and 900𝜇L of methanol. After 5 min incubation, an initial reaction was fuelled by the addition of 400𝜇L of ferrozine (5 mM). After 10 min incubation, the absorbance at 562 nm was recorded. The percentage of the chelating activity was calculated based on the following equation:
Chelating activity(%)
= [(absorbance of control( −absorbance of sample)
absorbance of control) ]
× 100.
Table 1: Total phenolic, total flavonoid, and extraction yield of methanol extract and soluble fractions ofin vivoandin vitrogrown plants (aerial parts) and also callus tissue ofTrifolium pretense.
Plant extract Total phenolic
(mg gallic acid/g dry sample)
Total flavonoid
(mg rutin equivalent/g dry sample)
Extraction yield (%) In vivo
Methanol extract 46.88±1.07a 26.61±0.92a 13.89±0.54a
n-Hexane fraction 30.52±0.72cd 16.06±1.58d 10.79±0.59c
Ethyl acetate fraction 27.57±0.49e 11.71±1.43fg 6.39±1.12e
Chloroform fraction 40.17±0.88b 19.56±1.11b 12.23±0.54b
In vitro
Methanol extract 31.94±1.68c 13.03±0.79ef 10.84±0.72c
n-Hexane fraction 20.06±0.41g 8.23±0.96h 5.20±0.54f
Ethyl acetate fraction 16.90±1.19h 6.11±0.79i 2.35±0.5g
Chloroform fraction 25.43±0.87f 10.39±0.79g 7.18±0.82e
Callus
Methanol extract 40.82±1.5b 17.84±0.53c 11.36±0.55bc
n-Hexane fraction 31.77±1.14c 12.70±0.94ef 6.13±0.34ef
Ethyl acetate fraction 19.23±0.66g 7.21±0.74hi 2.98±0.66g
Chloroform fraction 29.25±1.62de 14.02±1.08e 8.70±0.52d
Each value is represented as mean±SD (𝑛 = 3).
Means in the same column not sharing the same letters are significantly different at (Duncan)𝑃 < 0.05.
2.5. Statistical Analysis. All assays were carried out in
trip-licate and their results were expressed as mean±standard deviation. The EC50 (half-maximal effective concentration) of various fractions for different antioxidant assays were analysed using ANOVA test with least significant difference (LSD)𝑃 < 0.05as a level of significance. Experimental results were examined further for Pearson correlation coefficient of phenolic and flavonoids with different antioxidants assays and its significance was tested using Student’s t-test (𝑃 <
0.05).
3. Results and Discussion
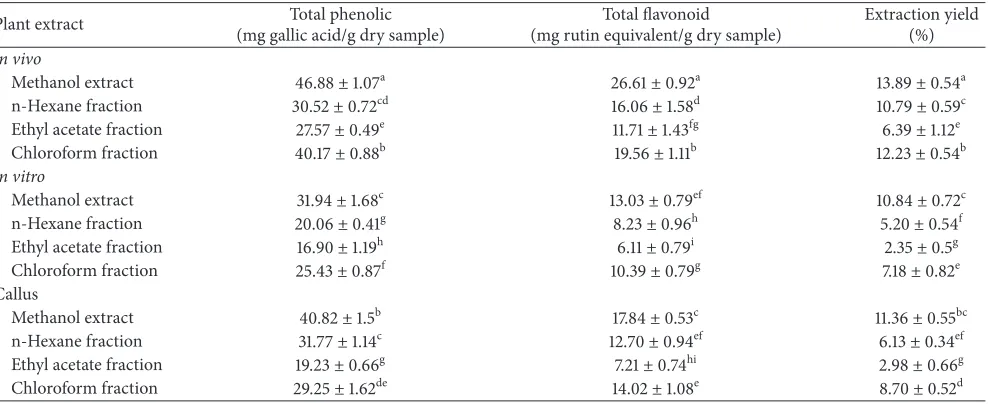
3.1. Total Phenolic, Total Flavonoid, and Extraction Yield.
Good extraction methods prove to be a crucial step for getting extracts with acceptable yields and strong antioxidant activity [22]. The percentage yields of the methanol extract and different fractions ofin vivoandin vitro grown plants as well as the callus tissue of red clover are shown inTable 1. The extraction yield of these samples came in a range from
2.35 ± 0.5% to13.89 ± 0.54%. The results showed that the methanol extraction ofin vivogrown plants had illustrated the highest amount of extraction yield, and conversely the extraction yield ofin vitrogrown plants with ethyl acetate was prominently lower (𝑃 < 0.05) when compared to that of the other samples. Being plant secondary metabolites, the phenolics or polyphenols are very important judging from the virtue of their antioxidant activities by chelating redox-active metal ions, inactivating lipid free radical chains, and avoiding the hydroperoxide conversions into reactive oxyradicals. The total phenolic contents of the extracts, expressed as gallic acid equivalents, varied from 46.88 ±
1.07mg GAE/g for the methanol extract of in vivo grown plants to16.9 ± 1.19mg GAE/g for the ethyl acetate extract of
in vitrogrown plants (Table 1). In allin vivoandin vitroplants
and also callus tissue, the methanolic extract had illustrated the highest total content of phenolic, whereas the content obtained with ethyl acetate was much lower (𝑃 < 0.05), which is similar to the reports compiled by Sahreen et al. [23] and Ao et al. [24]. A possible justification would be due to the formation of complexes by a part of phenolic compounds with carbohydrates and proteins, which are more extractable in methanol than in other solvents that have been emphasized in this study. Our results do not deviate from those of Parsaeimehr et al. [25] who also found that wild plant, compared to the callus tissue, showed higher extracting phenolic components with regard to some medicinal plants. The rich-flavonoid plants could manifest themselves as good sources of antioxidants that would assist in the enhancement of the overall antioxidant capacity of an organism and protection against lipid peroxidation [26]. The content of total flavonoids is expressed as mg of rutin equivalents per g of dry sample that ranged from 6.11 ± 0.79 to26.61 ± 0.92, the amounts of which were comparable with results verified in the literatures for other extracts produced [24, 27]. The methanol extract of in vivo grown red clover significantly contained (𝑃 < 0.05) higher flavonoids concentration as compared to other samples involved. The lowest flavonoid value in this study was recorded in ethyl acetate fraction of
in vitro grown plants (6.11 ± 0.79mg CTE/g dry sample).
The total flavonoid content results were entirely synchronous with those of the total phenolic. It was successfully shown that samples with high level of phenolic content also contain flavonoids in great amount. The rich-flavonoid plants could be a good antioxidant source that would help increase the overall antioxidant capacity of an organism and guard it against lipid peroxidation [26].
3.2. DPPH Radical Scavenging Activity.
0 10 20 30 40 50 60 70 80 90 100
0 50 100 150 200 250 300 350
DPPH % s
ca
veng
ing
Methanol Hexane Ethyl acetate
Chloroform Ascorbic acid
Concentration (𝜇g/mL)
(a)
Methanol Hexane Ethyl acetate
Chloroform Ascorbic acid 0
10 20 30 40 50 60 70 80 90 100
0 50 100 150 200 250 300 350
D
PPH % s
ca
ven
gin
g
Concentration (𝜇g/mL)
(b)
Methanol Hexane Ethyl acetate
Chloroform Ascorbic acid 0
20 40 60 80 100 120
0 50 100 150 200 250 300 350
D
PPH % s
ca
ven
gin
g
Concentration (𝜇g/mL)
[image:5.600.62.535.68.454.2](c)
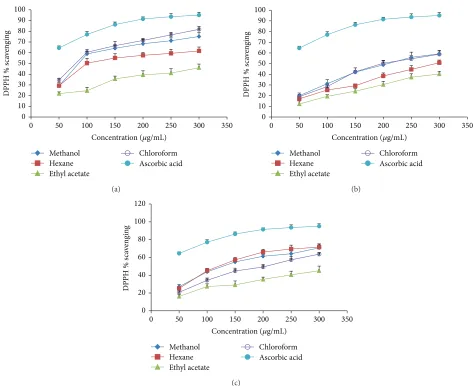
Figure 1: DPPH radical scavenging activity of different extracts from the methanol extract ofTrifolium pratenseby different solvent at different concentration. (a)In vivogrown plants, (b)in vitrogrown plants, and (c) callus tissue. Each value is represented as mean±SD (𝑛 = 3).
absorption band at 517 nm. It loses this absorption when it accepts an electron or a free radical species, resulting in a visually noticeable discoloration from purple to yellow. It can incorporate many samples in a short time span and is vulnerable enough to distinguish active ingredients at low concentrations [28]. Figure 1 highlights the DPPH radical scavenging ability ofin vivo,in vitro,and callus samples with different extraction solvents. The differential scavenging activities of the extract against the DPPH system that has been observed could be explained by the presence of different compounds in the fractions. The chloroform fraction ofin vivo grown plants showed a reading of the lowest EC50 of DPPH radical scavenging (81.04 ± 2.33 𝜇g/mL), while the highest EC50 belonged to the ethyl acetate fraction of in
vitro grown plants (≫300𝜇g/mL) (Table 2). Although the
DPPH radical scavenging activities of the fractions were less (𝑃 < 0.05) than those of the ascorbic acid, the study had made a disclosure thatin vivogrown plants and callus tissue of red clover have free radical scavengers or inhibitors, possibly acting as primary antioxidants more thanin vitro
grown red clover. There was an observation on a similar trend in a study of the antioxidant activity of theArtemisia
judaicaL. extract [29].
3.3. Superoxide Radical Scavenging Activity. As it is a reactive
Table 2: DPPH radical scavenging activity of methanol extract and soluble fractions ofin vivoandin vitrogrown plants and callus tissue of red clover (Trifolium pratense).
Plant extract EC50of DPPH radical scavenging activity (𝜇g/mL)
In vivo In vitro Callus
Methanol extract 94.25 ± 1.15c∗ 205.47 ± 2.90b∗∗∗ 128.42 ± 2.40𝑐∗∗
n-Hexane fraction 131.42 ± 3.20d∗∗ 291.95 ± 2.98c∗∗∗ 120.74 ± 3.45b∗
Ethyl acetate fraction >300e∗ ≫300d∗∗∗ >300e∗∗
Chloroform fraction 81.04 ± 2.33b∗ 208.86 ± 2.20b∗∗∗ 155.17 ± 2.80d∗∗
Ascorbic acid 21.17 ± 0.76a 21.17 ± 0.76a 21.17 ± 0.76a
Each value in the table is represented as mean±SD (𝑛 = 3).
Means not sharing the same symbols (∗,∗∗, and∗ ∗ ∗) are significantly different (Duncan) at𝑃 < 0.05in the same row. Means not sharing the same letters are significantly different (Duncan) at𝑃 < 0.05in the same column.
0 10 20 30 40 50 60 70 80 90 100
0 50 100 150 200 250 300 350
Su
p
er
o
xide % s
ca
ven
gin
g
Concentration (𝜇g/mL)
Methanol Hexane Ethyl acetate
Chloroform Ascorbic acid
(a)
0 10 20 30 40 50 60 70 80 90 100
0 50 100 150 200 250 300 350
Su
p
er
o
xide % s
ca
ven
gin
g
Concentration (𝜇g/mL)
Methanol Hexane Ethyl acetate
Chloroform Ascorbic acid
(b)
0 10 20 30 40 50 60 70 80 90 100
0 50 100 150 200 250 300 350
Su
p
er
o
xide % s
ca
ven
gin
g
Concentration (𝜇g/mL)
Methanol Hexane Ethyl acetate
Chloroform Ascorbic acid
(c)
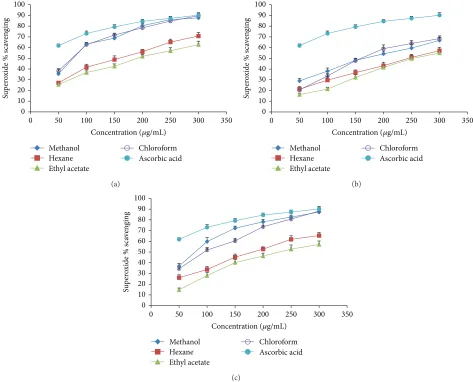
Figure 2: Superoxide radical scavenging activity of different extracts from the methanol extract ofTrifolium pratenseby different solvent at different concentration. (a)In vivogrown plants, (b)in vitrogrown plants, and (c) callus tissue. Each value is represented as mean±SD (𝑛 = 3).
on the superoxide radicals. Nonetheless, when compared to the ascorbic acid, the superoxide scavenging activities of the extracts were found to be significantly lower (𝑃 < 0.05). This could be due to the presence of flavonoids and other antioxidants in the extract.
3.4. ABTS Radical Scavenging Activity. The ABTS radical
[image:6.600.62.535.233.615.2]Table 3: Superoxide anion activity of methanol extract and soluble fractions ofin vivoandin vitrogrown plants and callus tissue of red clover (Trifolium pratense).
Plant extract EC50of superoxide anion activity (𝜇g/mL)
In vivo In vitro Callus
Methanol extract 74.68 ± 1.59c∗ 179.77 ± 1.60c∗∗ 74.36 ± 1.42b∗
n-Hexane fraction 139.83 ± 2.40d∗ 246.59 ± 2.09d∗∗∗ 190.06 ± 2.56d∗∗
Ethyl acetate fraction 201.55 ± 1.94e∗ 260.01 ± 1.46e∗∗∗ 228.41 ± 1.52e∗∗
Chloroform fraction 70.69 ± 1.76b∗ 155.91 ± 1.73b∗∗∗ 104.32 ± 1.45c∗∗
Ascorbic acid 23.44 ± 0.84a 23.44 ± 0.84a 23.44 ± 0.84a
Each value in the table is represented as mean±SD (𝑛 = 3).
Means not sharing the same symbols (∗,∗∗, and∗ ∗ ∗) are significantly different (Duncan) at𝑃 < 0.05in the same row. Means not sharing the same letters are significantly different (Duncan) at𝑃 < 0.05in the same column.
Table 4: ABTS radical scavenging of methanol extract and soluble fractions ofin vivoandin vitrogrown plants and callus tissue of red clover (Trifolium pratense).
Plant extract EC50of ABTS (𝜇g/mL)
In vivo In vitro Callus
Methanol extract 111.84 ± 1.46b∗ 351.46 ± 2.02c∗∗∗ 164.32 ± 1.61b∗∗
n-Hexane fraction 210.76 ± 1.71d∗ >500d∗∗∗ 225.63 ± 2.05d∗∗
Ethyl acetate fraction >500e∗ ≫500e∗∗∗ >500e∗∗
Chloroform fraction 122.34 ± 2.29c∗ 297.68 ± 1.68b∗∗∗ 172.18 ± 1.55c∗∗
Ascorbic acid 34.67 ± 0.53a 34.67 ± 0.53a 34.67 ± 0.53a
Each value in the table is represented as mean±SD (𝑛 = 3).
Means not sharing the same symbols (∗,∗∗, and∗ ∗ ∗) are significantly different (Duncan) at𝑃 < 0.05in the same row. Means not sharing the same letters are significantly different (Duncan) at𝑃 < 0.05in the same column.
as follows:in vivo>callus>in vitrosamples. The methanol extract of in vivo grown samples had demonstrated the highest radical scavenging activity when it reacted with the ABTS radicals. By contrast, the ethyl acetate fraction ofin
vivo, in vitro, and callus samples and also the n-hexane
fraction ofin vitrosamples did not illustrate any leveling effect at the highest concentration, but it was a fact that their radical scavenging effects were much less (𝑃 < 0.05) than that of the other extracts tested (Table 4). Significant differences among the EC50values of all the fractions and ascorbic acid had also been noted (𝑃 < 0.05).
3.5. Hydrogen Peroxide. While hydrogen peroxide itself is
not very reactive, it can sometimes be poisonous to cells, since it may trigger the rise of hydroxyl radicals inside the cell [32]. Extracts from in vivo and in vitro grown plants as well as callus tissue of red clover had the capability to scavenge hydrogen peroxide in a concentration dependent manner (50–300𝜇g/mL). The hydrogen peroxide scavenging activities ofin vivogrown samples were proven to be more effective (𝑃 < 0.05) than the in vitro grown and callus samples, as revealed by the comparison with the EC50values. The chloroform fraction and methanol extract were found to be more efficient (𝑃 < 0.05) than those of the n-hexane and ethyl acetate fractions. EC50values of all the extracts, in scavenging abilities on hydrogen peroxide, were remarkably different (𝑃 < 0.05) from the EC50 value that had been obtained for ascorbic acid (Table 5).
3.6. Chelating Activity. Ability to chelate or deactivate
tran-sition metals, which in turn has the ability to catalyze hydroperoxide decomposition and Fenton-type reactions, is a vital mechanism of antioxidant activity. It was thus considered of importance to screen the iron (II) chelating ability of extracts [27]. All the fractions had ferrous ion chelating activity but they were remarkably low (𝑃 < 0.05) in comparison to catechin. The sequence for the chelating power wasin vivogrown samples>callus tissue of samples
>in vitrogrown samples. The highest chelating power was
shown by the methanol extract ofin vivogrown plants with the EC50 value of49.11 ± 0.97 𝜇g/mL, whilst the lowest was found in ethyl acetate fraction ofin vitrogrown samples with the EC50 value of 183.44 ± 2.48 𝜇g/mL (Table 6). The ion chelating data with different measurements of concentrations (50–300𝜇g/mL) suggested that ferrous ion chelating effects of all the fractions ofin vivoandin vitrogrown plants as well as callus tissue of red clover would be rather advantageous to offer protection against oxidative damage.
3.7. Reducing Power Activity. The reducing power of the
[image:7.600.51.550.261.351.2]Table 5: Hydrogen peroxide scavenging of methanol extract and soluble fractions ofin vivoandin vitrogrown plants and callus tissue of red clover (Trifolium pratense).
Plant extract EC50of hydrogen peroxide (𝜇g/mL)
In vivo In vitro Callus
Methanol extract 103.44 ± 1.47c∗ 219.86 ± 1.57b∗∗∗ 141.74 ± 1.93c∗∗
n-Hexane fraction 270.56 ± 1.72e∗ ≫300e∗∗∗ 287.63 ± 1.59e∗∗
Ethyl acetate fraction 138.16 ± 1.93d∗∗ >300d∗∗∗ 132.26 ± 2.03b∗
Chloroform fraction 88.35 ± 1.27b∗ 231.49 ± 2.02c∗∗∗ 146.31 ± 1.67d∗∗
Ascorbic acid 26.84 ± 0.83a 26.84 ± 0.83a 26.84 ± 0.83a
Each value in the table is represented as mean±SD (𝑛 = 3).
Means not sharing the same symbols (∗,∗∗, and∗ ∗ ∗) are significantly different (Duncan) at𝑃 < 0.05in the same row. Means not sharing the same letters are significantly different (Duncan) at𝑃 < 0.05in the same column.
Table 6: Chelating activity of methanol extract and soluble fractions ofin vivoandin vitrogrown plants and callus tissue of red clover (Trifolium pratense).
Plant extract EC50of chelating power (𝜇g/mL)
In vivo In vitro Callus
Methanol extract 49.11 ± 0.97b∗ 142.87 ± 1.71c∗∗∗ 72.56 ± 1.16d∗∗
n-Hexane fraction 52.33 ± 1.97c∗ 131.84 ± 2.05b∗∗∗ 67.52 ± 2.15c∗∗
Ethyl acetate fraction 105.67 ± 1.56e∗ 183.44 ± 2.48e∗∗∗ 118.23 ± 2.02e∗∗
Chloroform fraction 86.32 ± 1.89d∗∗ 161.75 ± 1.36d∗∗∗ 60.17 ± 1.42b∗
Catechin 22.76 ± 0.37a 22.76 ± 0.37a 22.76 ± 0.37a
Each value in the table is represented as mean±SD (𝑛 = 3).
Means not sharing the same symbols (∗,∗∗, and∗ ∗ ∗) are significantly different (Duncan) at𝑃 < 0.05in the same row. Means not sharing the same letters are significantly different (Duncan) at𝑃 < 0.05in the same column.
and Fe2+can be monitored through the measurement of the formation of Perl’s Prussian blue at 700 nm [33].
In the reducing power assay, the presence of reductants (antioxidants) in the fractions would bring about the reduc-tion of Fe+3/ferricyanide complex to the ferrous form by giving away an electron. Increasing the absorbance at 700 nm implies an increase in its ability to reduce. The sequence for this reducing power was as follows:in vivo samples > callus tissue>in vitrosamples of red clover. Some degrees of electron-donating capacity were found in all examined extracts. Among the examined extracts the methanol extract
ofin vivosamples showed the highest reducing power with
the absorbance of1.05 ± 0.07at 700 nm, so this extract could act as electron donors and also could convert free radicals to more stable products [34], although, in comparison with the positive control (ascorbic acid), it is significantly lower (Table 7).
3.8. Correlation with Antioxidant Activities and Phytochemical
Contents. Through the correlation analysis for
phytochemi-cal contents with EC50 values of radical scavenging activity and antioxidant ability of the extract of red clover and its various soluble fractions, the phenolic and flavonoid contents had exhibited excellent association with DPPH, superoxide, ABTS radical scavenging activities, and reducing power ofin
vivo,in vitro,and callus samples (Tables8,9, and10). Erkan et
al. [35] reported a close correlation between radical scaveng-ing activity and total phenolic content of extract from various natural sources. Moreover, for the in vivo samples, EC50
of hydrogen peroxide presented an important correlation with phenolics while nonsignificant with flavonoids, whereas for thein vitrosamples hydrogen peroxide demonstrated a remarkable correlation with both phenolics and flavonoids. Hydrogen peroxide of callus samples did not shed light on any correlation with phenolics and flavonoids. Chelating power ofin vivosamples pointed to a significant correlation with flavonoids but nonsignificant correlation with phenolics while for the callus samples it was found with both phe-nolics and flavonoids and for thein vitrosamples chelating power did not point to any correlation with phenolics and flavonoids. Our results are consistent with those found by Sahreen et al. [23] who reported that there is existence of a strong relationship between phytochemical contents and DPPH and superoxide and ABTS radical scavenging.
4. Conclusion
The present work shows the antioxidant effects of in vivo
and in vitro grown plants and callus tissues of red clover.
[image:8.600.51.552.261.351.2]Table 7: Reducing power of methanol extract and soluble fraction (300𝜇g/mL) ofin vivoandin vitrogrown plants and callus tissue of red clover (Trifolium pratense).
Plant extract Reducing power absorbance at 700 nm
In vivo In vitro Callus
Methanol extract 1.05 ± 0.07b∗ 0.72 ± 0.03b∗∗∗ 0.82 ± 0.03c∗∗
n-Hexane fraction 0.88 ± 0.04c∗ 0.52 ± 0.04c∗∗∗ 0.65 ± 0.02d∗∗
Ethyl acetate fraction 0.59 ± 0.03d∗ 0.38 ± 0.01d∗∗∗ 0.52 ± 0.03e∗∗
Chloroform fraction 0.95 ± 0.03c∗ 0.71 ± 0.04b∗∗ 0.91 ± 0.03b∗
Ascorbic acid 2.45 ± 0.03a 2.45 ± 0.03a 2.45 ± 0.03a
Each value in the table is represented as mean±SD (𝑛 = 3).
[image:9.600.52.291.269.397.2]Means not sharing the same symbols (∗,∗∗, and∗ ∗ ∗) are significantly different (Duncan) at𝑃 < 0.05in the same row. Means not sharing the same letters are significantly different (Duncan) at𝑃 < 0.05in the same column.
Table 8: Correlation between the antioxidant activity and total phe-nolic and flavonoid of the extract ofin vivogrownTrifolium pretense.
Assays
Correlation𝑅2 Total
flavonoid
Total phenolic DPPH radical scavenging activity 0.759∗∗ 0.745∗∗ Superoxide radical scavenging activity 0.856∗∗ 0.903∗∗ ABTS radical scavenging ability 0.814∗∗ 0.801∗∗ Hydrogen peroxide radical scavenging
activity 0.414 0.598
∗
Chelating power 0.670∗ 0.500
Reducing power 0.884∗∗ 0.861∗∗
∗∗Correlation is significant at the 0.01 level (2-tailed). ∗Correlation is significant at the 0.05 level (2-tailed).
Table 9: Correlation between the antioxidant activity and total phenolic and flavonoid of the extract of in vitro grown Trifolium pretense.
Assays
Correlation𝑅2 Total
flavonoid
Total phenolic DPPH radical scavenging activity 0.893∗∗ 0.876∗∗ Superoxide radical scavenging activity 0.793∗∗ 0.806∗∗ ABTS radical scavenging ability 0.825∗∗ 0.827∗∗ Hydrogen peroxide radical scavenging
activity 0.784
∗∗ 0.833∗∗
Chelating power 0.502 0.441
Reducing power 0.862∗∗ 0.862∗∗
∗∗Correlation is significant at the 0.01 level (2-tailed).
as a traditional medicine and food stuff in various parts of the world and that it can be used as an achievable source of natural antioxidants with consequent beneficial properties for health. There is indeed a pressing need to make available new plant-derived bioactive molecules; thus, red clover may be a great natural source for the establishment of new drugs. In earlier reports, such properties have been named as essential for the extracts of red clover [36]. Based on the results obtained, the extracts of callus tissue had demon-strated a strong antioxidant activity but the extract of aerial
Table 10: Correlation between the antioxidant activity and total phenolic and flavonoid of the extract of callus tissue of Trifolium pretense.
Assays
Correlation𝑅2 Total
flavonoid
Total phenolic DPPH radical scavenging activity 0.849∗∗ 0.822∗∗ Superoxide radical scavenging activity 0.912∗∗ 0.917∗∗ ABTS radical scavenging ability 0.903∗∗ 0.876∗∗ Hydrogen peroxide radical scavenging
activity 0.023 0.020
Chelating power 0.775∗∗ 0.734∗∗
Reducing power 0.777∗∗ 0.753∗∗
∗∗Correlation is significant at the 0.01 level (2-tailed).
parts of in vitro cultured red clover had demonstrated a lower antioxidant activity. Matsingou et al. [37] have reported that the differences in antioxidant properties of plants in varying biological systems may be explained by the presence of different substrates and also by the variable nature of product produced by the reaction system. It was observed that, due to a variety of antioxidant compounds present in red clover, the activity of the extract was attributed to the samples extraction method and the assay method.
Our primary finding of this work was that extract of
in vitro culture of red clover, especially the callus tissue,
possesses an antioxidant activity comparable to thein vivo
cultured plants’ extract. It can be concluded that in vitro
cultured plants are able to produce and accumulate many medicinally valuable secondary metabolites.
Conflict of Interests
The authors declare that there is no conflict of interests regarding the publication of this paper.
Acknowledgment
[image:9.600.311.551.278.407.2] [image:9.600.53.292.469.597.2]RP025-2012A) and for the facilities provided by the univer-sity.
References
[1] A. Y. Leung and S. Foster,Encyclopedia of Common Natural Ingredients Used in Food, Drugs, and Cosmetics, John Wiley & Sons, 1996.
[2] R. A. Dixon, “Phytoestrogens,”Annual Review of Plant Biology, vol. 55, pp. 225–261, 2004.
[3] J. Howes, M. Waring, L. Huang, and L. G. Howes, “Long-term pharmacokinetics of an extract of isoflavones from red clover (Trifolium pratense),”The Journal of Alternative & Complemen-tary Medicine, vol. 8, no. 2, pp. 135–142, 2002.
[4] N. M. M. Saviranta, M. J. Anttonen, A. von Wright, and R. O. Karjalainen, “Red clover (Trifolium pratenseL.) isoflavones: determination of concentrations by plant stage, flower colour, plant part and cultivar,” Journal of the Science of Food and Agriculture, vol. 88, no. 1, pp. 125–132, 2008.
[5] N. L. Booth, C. R. Overk, P. Yao et al., “Seasonal variation of red clover (Trifolium pratenseL., Fabaceae) isoflavones and estrogenic activity,”Journal of Agricultural and Food Chemistry, vol. 54, no. 4, pp. 1277–1282, 2006.
[6] D. S. Fabricant and N. R. Farnsworth, “The value of plants used in traditional medicine for drug discovery,”Environmental Health Perspectives, vol. 109, supplement 1, pp. 69–75, 2001. [7] T. Finkel and N. J. Holbrook, “Oxidants, oxidative stress and the
biology of ageing,”Nature, vol. 408, no. 6809, pp. 239–247, 2000. [8] D. M. Hockenbery, Z. N. Oltvai, X.-M. Yin, C. L. Milliman, and S. J. Korsmeyer, “Bcl-2 functions in an antioxidant pathway to prevent apoptosis,”Cell, vol. 75, no. 2, pp. 241–251, 1993. [9] I. T. Johnson, G. Williamson, and S. R. Musk, “Anticarcinogenic
factors in plant foods: a new class of nutrients?” Nutrition Research Reviews, vol. 7, no. 1, pp. 175–204, 1994.
[10] L. O. Dragsted, M. Strube, and J. C. Larsen, “Cancer-protective factors in fruits and vegetables: biochemical and biological background,”Pharmacology & Toxicology, vol. 72, supplement 1, pp. 116–135, 1993.
[11] Y. Hanasaki, S. Ogawa, and S. Fukui, “The correlation between active oxygens scavenging and antioxidative effects of flavonoids,”Free Radical Biology and Medicine, vol. 16, no. 6, pp. 845–850, 1994.
[12] G. D. Stoner and H. Mukhtar, “Polyphenols as cancer chemo-preventive agents,”Journal of Cellular Biochemistry, vol. 59, no. S22, pp. 169–180, 1995.
[13] H. Y. Kil, E. S. Seong, B. K. Ghimire et al., “Antioxidant and anti-microbial activities of crude sorghum extract,”Food Chemistry, vol. 115, no. 4, pp. 1234–1239, 2009.
[14] V. Dewanto, W. Xianzhong, K. K. Adom, and R. H. Liu, “Thermal processing enhances the nutritional value of tomatoes by increasing total antioxidant activity,”Journal of Agricultural and Food Chemistry, vol. 50, no. 10, pp. 3010–3014, 2002. [15] J. Zhishen, T. Mengcheng, and W. Jianming, “The determination
of flavonoid contents in mulberry and their scavenging effects on superoxide radicals,”Food Chemistry, vol. 64, no. 4, pp. 555– 559, 1999.
[16] K. Zhu, H. Zhou, and H. Qian, “Antioxidant and free radical-scavenging activities of wheat germ protein hydrolysates (WGPH) prepared with alcalase,”Process Biochemistry, vol. 41, no. 6, pp. 1296–1302, 2006.
[17] C. Beauchamp and I. Fridovich, “Superoxide dismutase: improved assays and an assay applicable to acrylamide gels,” Analytical Biochemistry, vol. 44, no. 1, pp. 276–287, 1971. [18] R. Re, N. Pellegrini, A. Proteggente, A. Pannala, M. Yang, and C.
Rice-Evans, “Antioxidant activity applying an improved ABTS radical cation decolorization assay,”Free Radical Biology and Medicine, vol. 26, no. 9-10, pp. 1231–1237, 1999.
[19] R. J. Ruch, S.-J. Cheng, and J. E. Klaunig, “Prevention of cytotoxicity and inhibition of intercellular communication by antioxidant catechins isolated from Chinese green tea,” Carcino-genesis, vol. 10, no. 6, pp. 1003–1008, 1989.
[20] D. Atmani, N. Chaher, M. Berboucha et al., “Antioxidant capacity and phenol content of selected Algerian medicinal plants,”Food Chemistry, vol. 112, no. 2, pp. 303–309, 2009. [21] T. C. P. Dinis, V. M. C. Madeira, and L. M. Almeida, “Action
of phenolic derivatives (acetaminophen, salicylate, and 5-aminosalicylate) as inhibitors of membrane lipid peroxidation and as peroxyl radical scavengers,”Archives of Biochemistry and Biophysics, vol. 315, no. 1, pp. 161–169, 1994.
[22] A. Moure, J. M. Cruz, D. Franco et al., “Natural antioxidants from residual sources,”Food Chemistry, vol. 72, no. 2, pp. 145– 171, 2001.
[23] S. Sahreen, M. R. Khan, and R. A. Khan, “Evaluation of antioxidant activities of various solvent extracts of Carissa opaca fruits,”Food Chemistry, vol. 122, no. 4, pp. 1205–1211, 2010. [24] C. Ao, A. Li, A. A. Elzaawely, T. D. Xuan, and S. Tawata, “Evaluation of antioxidant and antibacterial activities ofFicus microcarpaL. fil. extract,”Food Control, vol. 19, no. 10, pp. 940– 948, 2008.
[25] A. Parsaeimehr, E. Sargsyan, and K. Javidnia, “A comparative study of the antibacterial, antifungal and antioxidant activity and total content of phenolic compounds of cell cultures and wild plants of three endemic species of Ephedra,”Molecules, vol. 15, no. 3, pp. 1668–1678, 2010.
[26] F. Sharififar, G. Dehghn-Nudeh, and M. Mirtajaldini, “Major flavonoids with antioxidant activity fromTeucrium poliumL.,” Food Chemistry, vol. 112, no. 4, pp. 885–888, 2009.
[27] R. Manian, N. Anusuya, P. Siddhuraju, and S. Manian, “The antioxidant activity and free radical scavenging potential of two different solvent extracts of Camellia sinensis(L.) O. Kuntz, Ficus bengalensisL. andFicus racemosaL.,”Food Chemistry, vol. 107, no. 3, pp. 1000–1007, 2008.
[28] Y. C. Hseu, W. H. Chang, C. S. Chen et al., “Antioxidant activities ofToona Sinensis leaves extracts using different antioxidant models,”Food and Chemical Toxicology, vol. 46, no. 1, pp. 105– 114, 2008.
[29] S.-C. Liu, J.-T. Lin, C.-K. Wang, H.-Y. Chen, and D.-J. Yang, “Antioxidant properties of various solvent extracts from lychee (Litchi chinenesisSonn.) flowers,”Food Chemistry, vol. 114, no. 2, pp. 577–581, 2009.
[30] T. Vani, M. Rajani, S. Sarkar, and C. J. Shishoo, “Antioxidant properties of the ayurvedic formulation triphala and its con-stituents,”Pharmaceutical Biology, vol. 35, no. 5, pp. 313–317, 1997.
[31] A. A. Adedapo, F. O. Jimoh, S. Koduru, P. J. Masika, and A. J. Afolayan, “Evaluation of the medicinal potentials of the methanol extracts of the leaves and stems ofHalleria lucida,” Bioresource Technology, vol. 99, no. 10, pp. 4158–4163, 2008. [32] B. Halliwell, “The biological toxicity of free radicals and other
[33] Y. Qingming, P. Xianhui, K. Weibao et al., “Antioxidant activities of malt extract from barley (Hordeum vulgareL.) toward various oxidative stress in vitro and in vivo,”Food Chemistry, vol. 118, no. 1, pp. 84–89, 2010.
[34] G.-C. Yen and H.-Y. Chen, “Antioxidant activity of various tea extracts in relation to their antimutagenicity,” Journal of Agricultural and Food Chemistry, vol. 43, no. 1, pp. 27–32, 1995. [35] N. Erkan, G. Ayranci, and E. Ayranci, “Antioxidant activities of rosemary (Rosmarinus OfficinalisL.) extract, blackseed (Nigella sativa L.) essential oil, carnosic acid, rosmarinic acid and sesamol,”Food Chemistry, vol. 110, no. 1, pp. 76–82, 2008. [36] G. T. Kroyer, “Red clover extract as antioxidant active and
functional food ingredient,”Innovative Food Science & Emerging Technologies, vol. 5, no. 1, pp. 101–105, 2004.
Submit your manuscripts at
http://www.hindawi.com
Hindawi Publishing Corporation
http://www.hindawi.com Volume 2014
Anatomy
Research International
Peptides
Hindawi Publishing Corporation
http://www.hindawi.com Volume 2014
Hindawi Publishing Corporation http://www.hindawi.com
International Journal of
Volume 2014
Zoology
Hindawi Publishing Corporation
http://www.hindawi.com Volume 2014
Molecular Biology International
Genomics
International Journal of
Hindawi Publishing Corporation
http://www.hindawi.com Volume 2014
The Scientific
World Journal
Hindawi Publishing Corporation
http://www.hindawi.com Volume 2014
Hindawi Publishing Corporation
http://www.hindawi.com Volume 2014
Bioinformatics
Advances inMarine Biology
Journal ofHindawi Publishing Corporation
http://www.hindawi.com Volume 2014
Hindawi Publishing Corporation
http://www.hindawi.com Volume 2014
Signal Transduction
Journal ofHindawi Publishing Corporation
http://www.hindawi.com Volume 2014
BioMed
Research International
Evolutionary Biology International Journal of
Hindawi Publishing Corporation
http://www.hindawi.com Volume 2014
Hindawi Publishing Corporation
http://www.hindawi.com Volume 2014 Biochemistry Research International
Archaea
Hindawi Publishing Corporation
http://www.hindawi.com Volume 2014
Hindawi Publishing Corporation
http://www.hindawi.com Volume 2014 Genetics
Research International
Hindawi Publishing Corporation
http://www.hindawi.com Volume 2014 Advances in
Virology
Hindawi Publishing Corporation http://www.hindawi.com
Nucleic Acids
Journal ofVolume 2014
Stem Cells
International
Hindawi Publishing Corporation
http://www.hindawi.com Volume 2014
Hindawi Publishing Corporation
http://www.hindawi.com Volume 2014
Enzyme
Research
Hindawi Publishing Corporation
http://www.hindawi.com Volume 2014