Technology (IJRASET)
Isolation and identification of ampicillin degrading
bacterial strain from soil sample
Gayatri Devi Singh1, Dr. K. C. Gupta2, Dr. Archana Shrivastav3 1&3
Department of Microbiology, College of Life Science, Cancer Hospital and Research Institute Gwalior, (M.P.) India
2
Department of Microbiology, VRG Girls College, Morar Gwalior, (M.P.) India
Abstract-The pharmaceutical compounds cause problems mainly in the terrestrial and aquatic environment. It is due to the accumulation of these compounds. The pharmaceutical compounds are converting into nontoxic compounds after
biodegradation by microorganisms. Ampicillin is a semisynthetic antibiotic and belongs to β-lactam group of antibiotic. The
ampicillin was degraded by bacterial isolates AMP6 and AMP8. The initial concentration was 50ppm of ampicillin for isolation of bacterial isolates. The isolates were identified as Ochrobacterum intermedium and Bacillus oceanisediminis respectively by using 16s RNA sequencing. The concentration ranging from 50 ppm to 500ppm of ampicillin was considered for its biodegradation. After 6 days of incubation at 400ppm the Ochrobacterum intermedium degraded 12.97±0.11% and the degradation by Bacillus oceanisediminis was noticed as 11.98±0.15 %.
Key words- Ampicillin, Ochrobacterum intermedium, Bacillus oceanisediminis, Biodegradation.
I. INTRODUCTION
Ampicillin is a semi-synthetic antibiotic belonging to the β-lactam group, which consist of β-lactam ring, It shows broad spectrum antibacterial activity against Gram positive bacterial and some Gram negative bacterial groups. The IUPAC name of ampicillin is (2S,5R,6R)-6-([(2R)-2-amino-2 phenylacetyl] amino)-3,3-dimethyl-7-oxo-4 thia-1 azabicyclo [3.2.0] heptane-2- carboxylic acid. After metabolism of ampicillin antibiotic compounds, in the different systems of animal and plant body, enter in the soil and aquatic ecosystem. The unused ampicillin also enters in different ecosystems. These, after accumulation in the soil as well as in aquatic environment, cause great threat to the environmental health. Biodegradation is performed by the natural microbial communities in which the complex organic molecules are fragmented. Maki et al.,(2006) noticed that the ampicillin, doxycillin, oxytetracycline, thiamphenicol, and josamycin antibiotics were microbial degraded in the marine sediments. Emolla et al., (2009) measured the biodegradation of ampicillin, amoxicillin and cloxacillin in the municipal waste water treatment plant. Zhang et al., (2010) studied the degradation of 11 antibiotics (ampicillin, cephalexin, sulfamethoxazole, sulfadiazine, norfloxacin, ciprofloxacin, ofloxacin, tetracycline, roxithromycin, anhydro-erythromycin and trimethoprim) in fresh water and saline sewage sludge. Al-Gheethi et al., (2014) isolated Bacillus subtilis 1556WTNC from treated sewage effluents for biodegradation of B-lactams antibiotics the penicillin (amoxicillin and ampicillin) in treated sewage effluents. Otto et al., (2015) performed the experiments for the bio-degradation of B-lactam antibiotic with the help of Staphylococcus aureus in waste water effluents by advanced oxidation process. The present has been focused on the biodegradation of ampicillin was studied up to 21 days. 11 isolates were observed but only two isolates, the
Ochrobacterum intermedium,Bacillus oceanisediminis, were capable of degrading at higher rate. II. MATERIAL AND METHOD
A. Sample collection
Samples collections were categorized in following methods.
B. Culture enrichment
Antibiotic was buried in soil at 10cm deep for approximately two months and required humidity for better growth was maintained in this duration. After this the soil samples were collected for microbial culture of the degrading microbes and this culture was used as enrichment of the inoculum for further studies.
C. Antibiotics samples
Technology (IJRASET)
Structure of Ampicillin
Chemical fomula: C16H19N3O4S
Molecular weight: 349.41g/mol
IUPAC name: (2S,5R,6R)-6-([(2R)-2-amino-2 phenylacetyl] amino)-3,3-dimethyl- 7-oxo-4 thia-1 azabicyclo [3.2.0] heptane-2- carboxylic acid.
D. Isolation of antibiotic degrading microbes
The antibiotic degrading microbes in the soil sample were isolated by applying shaker flask method. In the 250ml of Erlenmeyer flask 100ml sterile Muller Hinton broth medium and 5gram of soil sample was added. In this flask, antibiotic solution of the ampicillin was added, so as to maintain the final concentration of 50 ppm of antibiotic. Then it was incubated at 37℃for 15 days in shaker incubator controlled at 150 rpm and at 7pH. This broth was transferred on freshly prepared Muller Hinton Agar medium containing 50ppm concentration of antibiotics by spread plate method and was incubated at 37℃for 24 hrs. and pH was adjusted at 7. Antibiotics degradation capacity was determined by the method of Maki et al., (2006) and Al-Gheethi et al., (2014). In broth the mixed colony developed.
E. Pure colony selection
After incubation of mixed culture from the broth obtained as discuss above, the respective bacteria colony was separated individually by streaking bacterial culture on Mueller-Hinton agar medium containing 50ppm concentration of antibiotics. This process was repeated until purity of isolated bacterial colony was conformed. The pure bacterial strains were stocked in nutrient broth with 15% glycerol at -20℃ (Maki et al., 2006).
F. Identification of the Ampicillin degrading bacterial isolates
Identification of ampicillin degrading bacterial isolates was performed according to their morphological, biochemical and molecular characteristics as detailed below.
G. Morphological identification
The morphological identification of screened bacteria was performed with the help of Gram staining techniques, observed under light microscope by 100X oil immersion lance.
H. Biochemical identification
These three isolates were selected for further biochemical identification.
I. Catalase test
The catalase test used to detect the character of bacterial species on the basis of production ability of catalase enzyme. One drop of test culture was put on microscopic slide then few drops of 3% hydrogen peroxide were added. If gas bubbles appeared test was positive (Cheesbrough et al., 1985)
J. Oxidase test
Technology (IJRASET)
K. Urease test
Urease test is implemented for the determination of the production of urease enzyme by microorganism. The bacterial culture was incubated it at 35±2℃ for 24 hours, after incubation medium color changes from yellow to bright pink. The test was positive (Cheesbrough et al., 1985).
L. Hydrolysis of starch
This test is performed to detect the utilization of starch by the bacterial culture, which form the clear zone around the colony. After incubation of bacterial colony, the Lugols Iodine solutions was flooded on the plates and kept for 15-30 minutes. The clear zone observed around the colony confirms the positive test (Echford et al., 1927).
M. Hydrogen sulfide production test
The test was used for the production of the H2S by microorganisms, which imparts the black colour in the plates. The H2S production (black color formation in the medium along the line of stab inoculation) is the positive test of H2S production (Aneja, 2003).
N. Indole test
In this test, the test culture was inoculated in tryptone broth and incubated at 35℃ for 48 hrs. After incubation few drops of Kovac’s reagent were added. The appearance of pink color in broth is the positive to this test (Fellstrom et al., 1999).
O. Methyl Red and Voges-Proskaur test
The methyl red (MR) and the Voges-Proskaur (V-P) tests were used to differentiate two major types of facultative anaerobic enteric bacteria which produce a large amounts of acid and the neutral product acetoin as an end product. For the MR test the methyl red reagent was added to the culture and incubated at room temperature. It turns to red color is positive test. For the VP test alpha-naphthal and potassium hydroxide reagent was added and it was also incubated at room temperature, it turns to red color is positive test (Cheesbrough et al., 1985).
P. Liquefaction of gelatin Test
The bacteria produce a photolytic enzyme gelatinase, which hydrolyzed the gelatin. In this test nutrient gelatin in a deep tube was taken and inoculated the test culture in the tube. This was incubated at 35±2℃ for 24 hours then keep it at 4℃ for 30 minutes. Tubes with culture remained liquefied indicated the positive test (Blazevic and Ederer, 1975).
Q. Time study for the growth of antibiotics degrading bacteria
This study was executed for the maximum growth of ampicillin antibiotic degrading bacteria at different durations in Muller-Hinton medium containing 50ppm concentration of antibiotic. The pure bacterial isolate (from stocked culture) was streaked on petriplates containing Muller-Hinton agar medium. These petriplates were incubated at 37℃ for 24-48 hrs. After incubation one loop full of the pure colony, thus obtained, was inoculated in 5ml of Muller Hinton broth medium and incubated it at 37℃for 24 hrs. After incubation, 1ml bacterial culture was inoculated in 100ml Muller-Hinton broth medium containing 50ppm concentrations of ampicillin antibiotic and incubated in shaker incubator (150rpm) at 37℃ for 24 hrs. and pH was adjusted at 7. This process allowed for each bacterial isolates. For this study the control was served without inoculum for every experiment. The determination of bacterial growth through UV/Vis (Ultra violet/visible) spectrophotometer at 600nm after inoculation in Muller-Hinton broth medium at 0, 1, 2, 4, 6, 8, 10, 12, 14, 16, 18, 20 and 21 respectively .
R. Determination of antibiotics utilization by bacteria
Technology (IJRASET)
procedure applied for each isolate. In the control flask, culture was not inoculated. After incubation, bacterial growth was observed by spectrophotometer at 600nm of OD (optical density) in MH broth.
S. Screening and selection of potential antibiotics degrading bacteria
In this experiment the screening and then the potentiality for ampicillin antibiotic degradation was determined. The pure bacterial isolate (from stock culture) was streaked on MH agar medium and incubated it at 37℃ for 24-48 hrs. and 7 pH was maintained. After incubation, a pure bacterial isolate was inoculated in 10 ml MH broth medium tubes and incubated it at 37℃ for 24 hrs. After this incubation, 1ml culture was inoculated in 100ml Muller-Hinton broth medium containing 50ppm concentrations of ampicillin and incubated it at 37℃ at pH 7 for 24 hrs in shaker incubator (150 rpm). After the 24hrs. of incubation, 5ml of culture was transferred to 95 ml of Muller-Hinton broth medium containing different concentrations of ampicillin antibiotics 50ppm, 100ppm, 200ppm, 300ppm, 400ppm and 500ppm respectively. These flasks were incubated at 37℃ at 150rpm. Same procedure was applied for each bacterial isolates. In control flask, the culture was not inoculated. Bacterial growth was observed at 0, 1, 2, 3, 4, 5, 6, 7, 14, and 21 days by UV/Vis spectrophotometer at 600nm.
T. Quantitative analysis of degraded erythromycin by UV/Vis spectrophotometer
In this study the quantity of antibiotics remaining after degradation by bacterial isolates, with the help of UV/Vis spectrophotometer was detected. After selection of the isolates, the further study was performed with the help of isolates, which were able to grow in higher concentrations of AMP antibiotics. The pure bacterial isolate (from stock culture) was streaked on MH agar medium and incubated it at 37℃ for 24-48 hrs. After incubation, a pure bacterial isolate was inoculated in 10 ml MH broth medium tubes and incubated it at 37℃ for 24 hrs. After incubation, 1ml culture was inoculated in 100ml Muller-Hinton broth medium containing 50ppm concentrations of AMP antibiotic and incubated it at 37℃ at pH 7 for 24 hrs in shaker incubator (150 rpm). After incubation, 5ml of culture was transferred in 95 ml of Muller-Hinton broth medium containing the concentration of AMP antibiotic individually, at which the maximum growth of isolates was noticed and incubated at 37℃ in shaker incubator (150ppm) at 7 pH. This procedure was applied for each isolate. In the control flask culture was not inoculated, it was run parallel. After incubation the 15ml of culture was taken in test tube and filtered through 0.45µm pore size syringe filter paper. Samples were analyzed by UV/Vis spectrophotometer and OD values were compared with standard curve (prepared by standard concentration for each antibiotic).
III. RESULT AND DISCUSSION
A. Isolation of ampicillin degrading bacteria
In the present research work eleven bacterial colonies were isolated from enriched soil sample with ampicillin antibiotic by enrichment method with the help of shaker incubator at the 50ppm concentrations of ampicillin antibiotic. For the purification of all bacterial colonies were collected on Mueller-Hinton agar medium containing 50ppm concentration of ampicillin antibiotic. Bacterial colonies were able to grow on Mueller-Hinton agar and Mueller-Hinton broth medium containing 50ppm concentration of ampicillin antibiotic. These bacterial cultures were purified on Mueller-Hinton agar medium containing 50ppm concentration of ERY, then given different code name of isolates as AMP 1, AMP 2, AMP 3, AMP 4, AMP 5, AMP 6, AMP 7, AMP 8, AMP 9, AMP 10 and AMP 11. The pure bacterial strains were stocked in nutrient broth with 15% glycerol at -20℃. Out of eleven bacterial isolates two bacterial isolates showed degradation of ampicillin antibiotics.
B. Identification of the ampicillin degrading bacterial isolates
Technology (IJRASET)
[image:6.612.112.496.71.392.2]
Fig. 1: The different bacterial isolates on Nutrient agar medium in Fig A- AMP6= white circular colony at 370C and Fig. B- AMP8= Creamish round small colony at 370C. Gram staining image of the isolates under 100X oil immersion. Fig. C- ERY6 and AMP6; Gram negative, rod shaped. Fig. D- ERY11, AMP8 and OFL9; Gram positive, rod shaped.
2) Biochemical identification of isolates:
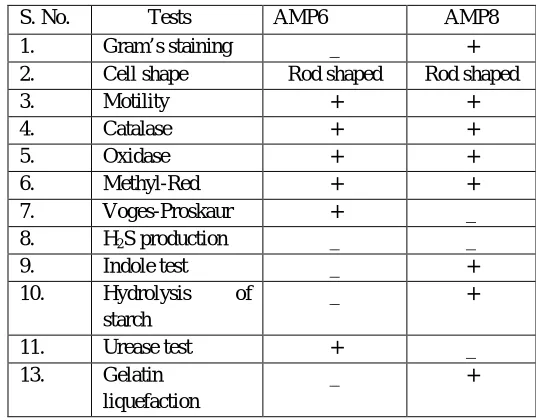
Table 1: Biochemical identification of two isolates AMP6 and AMP8.
S. No. Tests AMP6 AMP8
1. Gram’s staining _ +
2. Cell shape Rod shaped Rod shaped
3. Motility + +
4. Catalase + +
5. Oxidase + +
6. Methyl-Red + +
7. Voges-Proskaur + _
8. H2S production _ _
9. Indole test _ +
10. Hydrolysis of starch
_ +
11. Urease test + _
13. Gelatin liquefaction
_ +
C D
[image:6.612.170.438.491.701.2]Technology (IJRASET)
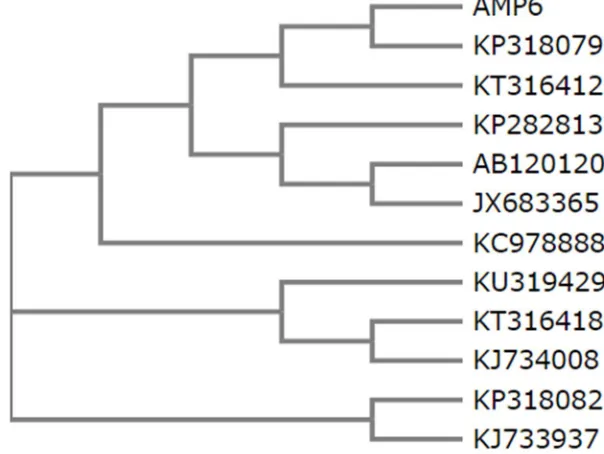
[image:7.612.146.448.146.373.2]3) Molecular identification: On the basis of morphological and biochemical characteristics the bacterial isolates AMP6 as a member of the genus Ochrobacterum and AMP8 as a member of the genus Bacillus. This was further confirmed by assembled 16S rRNA sequences analysis and identified as Ochrobacterum intermedium (AMP6) and Bacillus oceanisediminis (AMP8). Complete sequencing and phylogenetic tree of AMP6 and AMP8 are given below.
Fig. 2: Phylogenetic tree of AMP6 were conducted by MEGA4 software.
Fig. 3: Phylogenetic tree of AMP8 were conducted by MEGA4 software.
C. Time study for the growth of ampicillin degrading bacteria
[image:7.612.111.501.421.591.2]Technology (IJRASET)
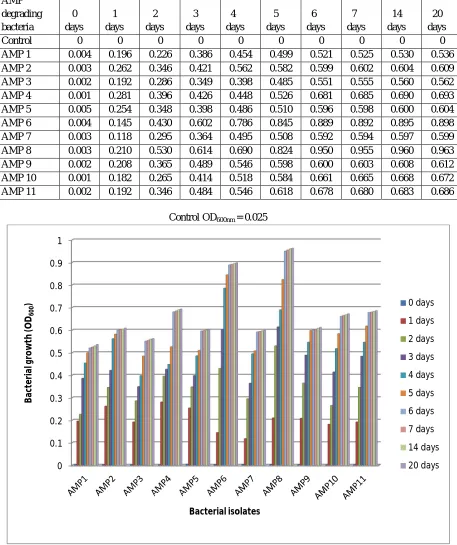
Table 2: Corrected OD600 of AMP degrading bacteria in Mueller-Hinton broth medium containing 50ppm AMP at different time interval (in days), incubated at 37℃, pH 7.0 and 150rpm at different time interval.
AMP degrading bacteria 0 days 1 days 2 days 3 days 4 days 5 days 6 days 7 days 14 days 20 days
Control 0 0 0 0 0 0 0 0 0 0
AMP 1 0.004 0.196 0.226 0.386 0.454 0.499 0.521 0.525 0.530 0.536 AMP 2 0.003 0.262 0.346 0.421 0.562 0.582 0.599 0.602 0.604 0.609 AMP 3 0.002 0.192 0.286 0.349 0.398 0.485 0.551 0.555 0.560 0.562 AMP 4 0.001 0.281 0.396 0.426 0.448 0.526 0.681 0.685 0.690 0.693 AMP 5 0.005 0.254 0.348 0.398 0.486 0.510 0.596 0.598 0.600 0.604 AMP 6 0.004 0.145 0.430 0.602 0.786 0.845 0.889 0.892 0.895 0.898 AMP 7 0.003 0.118 0.295 0.364 0.495 0.508 0.592 0.594 0.597 0.599 AMP 8 0.003 0.210 0.530 0.614 0.690 0.824 0.950 0.955 0.960 0.963 AMP 9 0.002 0.208 0.365 0.489 0.546 0.598 0.600 0.603 0.608 0.612 AMP 10 0.001 0.182 0.265 0.414 0.518 0.584 0.661 0.665 0.668 0.672 AMP 11 0.002 0.192 0.346 0.484 0.546 0.618 0.678 0.680 0.683 0.686
Control OD600nm = 0.025
Fig. 4: The growth of AMP degrading bacteria in Mueller-Hinton broth medium containing 50ppm AMP, at different time intervals (in days), incubated at 37℃, pH 7.0 and 150rpm.
D. Isolates utilizing the ampicillin antibiotic as a carbon and energy source
In this studies, the bacterial utilization of ampicillin as energy and carbon source for their metabolic activities, was recorded.
[image:8.612.77.534.119.664.2]Technology (IJRASET)
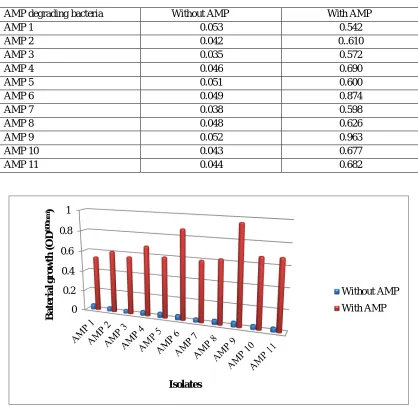
[image:9.612.97.515.182.589.2]Eleven bacterial isolates, which were observed, were separately inoculated in Muller-Hinton broth medium containing 50ppm AMP and incubated at 37oC, 150 rpm and at pH 7.0. After 6 days of incubation turbidity appeared in flasks containing 50ppm AMP but in control flask no growth were observed in which AMP (as energy and carbon source) was not added (Table 3, Fig. 5). The bacterial isolate Labrysportucolensis F11 was capable to use the fluoroquinolones antibiotics ciprofloxacin, ofloxacin and norfloxacin as carbon and energy source was reported by Amorim et al., (2014).
Table 3: Normal OD600 of AMP degrading bacteria in Muller-Hinton broth medium in the absence and presence of 50ppm AMP at different time interval (in days), incubated at 37℃, pH 7.0 and 150rpm after 6 days of incubation.
AMP degrading bacteria Without AMP With AMP
AMP 1 0.053 0.542
AMP 2 0.042 0..610
AMP 3 0.035 0.572
AMP 4 0.046 0.690
AMP 5 0.051 0.600
AMP 6 0.049 0.874
AMP 7 0.038 0.598
AMP 8 0.048 0.626
AMP 9 0.052 0.963
AMP 10 0.043 0.677
AMP 11 0.044 0.682
Fig. 5: Growth of AMP degrading bacteria in Muller-Hinton broth medium in the absence and presence of 50ppm AMP at different time interval (in days), incubated at 37℃, pH 7.0 and 150rpm after 6 days of incubation.
E. Screening and selection of ampicillin degrading bacteria
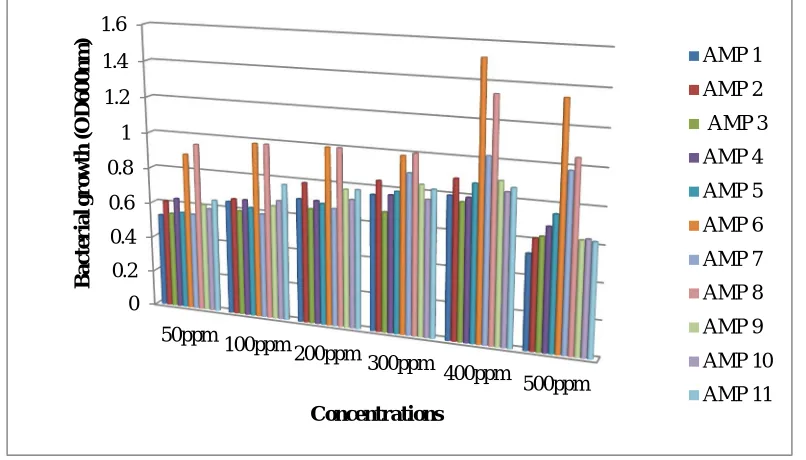
Out of eleven bacterial isolates obtained after inoculation in the MH medium, two bacterial isolates AMP 6 and AMP8 were selected on the basis of their growth at higher concentration, which was 400ppm of AMP. Above this concentration of AMP, the negative bacterial growth was noticed. In the present work, the higher growth was observed after 6 days of incubation. The corrected OD600nm of fifteen isolates with different concentrations of AMP ranging 50ppm to 500ppm (Table 4 and Fig. 6).
0 0.2 0.4 0.6 0.8 1
B
ate
r
ial
gr
o
w
th
(O
D
600n
m)
Isolates
Without AMP
Technology (IJRASET)
Table 4: Corrected OD600 of AMP degrading bacteria in Muller-Hinton broth medium with different concentration of AMP (50ppm to 500ppm) after 6 days incubation at 37℃, pH 7.0 and 150rpm.
AMP degrading bacteria
50ppm 100ppm 200ppm 300ppm 400ppm 500ppm
control 0 0 0 0 0 0
AMP 1 0.526 0.643 0.698 0.761 0.796 0.529
AMP 2 0.610 0.661 0.790 0.840 0.889 0.614
AMP 3 0.540 0.596 0.648 0.672 0.767 0.626
AMP 4 0.630 0.662 0.697 0.768 0.794 0.682
AMP 5 0.552 0.621 0.684 0.790 0.872 0.750
AMP 6 0.889 0.983 0.996 0.985 1.521 1.346
AMP 7 0.548 0.591 0.662 0.896 1.021 0.981
AMP 8 0.950 0.984 0.998 1.002 1.342 1.049
AMP 9 0.610 0.644 0.775 0.840 0.898 0.628
AMP 10 0.590 0.676 0.722 0.762 0.842 0.636
AMP 11 0.642 0.769 0.779 0.820 0.867 0.626
Control OD600nm -- 50ppm = 0.030, 100ppm =0.075, 200ppm = 0.086, 300ppm = 0.119, 400ppm = 0.166, and 500ppm = 0.223
Fig. 6: Growth of AMP degrading bacteria in Mueller-Hinton broth medium at different concentrations (50ppm to 500ppm) at 37℃, pH 7.0 and 150rpm.
F. Quantitative analysis of degraded antibiotics by UV/Vis spectrophotometer
For the preparation of calibration curve of ampicillin, five concentrations were used (Table 5 and Fig. 7). The calculation of the concentrations of ampicillin, the regression equation from the calibration curve was used. The calculation was done by putting value of absorbance (Y) in the regression equation. The λmax of ampicillin was 373nm. The regression equations of ampicillin was Y=0.0275X-0.132. The concentrations values in percentage AMP after biodegradation, was noticed for different isolates. The isolates AMP6 and AMP8 showed degradation rate 12.97±0.11 and 11.98±0.15 (Fig. 8).
[image:10.612.106.509.349.579.2]Technology (IJRASET)
Table 5: standard solution for ampicillin and their absorbance value at 373nm.
Concentrations (πg/ml) absorbance
18 0.398
36 0.797
54 1.402
72 1.803
91 2.399
Fig. 7: Calibration curve for ampicillin.
Fig. 8: The biodegradation rate of ampicillin by Ochrobacterum intermedium and Bacillus oceanisediminis.
IV. DISCUSSION
10 bacterial strains were isolated from marine sediments of Uranouchi Bay for the degradation of ampicillin at final concentration
y = 0.0275x - 0.132 R² = 0.996
0 0.5 1 1.5 2 2.5 3
0 20 40 60 80 100
Technology (IJRASET)
RA9 and RA10) and gamma proteobacteria subdivision (RA3, RA4 and RA7) by Maki et al., (2006). Al-Gheethi et al., (2014) isolated 68 bacterial strains from 21 treated sewage effluent sample collected from three STPs from Penang, Malaysia. These were capable of the degrading the ampicillin, amoxicillin, cefuroxime, cephalexin and ciprofloxacin antibiotics. They further noticed that the most potent bacteria for enzymatic degradation was Bacillus subtilis 1556 WTNC for the ampicillin, amoxicillin, cefuroxime, cephalexin and ciprofloxacin antibiotics. Wang et al., (2015) studied the penicillin G degradation by Klebsiella pneumoniae Z-1. Al-Ahmad et al., (1999) reported the higher bio- degradation of penicillin G by Pseudomonas putida after 28 to 40 days of incubation. Mitchell et al., (2013) focused the studied on the degradation of ampicillin, cefoxitin and cefalotin and recorded the higher rate after 5.3 to 27 days incubation. Al-Gheethi et al., (2014) noticed the maximum degradation of β-lactam antibiotics (amoxicillin, ampicillin, cephalexin and cefuroxime) by Bacillus subtilis 1956WTNC after 12 days of incubation. Lin et al., (2015) obtained the higher degradation rate of cephalexin by two Pseudomonas strains after 24 hrs. of incubation.
Maki et al. (2006) studied the biodegradation of ampicillin by ten AMP-resistant bacterial isolates .They further noticed that that the ampicillin residue was14 to 92% in Mueller-Hinton medium after 21 days of incubation. The degradation of β-lactam antibiotics by Bacillus subtilis 1556WTNC was studied by the Al-Gheethi et al. (2014). They noticed that the higher degradation rate of ampicillin, amoxicillin, cefuroxime and cephalexin was 15.56% at 0.8mg/ml, 25.03% at 1 mg/ml, 10.62% at 1mg/ml and 22.59 at 1 mg/ml respectively. Al-Gheethi et al. (2015) studied the degradation of cephalexin in pharmaceutical effluent. They recorded that the maximum degradation was 21% by Bacillus subtilis. Lin et al., (2015) demonstrated the degradation of cefalexin with the help of two strains CE21 and CE22 of Pseudomonas species. They observed the degradation rate as 46.7% and 90% after 24 hours of incubation respectively.
In present study the author isolated eleven isolates, out of eleven isolates only two AMP 6 and AMP 8 showed the higher degradation of ampicillin. The AMP 6 and AMP 8 identified as Ochrobacterum intermedium and Bacillus oceanisediminis
respectively. These isolates were degraded the ampicillin after 6 days of incubation at 37oC and 7 pH. The degradation rate of these antibiotics was 12.97±0.11 and 11.98±0.15 respectively.
V. CONCLUSION
The studies on the biological degradation of antibiotics will increase our knowledge for the remediation of ampicillin by microbes. The rate of biodegradation of ampicillin was 12.97±0.11 and 11.98±0.15 by Ochrobacterum intermedium and Bacillus oceanisediminis at 37oC and 7 pH after 6 days of incubation respectively. The concentration of ampicillin was 400ppm in the culture medium. thus it is concluded that the biodegradation of Ampicillin antibiotic present in the soil, garbage sewage etc. can be possible in the field conditions also.
REFERENCES
[1] Al-Gheethi, A. A. S., Ismail, N., (2014). Biodegradation of pharmaceutical waste water in treated sewage effluent by Bacillus subtilis 1556WTNC. Environ.
Process. 1: 459-481.
[2] Al-Gheethi, A. A. S., Ismail, N., Lalung, J., Efaq, A.N., Bala, J.D., (2015). Removal of heavy metals and antibiotics from treated sewage effluent by bacteria.
Clean Technologies and Environmental Policy. 17(8): 2101-2123.
[3] Al-Ahmad, A., Daschner, F. D. and Kummerer, K. (1999). Biodegradability of cefotiam, ciprofloxacin, meropenem, penicillin G, and sulfamethoxazole and
inhibition of wastewater bacteria. Archives of Environmental Contamination and Toxicology, 37: 158–163.
[4] Aneja, K. R. (2003). Experiments in microbiology plant pathology and biotechnology, Fourth addition, ISBN: 81-224-1494-X.
[5] Blezevic, D.J., and Ederer, G.M. (1975). Principles of biochemical tests in diagnostic microbiology, Wiley and Company, New York, pp.45.
[6] Cheesbrough, M. (1985). Biological Testing of Microorganisms: 58-69. In: medical laboratory manual for tropical countries. Vol. II. Microbiology, ELBS I
edition. Tropical Health technology and Butterworth-Heinemann. Cambridge University Press, Great Britain vii+479.
[7] Eckford, M.D. (1927). Thermophilic bacteria in milk. American Journal of Hygiene. 7: 201-202.
[8] Elmolla, E.S., and Chaudhuri, M., (2009). Degradation of the antibiotics amoxicillin, ampicillin and cloxacillin in aqueous solution by the photo-fenton process.
Journal of Hazardous Materials, 172: 1476-1481.
[9] Fellstrom, C., Karlsson, M., Pettersson, B., Zimmerman, U., Gunnarsson, A. and Aspan, A. (1999). Emended descriptions of indole negative and indole
positive isolates of Brachyspira (Serpulina) hyodysenteriae. Veterinary microbiology, 70: 225-238.
[10] Lin, B., Lyu, J., Lyu, X.J., Yu, H.Q., Hu, Z., Lam, J.C., and Lam, P.K., (2015). Characterization of cefalexin degradation capabilities of two Pseudomonas
strains isolated from activated sludge. Journal of Hazards Material, 282: 158-64.
[11] Maki, Teruna, Hasegawa, Hiroshi, Kitami, Hiroyuki, Fumoto, Kyoko, Munekage, Yukihiro and Ueda, K. (2006). Bacterial degradation of antibiotic residues in
marine fish farm sediments of Uranouchi Bay and phylogenetic analysis of antibiotic-degrading bacteria using 16S rDNA sequences. Fisheries Science. 72:811-820.
[12] Mitchell, S. M., Ullman, J. L., Teel, A. L. and Watts, R. J., (2013). pH and temperature effects on the hydrolysis of three β- lactam antibiotics: ampicillin,
cefalotin and cefoxitin. Science of the Total Environment, 466–467:547–55.
[13] Otto, S.C., Mezyk, S.P., and Zimmerman, K.D., (2015). 4-complete β-lactam antibiotic activity removed from waste water: Hydroxyl radical-mediated
Technology (IJRASET)
[14] Sharma, S. K., Singh, L., and Singh, S., (2013). Comparative study between penicillin and ampicillin. Scholars Journal of Applied Medical Sciences (SJAMS).
1(4): 291-294.
[15] Wang, P., Liu, H., Fu, H., Cheng, X., Wang, B., Cheng, Q., Zhang, J., and Zou, P., (2015). Characterization and mechanism analysis of penicillin G
bidegradation with Klebsiella pneumoniae Z1 isolated from waste penicillin bacterial residue. Journal of Industrial and Engineering Chemistry. 27: 50-58.
[16] Zhang, T., and Li, B., (2010). Biodegradation and adsorption of antibiotics in the activated sludge process. Environmental Science Technology, 44(9):