Direct-from-Blood-Culture Disk Diffusion To Determine
Antimicrobial Susceptibility of Gram-Negative Bacteria:
Preliminary Report from the Clinical and Laboratory Standards
Institute Methods Development and Standardization Working
Group
Sukantha Chandrasekaran,aApril Abbott,bShelley Campeau,aBarbara L. Zimmer,cMelvin Weinstein,d,eLauri Thrupp,f John Hejna,gLindsey Walker,c,gTracy Ammann,gThomas Kirn,d,eRobin Patel,hRomney M. Humphriesa,g
aUCLA Clinical Microbiology, University of California, Los Angeles, California, USA
bDeaconess Health System, Evansville, Indiana, USA
cBeckman Coulter, West Sacramento, California, USA
dDepartment of Medicine, Rutgers Robert Wood Johnson Medical School, New Brunswick, New Jersey, USA
eDepartment of Pathology and Laboratory Medicine, Rutgers Robert Wood Johnson Medical School, New Brunswick, New Jersey, USA
fUniversity of California, Irvine, Irvine, California, USA
gAccelerate Diagnostics, Tucson, Arizona, USA
hMayo Clinic, Rochester, Minnesota, USA
ABSTRACT The performance of a disk diffusion test using broth from positive blood cultures as inoculum (direct disk diffusion [dDD]) was evaluated for a collec-tion of 20 challenge isolates of Enterobacteriaceae, Acinetobacter baumannii, and Pseudomonas aeruginosa. Isolates seeded into human blood were inoculated into Bactec Plus Aerobic/F, VersaTREK Redox 1, and BacT/Alert FA Plus bottles and incu-bated in the respective automated blood culture systems. Disk diffusion results were compared to reference disk diffusion results. Categorical agreement (CA) values for dDD, after removal of random errors due to natural MIC variation, were 87.8%, 88.4%, and 92.2% for the BacT/Alert, Bactec, and VersaTREK systems, respectively. No very major errors (VME) were observed, and major error (ME) rates were 3.0%, 2.3%, and 1.7%, respectively. Incubation of the dDD test samples for 6 h compared to in-cubation for 16 to 18 h resulted in 19.9% of tests having too light of growth to al-low reading of zones of inhibition. Among the evaluable dDD tests, CA values were 58.9%, 76.6%, and 73.2% for the isolates seeded into the BacT/Alert, Bactec, and Ver-saTREK systems, respectively. VME rates for isolates seeded into these systems were 2.2%, 1.8%, and 3.0%, respectively, and ME rates were 25.4%, 6.1%, and 2.8%, re-spectively, at the 6-h reading. The best performance of dDD was found for blood cultures with bacterial concentrations in the range of 7.6⫻ 107 to 5.0 ⫻108 CFU/
ml; CA values ranged from 94.7 to 96.2% for these concentrations after 18 h of incu-bation and from 76.9 to 84.1% after 6 h of incuincu-bation. These preliminary data dem-onstrate the potential accuracy of dDD testing by the clinical laboratory.
KEYWORDS blood culture, Gram-negative bacteria, susceptibility testing
R
apid and accurate antimicrobial susceptibility testing (AST) is paramount to the management of patients with serious infections, including sepsis. However, con-ventional AST methods take 2 days to perform, at minimum, from the time the blood culture becomes positive. There is interest in developing AST methods for bacterial blood isolates that can generate data in a more clinically meaningful time frame.Received25 October 2017 Returned for modification27 November 2017 Accepted
21 December 2017
Accepted manuscript posted online5 January 2018
CitationChandrasekaran S, Abbott A, Campeau S, Zimmer BL, Weinstein M, Thrupp L, Hejna J, Walker L, Ammann T, Kirn T, Patel R, Humphries RM. 2018. Direct-from-blood-culture disk diffusion to determine antimicrobial susceptibility of Gram-negative bacteria: preliminary report from the Clinical and Laboratory Standards Institute Methods Development and Standardization Working Group. J Clin Microbiol 56:e01678-17.https://
doi.org/10.1128/JCM.01678-17.
EditorNathan A. Ledeboer, Medical College of Wisconsin
Copyright© 2018 American Society for Microbiology.All Rights Reserved. Address correspondence to Romney M. Humphries, [email protected].
crossm
on May 17, 2020 by guest
http://jcm.asm.org/
Multiplex molecular diagnostic assays are currently available that detect select antimi-crobial resistance genes directly from positive blood culture broths (e.g., Verigene [Luminex, Austin, TX] and FilmArray [BioFire, Salt Lake City, UT] assays). While these systems provide actionable data for Gram-positive infections through detection of mecA,vanA, and vanB, the only randomized controlled trial that evaluated these systems, to date (1), documented no impact on the management of Gram-negative infections (2). This is largely due to the limitations associated with detection by molecular means of all resistance genes for the management of Gram-negative infections. Antimicrobial resistance in Gram-negative bacteria is complex and often mul-tifactorial, and few genes or gene groups can be used to predict phenotypic susceptibility in these isolates. For instance, carbapenem resistance among theEnterobacteriaceae(3–5) can occur either via the presence of a carbapenemase gene or through a combination of porin defects and extended-spectrum beta-lactamases or AmpC (6). Similarly, isolates with a carbapenemase gene may not have MICs above the susceptibility breakpoint (7). As such, detection of carbapenemase genes alone does not yield sufficient information by which to deescalate therapy, and it may miss significant resistance.
A rapid, phenotypic approach to susceptibility testing for Gram-negative bacteria is therefore desirable. At present, several laboratories in the United States have devel-oped such “direct-from-blood” phenotypic susceptibility tests, which involve manipu-lation of positive blood culture broth to allow inocumanipu-lation of AST devices or agar plates with the broth rather than with a suspension made from isolated colonies (8–15). However, data from a poll conducted in 2015 by the Clinical and Laboratory Standards Institute (CLSI) demonstrated little to no standardization of methodology between laboratories. Further, almost none of the laboratories that responded to the poll indicated that results of direct-from-blood AST were reported to the patient’s chart or physician, despite excellent performance data (CLSI Subcommittee on Antimicrobial Susceptibility Testing agenda book, January 2015). Most laboratories indicated that this was due to concern over regulations surrounding use of laboratory-developed tests.
In 2014, the CLSI Subcommittee on Antimicrobial Susceptibility Testing formed an ad hoc working group to address the standardization of a direct-from-blood-culture susceptibility test method. The goal of this working group is to develop a method that (i) is based on disk diffusion (DD) and, as such, can be performed in all laboratories, including those without the expertise and resources for expensive and complex molecular testing; (ii) performs at or above U.S. Food and Drug Administration (FDA) standards for AST (i.e.,ⱖ90% categorical agreement [CA] and acceptable numbers of very major errors [VME; false susceptible] and major errors [ME; false resistant]); and (iii) is simple to implement into the routine laboratory workflow.
This study documents the initial studies performed by the CLSIad hoccommittee to establish the feasibility of a direct-from-blood-culture disk diffusion method for Gram-negative bacteria. An evaluation of 6-h and traditional 18-h incubation periods was also performed to verify if a further reduction in incubation time could be achieved.
MATERIALS AND METHODS
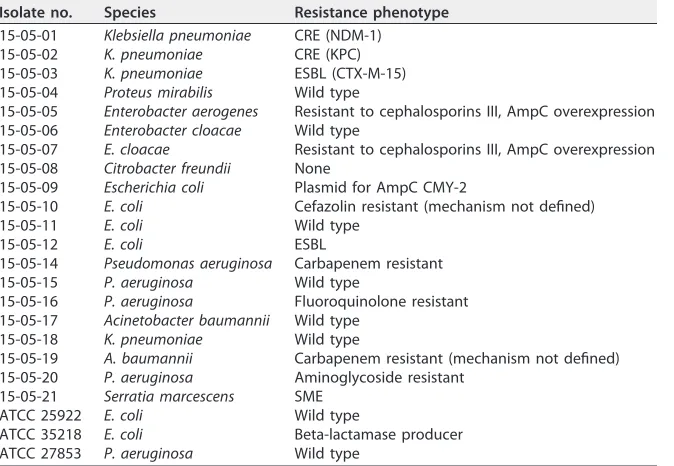
Bacterial isolates.Gram-negative bacterial isolates evaluated in this study (n⫽20) are listed in Table 1. These were isolated from the blood of patients with sepsis by the UCLA Clinical Microbiology Laboratory and chosen to include both wild-type and resistant phenotypes. Quality control (QC) strains tested includedEscherichia coliATCC 25922,Pseudomonas aeruginosa ATCC 27853, andE. coliATCC 35218.
All bacteria were stocked and frozen at⫺70°C in brucella broth plus 10% glycerol (Hardy Diagnostics, Santa Ana, CA). All isolates were subcultured twice from freezer stocks on sheep blood agar plates (BAP; BD, Sparks, MD). After 18 to 24 h of incubation on BAP, colonies were harvested to prepare a suspension equivalent to a 0.5 McFarland standard in 0.85% saline. One-milliliter saline aliquots of the bacterial suspensions at a 1:106dilution (i.e., approximately 102CFU) were seeded into Bactec Plus Aerobic/F (BD, Sparks, MD), VersaTREK Redox 1 (ThermoFisher, Lenexa, KS), and BacT/Alert FA Plus (bioMérieux, Durham, NC) blood culture bottles, along with 10 ml of human blood obtained from a donation center. Bottles were incubated on the respective blood culture systems until they were flagged as positive. Bottles were removed from the system within 8 h of being flagged as positive and used immediately after removal. Blood culture broth was subcultured to a blood agar plate and used to perform colony counts and as an inoculum for the direct disk diffusion method.
on May 17, 2020 by guest
http://jcm.asm.org/
DD.Disk diffusion testing (DD) was performed on all isolates from subculture plates according to CLSI standards (16); this test was termed reference DD (rDD) and used as the reference method in the data analyses. In addition, two modifications of the rDD method were evaluated. The first used an alternative inoculum, i.e., broth direct from the positive blood culture. For this direct-from-blood DD (dDD), 4 drops of blood culture broth from a Sub/Venting needle (BD) was applied to a 150-mm Mueller-Hinton agar (MHA) plate (BD) and swabbed in three directions across the plate to yield a lawn of bacteria. Disks were applied, and the plates were incubated at 35°C in ambient air. The second variable evaluated was incubation time. dDD plates were read after 6 h of incubation and again after 18 h of incubation. In these studies, the following antimicrobials were evaluated: amikacin, amoxicillin-clavulanate, ampicillin, az-treonam, cefazolin, cefepime, cefoxitin, ceftazidime, ceftriaxone, ciprofloxacin, ertapenem, gentamicin, imipenem, levofloxacin, meropenem, minocycline, piperacillin-tazobactam, tigecycline, tobramycin, and trimethoprim-sulfamethoxazole. All disks were purchased from BD.
Colony counts in blood culture bottles.At the same time that samples from positive bottles were directly inoculated onto Mueller-Hinton agar, a sample of the blood culture broth fluid was mixed and diluted serially in saline to dilutions of 10⫺2, 10⫺3, and 10⫺4, the dilutions were vortexed, and 50l of each dilution was spread onto a separate blood agar plate. After overnight incubation, the plates were examined for colonies. Colonies from plates with 30 to 300 colonies were counted, and numbers of CFU per milliliter were calculated from the dilution factor (i.e., CFU count/0.05 ml/dilution factor).
Reference BMD.CLSI reference broth microdilution (BMD) was performed on all isolates. BMD was used as a reference arbiter in resolving apparent outlier errors. Testing was performed on panels prepared in-house at UCLA, using cation-adjusted Mueller-Hinton broth (Difco, BD, Sparks MD), as previously described (17).
[image:3.585.42.379.84.317.2]Study design and data analysis.dDD results were compared to the rDD results obtained by testing isolated colonies from subcultures of the same bottles, which were used as the reference standard. Categorical agreement was evaluated by using CLSI document M100 breakpoints, excluding any antimicrobials for which the organism has intrinsic resistance (18). As a result, 14 antibiotics were evaluated forAcinetobacter baumannii, 16 forCitrobacter freundii,Enterobacter aerogenes, and Entero-bacter cloacae, 19 forKlebsiella pneumoniae, 16 forSerratia marcescens, and 11 forP. aeruginosa. Very major error (VME) (false susceptible) rates were calculated as numbers of results resistant by rDD but susceptible by dDD over the total number of resistant results by the reference method. Major error (ME) (false resistant) rates were calculated as numbers of isolates that tested susceptible by rDD but resistant by dDD over the number of susceptible isolates. Minor errors (mE) were defined as one result yielding an intermediate category and the other either a susceptible or resistant result. All VME and ME were further evaluated by comparing results of all DD and BMD tests performed for a given isolate; if the erroneous result was in agreement with the results of other reference methods (DD and BMD), it was considered to be a random error. Zone sizes for QC strains were evaluated using CLSI QC ranges published in the M100S document. For analysis, colony count data were divided into bins of 0.25-log increments.
TABLE 1Bacterial isolates used in this studya
Isolate no. Species Resistance phenotype
15-05-01 Klebsiella pneumoniae CRE (NDM-1)
15-05-02 K. pneumoniae CRE (KPC)
15-05-03 K. pneumoniae ESBL (CTX-M-15)
15-05-04 Proteus mirabilis Wild type
15-05-05 Enterobacter aerogenes Resistant to cephalosporins III, AmpC overexpression
15-05-06 Enterobacter cloacae Wild type
15-05-07 E. cloacae Resistant to cephalosporins III, AmpC overexpression
15-05-08 Citrobacter freundii None
15-05-09 Escherichia coli Plasmid for AmpC CMY-2
15-05-10 E. coli Cefazolin resistant (mechanism not defined)
15-05-11 E. coli Wild type
15-05-12 E. coli ESBL
15-05-14 Pseudomonas aeruginosa Carbapenem resistant
15-05-15 P. aeruginosa Wild type
15-05-16 P. aeruginosa Fluoroquinolone resistant
15-05-17 Acinetobacter baumannii Wild type
15-05-18 K. pneumoniae Wild type
15-05-19 A. baumannii Carbapenem resistant (mechanism not defined)
15-05-20 P. aeruginosa Aminoglycoside resistant
15-05-21 Serratia marcescens SME
ATCC 25922 E. coli Wild type
ATCC 35218 E. coli Beta-lactamase producer
ATCC 27853 P. aeruginosa Wild type
aCRE, carbapenem-resistantEnterobacteriaceae; ESBL, extended-spectrum beta-lactamase.Escherichia coli
ATCC 25922,Pseudomonas aeruginosaATCC 27853, andE. coliATCC 35218 were used as quality control strains.
on May 17, 2020 by guest
http://jcm.asm.org/
RESULTS
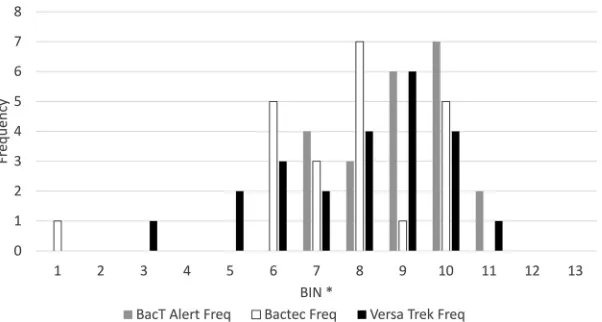
Colony counts in blood culture bottles at time of inoculation.Twenty challenge isolates (Table 1) were seeded into blood culture bottles and incubated on the respective automated instruments. Bottles were removed from the instruments within 8 h of being flagged as positive, and colony counts were performed. The numbers of bacteria in the bottles spanned a 2.75-log range, from 9.1⫻106to 3.4⫻109CFU/ml
(Fig. 1). The average number of bacteria present in the positive blood cultures was 8.6⫻108CFU/ml. Colony counts were divided into 0.25-log increments and plotted by
blood culture manufacturer (Fig. 1). The average number of bacteria in the BacT/Alert bottles was approximately 0.25 log higher, at 1.15⫻109CFU/ml, than the values of
6.9⫻108and 7.3⫻108CFU/ml for the Bactec and VersaTREK systems, respectively. No
obvious species-specific differences existed in the concentrations of bacteria present in the blood cultures when they were flagged as positive or between members of the Enterobacteriaceae,P. aeruginosa, andA. baumannii(data not shown).
Performance of the direct disk diffusion method.The first variable of the CLSI disk diffusion (DD) method evaluated in this study was use of an alternative inoculum, i.e., broth from a positive blood culture instead of colony growth from a plate. Results were read at the traditional 18-h time point for this set of experiments. Nine hundred seventy-one rDD and dDD data points were recorded for the 20 challenge isolates tested across the three blood culture systems. Two results, both for ciprofloxacin, were not recorded because the disks fell off during incubation: one from a dDD plate inoculated with anE. cloacaeisolate from a BacT/Alert bottle and the other from an rDD plate inoculated with an E. coli isolate from a BacT/Alert bottle. Overall categorical agreement of dDD and rDD results after 18 h of incubation was good, at 87.9%, just under the acceptable 90% limit for susceptibility test systems. There were no obvious performance differences for the dDD method between the three blood culture systems (Table 2). Two VME were observed among 390 resistant results (0.5%), 18 ME among 518 susceptible results (3.5%), and 97 mE (10.0%).
The two VME both occurred withP. aeruginosaisolates. The first was for imipenem on an isolate from the BacT/Alert system, where the reference rDD zone was 14 mm (resistant) and the dDD zone was 27 mm (susceptible). However, upon review, all other dDD and rDD results for this isolate were susceptible, and the reference broth microdi-lution (BMD) MIC was 1 g/ml (susceptible). As such, the error was considered a random error for the rDD for that isolate (see Table S1 in the supplemental material). The second VME was for levofloxacin on an isolate from the VersaTREK system. In this case, the dDD zone was 19 mm (susceptible) and the rDD zone was 12 mm (resistant). Again, all of the dDD and rDD results for this isolate were either susceptible or FIG 1Bacterial concentrations (CFU per milliliter) at the time of positive signal for three blood culture systems. Counts were divided into 0.25-log increments; the number of CFU per milliliter that corresponds to each bin is listed in Table 6.
on May 17, 2020 by guest
http://jcm.asm.org/
[image:4.585.57.358.70.231.2]intermediate, and the reference BMD MIC was 2g/ml (susceptible), suggesting this was a random error for the rDD for this isolate. ME are detailed in Table S1. Similar to what was observed for the VME, 6 of the 18 ME appeared to be attributable to random errors of the rDD, as all other dDD and rDD results were either intermediate or resistant and the BMD result was also intermediate or resistant. Removal of these ME from analysis yielded an overall ME rate of 2.3%, which is within the typically accepted level of 3.0%. Removal of both the VME and ME outlined above and in Table S1 resulted in an overall categorical agreement of 88.7% (not shown) and in categor-ical agreements of 87.8 to 92.1% for isolates recovered from each respective blood culture system (Table 2).
Of the 97 mE, 87 (89.7%) were due to the dDD result being more resistant than the rDD result, 6 occurred when the dDD result was susceptible and the rDD result was intermediate, and 4 were due to intermediate dDD and resistant rDD results. On average, the dDD zones were 1.9 mm smaller than the rDD zones, with a mode of a 0-mm difference, and ranged from 24 mm smaller to 14 mm larger than the rDD measurements.
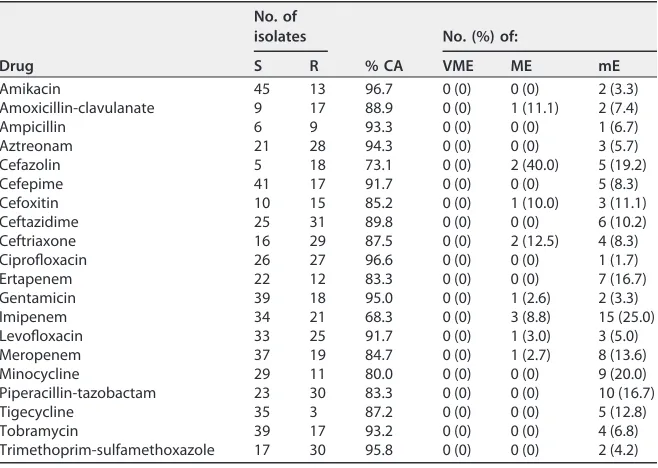
[image:5.585.41.371.84.208.2]Data by antimicrobial, across all three blood culture systems and excluding the errors outlined above, are presented in Table 3. In most cases, higher incidences of ME were observed for antibiotics with smaller numbers of susceptible results, for example, TABLE 2Performance of direct-from-blood-culture disk diffusion method at 18 h
Agreement type and blood culture system
No. of results from rDDa
% CA
No. (%) of:
S I R VME ME mE
Initial agreement
BacT/Alert FA aerobic 169 25 129 86.3 1 (0.8) 6 (3.5) 37 (10.7)
Bactec Plus aerobic 174 21 129 87.0 0 (0) 6 (3.5) 36 (10.3)
VersaTREK Redox 175 17 132 90.4 1 (0.8) 6 (3.4) 24 (6.9)
Resolved agreement
BacT/Alert FA aerobic 168 25 129 87.8 0 (0) 5 (3.0) 37 (10.8)
Bactec Plus aerobic 172 21 129 88.4 0 (0) 4 (2.3) 36 (10.4)
VersaTREK Redox 172 17 132 92.2 0 (0) 3 (1.7) 24 (7.0)
aS, susceptible; I, intermediate; R, resistant.
TABLE 3Resolved performance of direct-from-blood-culture disk diffusion method at 18 h, by antibiotic
Drug
No. of isolates
% CA
No. (%) of:
S R VME ME mE
Amikacin 45 13 96.7 0 (0) 0 (0) 2 (3.3)
Amoxicillin-clavulanate 9 17 88.9 0 (0) 1 (11.1) 2 (7.4)
Ampicillin 6 9 93.3 0 (0) 0 (0) 1 (6.7)
Aztreonam 21 28 94.3 0 (0) 0 (0) 3 (5.7)
Cefazolin 5 18 73.1 0 (0) 2 (40.0) 5 (19.2)
Cefepime 41 17 91.7 0 (0) 0 (0) 5 (8.3)
Cefoxitin 10 15 85.2 0 (0) 1 (10.0) 3 (11.1)
Ceftazidime 25 31 89.8 0 (0) 0 (0) 6 (10.2)
Ceftriaxone 16 29 87.5 0 (0) 2 (12.5) 4 (8.3)
Ciprofloxacin 26 27 96.6 0 (0) 0 (0) 1 (1.7)
Ertapenem 22 12 83.3 0 (0) 0 (0) 7 (16.7)
Gentamicin 39 18 95.0 0 (0) 1 (2.6) 2 (3.3)
Imipenem 34 21 68.3 0 (0) 3 (8.8) 15 (25.0)
Levofloxacin 33 25 91.7 0 (0) 1 (3.0) 3 (5.0)
Meropenem 37 19 84.7 0 (0) 1 (2.7) 8 (13.6)
Minocycline 29 11 80.0 0 (0) 0 (0) 9 (20.0)
Piperacillin-tazobactam 23 30 83.3 0 (0) 0 (0) 10 (16.7)
Tigecycline 35 3 87.2 0 (0) 0 (0) 5 (12.8)
Tobramycin 39 17 93.2 0 (0) 0 (0) 4 (6.8)
Trimethoprim-sulfamethoxazole 17 30 95.8 0 (0) 0 (0) 2 (4.2)
on May 17, 2020 by guest
http://jcm.asm.org/
[image:5.585.42.371.507.741.2]amoxicillin-clavulanate (11.1% ME; 9 susceptible results), cefazolin (40.0% ME; 5 sus-ceptible results), and cefoxitin (10.0% ME; 10 sussus-ceptible results). Imipenem and levofloxacin were the other two antimicrobials with ⬎3% ME rates, both with more than 30 susceptible results recorded. Imipenem also had a large proportion of mE (25.0%) (Table 3).
Performance of the early-read disk diffusion method. The second variable evaluated was incubation time. Both rDD and dDD plates were read after only 6 h of incubation, in contrast to the traditional 18 h of incubation. Incubation of rDD plates for 6 h resulted in 501 (51.5%) plates being too difficult to read due to light growth. In contrast, only 192 (19.9%) dDD plates were not read due to light growth. In both cases, P. aeruginosaresults were difficult to read, with 92.4% of dDD and 100% of rDD results yielding insufficient growth to allow evaluation. For the dDD, 68.1% ofC. freundiiand 16.8% of E. coli results were not read due to light growth. For rDD, 66.7% of A. baumannii, 62.5% ofE. coli, 25.4% ofK. pneumoniae, 100% ofProteus mirabilis, and 50.0% ofS. marcescensresults were too difficult to read at the 6-h time point.
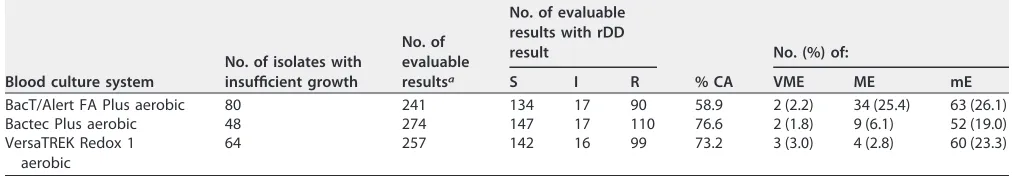
For the dDD results that were evaluable at 6 h of incubation (n⫽772), categorical agreement with rDD results read at 18 h was 69.9%, with 2.3% VME, 11.8% ME, and 21.1% mE. Interestingly, CA was significantly (P⬍0.05) lower for tests performed using broth from BacT/Alert bottles (58.9%) than for those using broth from Bactec (76.6%) and VersaTREK (73.1%) bottles. Strikingly, the number of ME with the BacT/Alert bottles (25.4%) was significantly higher than those observed using the Bactec (6.8%) and VersaTREK (4.2%) bottles (Table 4). Comparing dDD 18- and 6-h read results for isolates with sufficient growth for evaluation at 6 h yielded a 12.5% decrease in CA at the 6-h read for the Bactec system, a 16.4% decrease in CA for the VersaTREK blood culture system, and a 26.5% decrease for the BacT/Alert system. The higher categorical disagreement observed with the BacT/Alert system was due to there being more ME at the 6-h read (25.4%) than at the 18-h read (3.7%) for isolates with evaluable results at 6 h. Twelve of the 34 (35.3%) ME observed for the BacT/Alert system were for theP. mirabilisisolate tested, which yielded ME for all antibiotics tested except amikacin and ciprofloxacin (not shown). Other ME for the BacT/Alert system were forA. baumannii (n⫽5),E. aerogenes(n⫽6),E. cloacae(n⫽3),E. coli(n⫽1),K. pneumoniae(n⫽6), andS. marcescens(n⫽1).
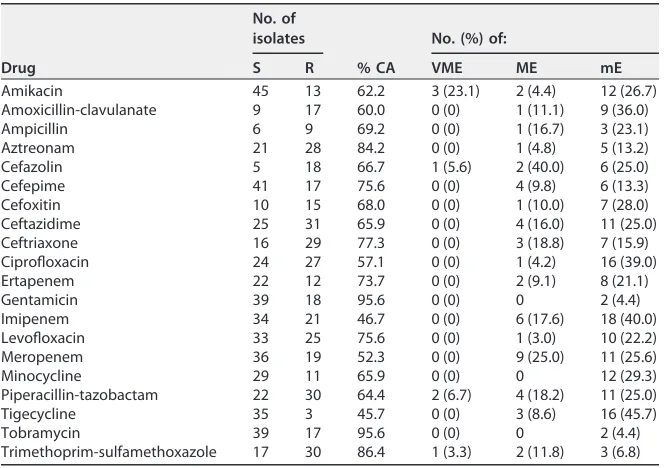
[image:6.585.39.553.84.172.2]As was done for the dDD read at 18 h, all VME and ME were evaluated to assess the results for random errors by the rDD test. Three ME were found to be due to an error of the rDD, wherein all results except the one rDD result were interpreted as resistant. These included a Bactec piperacillin-tazobactam result forS. marcescens, a VersaTREKE. coliresult versus ciprofloxacin, and a VersaTREKC. freundii result versus meropenem (Table S2). Removal of these errors from the ME calculations yielded ME rates of 6.2% for the Bactec system and 2.9% for the VersaTREK system (Table 4). Agreement by antimicrobial is shown in Table 5. CA was highest for gentamicin and tobramycin (⬎90%) (Table 5) and lowest for imipenem and tigecycline (both below 50%). Three of the 13 amikacin-resistant results were read as susceptible at 6 h (23.1% VME), as were 2 of 30 piperacillin-tazobactam results (6.7% VME), 1 of 18 cefazolin-resistant results (5.6% VME), and 1 of 30 trimethoprim-sulfamethoxazole results (3.3% VME). High ME TABLE 4Performance of dDD read at 6 h compared to that of rDD read at 18 hb
Blood culture system
No. of isolates with insufficient growth
No. of evaluable resultsa
No. of evaluable results with rDD result
% CA
No. (%) of:
S I R VME ME mE
BacT/Alert FA Plus aerobic 80 241 134 17 90 58.9 2 (2.2) 34 (25.4) 63 (26.1)
Bactec Plus aerobic 48 274 147 17 110 76.6 2 (1.8) 9 (6.1) 52 (19.0)
VersaTREK Redox 1 aerobic
64 257 142 16 99 73.2 3 (3.0) 4 (2.8) 60 (23.3)
aEvaluable results included only plates with sufficient growth to be read by both rDD and dDD.
brDD, reference disk diffusion; dDD, direct-from-blood disk diffusion; VME, very major errors; ME, major errors; mE, minor errors.
on May 17, 2020 by guest
http://jcm.asm.org/
rates were observed for cefazolin (2/5 results [40.0%]), cefoxitin (1/10 results [10.0%]), ceftazidime (4/25 results [16.0%]), ceftriaxone (3/16 results [18.8%]), imipenem (6/34 results [17.6%]), meropenem (9/36 results [25.0%]), piperacillin-tazobactam (4/22 results [18.2%]), and trimethoprim-sulfamethoxazole (2/17 results [11.8%]).
Effect of bacterial concentration in blood culture on performance of direct-from-blood-culture disk diffusion.CA was evaluated for both the 18-h and 6-h dDD results in relation to the concentration of the bacterial inoculum. Data are presented in Table 6. Colony count data were divided into 0.25-log increments, and categorical agreement was calculated. The best performance of dDD was found in the range of 7.6⫻107to 5.0⫻108CFU/ml (Table 5), with CA values ranging from 94.7 to 96.2%,
although there was no direct correlation between number of CFU per milliliter and CA at this time point. Similarly, CA was highest at this concentration range for the dDD test read at 6 h, with values ranging from 76.9 to 84.1% (Table 5). Not surprisingly, the largest proportion of dDD results with growth deemed too faint to read at 6 h were found at the lower concentrations (7.5⫻106to 5.0⫻107CFU/ml). The approximate
[image:7.585.41.373.91.325.2]cell density of a 0.5 McFarland standard is 1.5⫻108CFU/ml.
TABLE 5Resolved performance of direct-from-blood-culture disk diffusion method at 6 h, by antibiotic
Drug
No. of isolates
% CA
No. (%) of:
S R VME ME mE
Amikacin 45 13 62.2 3 (23.1) 2 (4.4) 12 (26.7)
Amoxicillin-clavulanate 9 17 60.0 0 (0) 1 (11.1) 9 (36.0)
Ampicillin 6 9 69.2 0 (0) 1 (16.7) 3 (23.1)
Aztreonam 21 28 84.2 0 (0) 1 (4.8) 5 (13.2)
Cefazolin 5 18 66.7 1 (5.6) 2 (40.0) 6 (25.0)
Cefepime 41 17 75.6 0 (0) 4 (9.8) 6 (13.3)
Cefoxitin 10 15 68.0 0 (0) 1 (10.0) 7 (28.0)
Ceftazidime 25 31 65.9 0 (0) 4 (16.0) 11 (25.0)
Ceftriaxone 16 29 77.3 0 (0) 3 (18.8) 7 (15.9)
Ciprofloxacin 24 27 57.1 0 (0) 1 (4.2) 16 (39.0)
Ertapenem 22 12 73.7 0 (0) 2 (9.1) 8 (21.1)
Gentamicin 39 18 95.6 0 (0) 0 2 (4.4)
Imipenem 34 21 46.7 0 (0) 6 (17.6) 18 (40.0)
Levofloxacin 33 25 75.6 0 (0) 1 (3.0) 10 (22.2)
Meropenem 36 19 52.3 0 (0) 9 (25.0) 11 (25.6)
Minocycline 29 11 65.9 0 (0) 0 12 (29.3)
Piperacillin-tazobactam 22 30 64.4 2 (6.7) 4 (18.2) 11 (25.0)
Tigecycline 35 3 45.7 0 (0) 3 (8.6) 16 (45.7)
Tobramycin 39 17 95.6 0 (0) 0 2 (4.4)
[image:7.585.44.370.585.729.2]Trimethoprim-sulfamethoxazole 17 30 86.4 1 (3.3) 2 (11.8) 3 (6.8)
TABLE 6Performances of dDD after 18 and 6 h of incubation, stratified by concentration of bacteria present in blood culture broth inoculum
Bin CFU rangea
No. of readings
18-h dDD 6-h dDD % CA
% of plates with growth
too light to read % CA
1 7.5E⫹06–1.0E⫹07 16 100.0
2 1.1E⫹07–2.5E⫹07 0
3 2.6E⫹07–5.0E⫹07 11 100.0 100.0
4 5.1E⫹07–7.5E⫹07 0
5 7.6Eⴙ07–1.0Eⴙ08 26 96.2 0 76.9
6 1.1Eⴙ08–2.5Eⴙ08 124 94.4 0 80.6
7 2.6Eⴙ08–5.0Eⴙ08 155 93.5 7.1 77.4
8 5.1E⫹08–7.5E⫹08 184 87.5 12.0 58.7
9 7.6E⫹08–1.0E⫹09 174 93.7 48.3 36.2
10 1.1E⫹09–2.5E⫹09 205 79.5 5.4 53.7
11 2.6E⫹09–5.0E⫹09 48 79.2 22.9 39.6
aRanges in bold represent the range of a 0.5 McFarland standard.
on May 17, 2020 by guest
http://jcm.asm.org/
DISCUSSION
Over the last few decades, several clinical laboratories have developed methods to perform phenotypic susceptibility testing using blood culture broth as the primary inoculum. Such studies have shown improved times to susceptibility results, by a minimum of 1 day, as subculture of the blood culture broth is not required (8–15). The methods utilized in these studies have varied greatly over the years, leading to the need for a standardized method, which would also facilitate the use of these rapid results for patient care. Despite variability in methods, most studies show a high degree of categorical agreement with reference methods. Our study, which involved the three major blood culture incubation monitoring systems and a challenge set of Gram-negative bacteria, demonstrated 87.4% CA by the 18-h time point but only 69.9% CA at the early-read 6-h time point. This challenge set of 20 isolates provides several thousand data points as preliminary data, which will be the basis for larger studies involving a larger number of isolates at several institutions. Importantly, it demon-strates the feasibility of this approach.
One of the major contributors to discrepancies between direct-from-blood-culture-positive broth and reference disk diffusion results appears to be the concentration of bacteria within blood bottles after incubation. The differences in bacterial concentra-tions between the three commercial systems evaluated spanned nearly 3 log. The BacT/Alert blood cultures were flagged as positive at an approximately 0.25-log higher concentration of bacteria (1.15⫻109CFU/ml) than those for the Bactec and VersaTREK
systems (6.9⫻108and 7.3⫻108CFU/ml, respectively). The BacT/Alert concentration
is significantly higher than the 0.5 McFarland standard used in the reference disk diffusion method (i.e., 1.5 ⫻ 108 CFU/ml). In order to improve CA, differences in
bacterial concentration between systems could be calibrated by adjusting the inocu-lum concentrations, as attempted in various studies. However, in busy laboratories, especially during evening and night shifts, manual steps required to standardize a blood culture inoculum are unlikely to receive widespread adoption, as is the case for manual methods to perform rapid identification from positive blood culture broth, such as with matrix-assisted laser desorption ionization–time of flight (MALDI-TOF) mass spectrometry in the United States.
In our study, we also attempted to shorten the incubation time for DD. This alteration resulted in an increased rate of ME, a finding observed by others (14, 19). This observation is consistent with the dynamics of drug diffusion from the disk, with the height of the gradient being very steep in the first 6 h (i.e., drug present at a high concentration but close to the disk) and very shallow at later time points (lower concentrations at greater distances from the disk). The inflection point for penicillin G is around 6 to 8 h (20). Thus, small zone sizes measured at the earlier time point are consistent with incomplete diffusion of the antimicrobial through the agar. As DD breakpoints are correlated to an MIC, one option would be to develop an early-read DD breakpoint, which would likely be a smaller diameter than the breakpoints for the rDD. However, these breakpoints would be limited to species proven to have sufficient growth by the early time point. At 6 h, 92.3% ofP. aeruginosaplates and 68.1% ofC. freundiiplates were unreadable due to light growth, indicating that breakpoints for these species may not be appropriate for an early read. Additionally, some isolates of more common species had poor growth at 6 h, although forE. coli, the most prevalent clinical isolate, 83.2% of our isolates actually yielded adequate growth at this early time point. These data parallel those observed in 1984 by Coyle and colleagues, who noted that 78% of Gram-negative isolates had readable disk diffusion results after 6 h of incubation, ranging from 64% of P. aeruginosa isolates to 92% of Enterobacter sp. isolates (14). An important factor to consider is the variability between readers evalu-ating dDD plates. Use of digital cameras and automation may aid in resolving this variability. The above-mentioned study also evaluated isolates directly from blood culture broth, although the authors used a sterile swab dipped into the blood culture as opposed to the 4-drop inoculum used in the present study (14). A recent study by
on May 17, 2020 by guest
http://jcm.asm.org/
van den Bijllaardt and colleagues evaluated the readability of the standard DD method for theEnterobacteriaceae, using hourly, automated imaging of rDD plates postinocu-lation. In their study, 95.8% of isolates were readable at 6 h, and an increase in incubation time to 7 h yielded readable growth for all isolates. Further incubation to a total of 10 h minimized errors by the current rDD breakpoints (21). Such data suggest that the use of smart incubator systems may further increase the readability of short-incubation disk diffusion methods (19). To this end, CLSI will pursue an 8- to 10-h early-read time point to further evaluate the dDD method.
A second theme that arose in this study was the errors associated with beta-lactams. High mE and ME rates remained at 18 h for amoxicillin-clavulanate, cefazolin, cefoxitin, ceftazidime, ceftriaxone, imipenem, meropenem, and piperacillin-tazobactam. Beta-lactams translocate into the bacterial cell via porins to act on the cell synthesis pathway. One explanation for the errors may involve inhibition of this translocation due to the blood components present in the inoculum. Older studies on direct-from-blood disk diffusion observed overall high CA values, but many of these were completed prior to the availability of advanced-generation cephalosporins or carbapenems, antimicrobial classes that we found to be particularly problematic (3, 9, 11).
Developing and validating a standardized direct susceptibility method for positive blood cultures could benefit laboratories and clinicians and ultimately advance patient care. Providing the correct identification and susceptibility profile even a single day earlier may have impacts on the length of stay, appropriate use of antibiotics, and development of antibacterial resistance. The phenotypic method described here over-comes the inability to identify all specific resistance genes for Gram-negative bacteria and is more affordable than platforms currently available on the market.
SUPPLEMENTAL MATERIAL
Supplemental material for this article may be found athttps://doi.org/10.1128/JCM .01678-17.
SUPPLEMENTAL FILE 1,XLSX file, 0.1 MB.
REFERENCES
1. Banerjee R, Teng CB, Cunningham SA, Ihde SM, Steckelberg JM, Moriarty JP, Shah ND, Mandrekar JN, Patel R. 2015. Randomized trial of rapid multiplex polymerase chain reaction-based blood culture identification and susceptibility testing. Clin Infect Dis 61:1071–1080.https://doi.org/ 10.1093/cid/civ447.
2. Banerjee R, Teng CB, Cunningham SA, Ihde S, Steckelberg J, Moriarty JP, Shah ND, Mandrekar J, Patel R. 2016. Reply to Idelevich and Beck. Clin Infect Dis 62:269 –270.https://doi.org/10.1093/cid/civ826.
3. Mirrett S, Reller LB. 1979. Comparison of direct and standard antimicro-bial disk susceptibility testing for bacteria isolated from blood. J Clin Microbiol 10:482– 487.
4. Idelevich EA, Schule I, Grunastel B, Wullenweber J, Peters G, Becker K. 2014. Acceleration of antimicrobial susceptibility testing of positive blood cultures by inoculation of Vitek 2 cards with briefly incubated solid medium cultures. J Clin Microbiol 52:4058 – 4062.https://doi.org/ 10.1128/JCM.02400-14.
5. Funke G, Funke-Kissling P. 2004. Use of the BD Phoenix automated micro-biology system for direct identification and susceptibility testing of gram-negative rods from positive blood cultures in a three-phase trial. J Clin Microbiol 42:1466 –1470.https://doi.org/10.1128/JCM.42.4.1466-1470.2004. 6. Miller S, Humphries RM. 2016. Clinical laboratory detection of carbapenem-resistant and carbapenemase-producing Enterobacteria-ceae. Expert Rev Anti Infect Ther 14:705–717.https://doi.org/10.1080/ 14787210.2016.1206815.
7. Humphries RM, Hindler JA, Epson E, Horwich-Scholefield S, Miller LG, Mendez J, Martinez JB, Sinkowitz J, Sinkowtiz D, Hershey C, Marquez P, Bhaurla S, Moran M, Pandes L, Terashita D, McKinnell JA. 1 November 2017. Carbapenem-resistant Enterobacteriaceae (CRE) detection prac-tices in California: what are we missing? Clin Infect Dis.https://doi.org/ 10.1093/cid/cix942.
8. Wimmer JL, Long SW, Cernoch P, Land GA, Davis JR, Musser JM, Olsen RJ.
2012. Strategy for rapid identification and antibiotic susceptibility test-ing of gram-negative bacteria directly recovered from positive blood cultures using the Bruker MALDI Biotyper and the BD Phoenix system. J Clin Microbiol 50:2452–2454.https://doi.org/10.1128/JCM.00409-12. 9. Wegner DL, Mathis CR, Neblett TR. 1976. Direct method to determine the
antibiotic susceptibility of rapidly growing blood pathogens. Antimicrob Agents Chemother 9:861– 862.https://doi.org/10.1128/AAC.9.5.861. 10. Waites KB, Brookings ES, Moser SA, Zimmer BL. 1998. Direct
susceptibil-ity testing with positive BacT/Alert blood cultures by using MicroScan overnight and rapid panels. J Clin Microbiol 36:2052–2056.
11. Fay D, Oldfather JE. 1979. Standardization of direct susceptibility test for blood cultures. J Clin Microbiol 9:347–350.
12. Doern GV, Scott DR, Rashad AL, Kim KS. 1981. Evaluation of a direct blood culture disk diffusion antimicrobial susceptibility test. Antimicrob Agents Chemother 20:696 – 698.https://doi.org/10.1128/AAC.20.5.696. 13. de Cueto M, Ceballos E, Martinez-Martinez L, Perea EJ, Pascual A. 2004.
Use of positive blood cultures for direct identification and susceptibility testing with the Vitek 2 system. J Clin Microbiol 42:3734 –3738.https:// doi.org/10.1128/JCM.42.8.3734-3738.2004.
14. Coyle MB, McGonagle LA, Plorde JJ, Clausen CR, Schoenknecht FD. 1984. Rapid antimicrobial susceptibility testing of isolates from blood cultures by direct inoculation and early reading of disk diffusion tests. J Clin Microbiol 20:473– 477.
15. Chapin KC, Musgnug MC. 2003. Direct susceptibility testing of positive blood cultures by using Sensititre broth microdilution plates. J Clin Microbiol 41:4751– 4754. https://doi.org/10.1128/JCM.41.10.4751-4754 .2003.
16. CLSI. 2015. Performance standards for antimicrobial disk susceptibility tests; approved standard, 12th ed, vol M02-A12. Clinical and Laboratory Standards Institute, Wayne, PA.
17. Bobenchik AM, Deak E, Hindler JA, Charlton CL, Humphries RM. 2015.
on May 17, 2020 by guest
http://jcm.asm.org/
Performance of Vitek 2 for antimicrobial susceptibility testing of Enter-obacteriaceae with Vitek 2 (2009 FDA) and 2014 CLSI breakpoints. J Clin Microbiol 53:816 – 823.https://doi.org/10.1128/JCM.02697-14. 18. CLSI. 2017. Performance standards for antimicrobial susceptibility
test-ing, 27th ed. CLSI supplement M100. Clinical and Laboratory Standards Institute, Wayne, PA.
19. Froding I, Vondracek M, Giske CG. 2017. Rapid EUCAST disc diffusion testing of MDR Escherichia coli and Klebsiella pneumoniae: inhibition zones for extended-spectrum cephalosporins can be reliably read after
6 h of incubation. J Antimicrob Chemother 72:1094 –1102.https://doi .org/10.1093/jac/dkw515.
20. Lorian V. 1996. Antibiotics in laboratory medicine, 4th ed. Williams and Wilkins, Baltimore, MD.
21. van den Bijllaardt W, Buiting AG, Mouton JW, Muller AE. 2017. Shorten-ing the incubation time for antimicrobial susceptibility testShorten-ing by disk diffusion for Enterobacteriaceae: how short can it be and are the results accurate? Int J Antimicrob Agents 49:631– 637.https://doi.org/10.1016/ j.ijantimicag.2016.12.019.