M E T H O D
Open Access
HaploShare: identification of extended haplotypes
shared by cases and evaluation against controls
Dingge Ying
1,2, Pak Chung Sham
2,3, David Keith Smith
4, Lu Zhang
1, Yu Lung Lau
1and Wanling Yang
1,3*Abstract
Recent founder mutations may play important roles in complex diseases and Mendelian disorders. Detecting shared haplotypes that are identical by descent (IBD) could facilitate discovery of these mutations. Several programs address this, but are usually limited to detecting pair-wise shared haplotypes and not providing a comparison of cases and controls. We present a novel algorithm and software package, HaploShare, which detects extended haplotypes that are shared by multiple individuals, and allows comparisons between cases and controls. Testing on simulated and real cases demonstrated significant improvements in detection power and reduction of false positive rate by HaploShare relative to other programs.
Background
Although genome-wide association studies (GWAS) have revealed numerous common susceptibility variants for complex diseases [1,2], only a small fraction of disease heritability can be explained [3,4]. Rare variants may be a major source of genetic variations that predisposes indi-viduals to disease [5-7], but their detection is often diffi-cult. The low penetrance or effect size of rare variants, as well as genetic heterogeneity, often means that they are unlikely to be detected by classical linkage analysis, and their low allele frequency significantly reduces the power of association studies. Next generation sequencing tech-nologies can detect rare variants [7], but firmly establish-ing a link between them and an underlyestablish-ing disease is difficult without robust statistical methods or functional characterization [6,8].
While common variants are mostly shared across eth-nic groups, rare variants are more likely to be recent in history and population-specific. Some are recent founder mutations, shared by a number of individuals whose re-lationship may not be socially known. Recent founder mutations playing a role in a disease should aggregate more in cases than in controls and the haplotypes in
which they reside should have been affected by only a lim-ited number of recombination events, unlike haplotypes in the general population. Making use of this distinction may aid the detection of recent haplotypes among cases and facilitate detection of founder mutations.
Many efforts have been made in recent years to identify haplotypes shared IBD, with the aim of locating disease genes [9-13]. A drawback of most of these algorithms is that haplotype frequency was not taken into consider-ation, which limits the detection power and thus, they are only suitable to detect very long haplotypes shared IBD. PLINK [14] and GERMLINE [15] are two programs that are quite efficient in processing genome-wide SNP geno-typing data, but PLINK has low power in detecting shorter haplotypes IBD and GERMLINE has a high false positive rate when trying to detect smaller shared regions [16].
BEAGLE-IBD simultaneously models linkage disequi-librium (LD) between markers and IBD sharing using a Hidden Markov Model, and showed significant improve-ments in power over earlier programs [16]. However, its computational burden prevents it from being applied to large samples. Having to determine the prior IBD prob-ability is also a potential issue in trying to balance detec-tion power and false positive rate, since suitable priors may vary among populations that differ in history and consanguinity. BEAGLE fastIBD can be applied to large samples while achieving power close to that of BEAGLE IBD [17]. The program still only works on sharing at a pair-wise level and does not provide a comparison between * Correspondence:[email protected]
1Department of Paediatrics and Adolescent Medicine, LKS Faculty of Medicine, The University of Hong Kong, 21 Sassoon Rd., Pokfulam, Hong Kong 3Centre for Genomic Sciences, LKS Faculty of Medicine, The University of Hong Kong, Pokfulam, Hong Kong
Full list of author information is available at the end of the article
cases and controls to detect haplotype sharing that is asso-ciated with diseases.
Several more recent algorithms begin to expand infer-ence of haplotype-sharing IBD from pair-wise sharing to that among multiple individuals. DASH and EMI builds upon pair-wise haplotype sharing to infer groups of indi-viduals who are likely to share a single haplotype [18]. A Markov Chain Monte Carlo (MCMC) probabilistic model applied to unphased SNP data to simultaneously infer haplotype sharing IBD among multiple individuals (MCMC_IBDfinder) was also reported [19]. Based on an embedded log-likelihood ratio and using a model that accounts for LD, Parente2 explicitly models haplotype frequencies and enables large-scale IBD detection [20]. IBD-Groupon makes use of pair-wise IBD relationships detected by other software to infer group-wise haplotype sharing, overcoming the drawbacks of some of the avail-able tools [21]. DASH was used to test diverse GWAS data and showed a significant power increase upon sin-gle SNP association, but the power of the algorithm in detecting haplotypes shared IBD by a very small number of cases and/or short haplotypes is unclear. In addition, the power of DASH and IBD-Groupon is dependent on the power of detecting pair-wise haplotype sharing. MCMC_IBDfinder has good power in detecting short shared haplotypes, but it does not provide a comprehen-sive evaluation process using controls, and is not efficient enough to be applied to GWAS data. The detection power and speed of EMI and IBD-Groupon very much rely on the performance of BEAGLE.
Thus, despite significant progress in developing algo-rithms to infer haplotypes shared IBD among cases, many problems remain and a comprehensive program applicable to case–control data and with adequate power and efficiency is still lacking. Here we introduce a new algorithm, implemented in HaploShare, designed to have high power when detecting extended haplotypes shared by multiple individuals and the efficiency to be applied to large data sets. Most importantly, it extends an evalu-ation process using controls to derive an empirical null distribution for the population of interest, to help iden-tify sharing in cases that may harbor disease-associated rare variants.
Results
Factors affecting detection sensitivity
Different scenarios of population-based association stud-ies were simulated by dividing the Hong Kong ethnic
Chinese samples randomly into ‘case’ and ‘control’
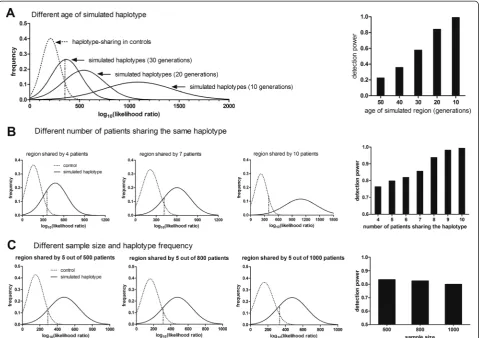
groups of 1,000 each, and creating recent founder haplo-types of different ages (generations) that were shared by different numbers of ‘cases’ but not by ‘controls’. In all the simulations, a positive detection was defined as the simulated recent founder haplotype reaching a significance
of 0.05 (which refers to quasiPvalue, defined in Methods, step 7), based on the empirical null distributions of log-likelihood ratio of sharing by IBD vs. random chance that was derived from haplotype sharing from controls (step 6 in Figure 1).
These results indicate that both the age of the founder mutation and the number of cases sharing the same founder haplotype affect detection of the haplotypes. When a threshold of 1 cM was used to select pair-wise haplotype-sharing (step 3 of the algorithm), and 10 of 1,000 individuals carried the founder mutation, Haplo-Share had an adjusted detection power of almost 1 for mutations 10 generations old. This dropped to 0.23 for 50-generation-old mutations (Figure 2A, right panel). For a 10 generation founder mutation the detection sen-sitivity was 0.99 if 10 cases shared the haplotype, but 0.76 if only four of the 1,000‘cases’did (Figure 2B). The overall size of the case sample pool considered, however, had little effect on adjusted detection power. For five cases sharing an ancestral haplotype of 10 generations in a pool of 500, 800, or 1,000 total individuals, detection sensitivity remained almost unchanged (Figure 2C), reflecting the robustness of the algorithm against hetero-geneity. This is an important characteristic of the algorithm as its purpose is to detect very rare variants associated with the underlying disease.
Power comparison between HaploShare and other programs
selecting a region, without reference to controls. The parameters used for these programs were described in the Additional file. All the adjusted power was shown in Table 1. We also calculated the 95% confidence in-tervals of the adjusted power by bootstrap resampling in R (Additional file 1: Table S2).
It is worth noting that the method for calculation of detection power described above was not directly count-ing iterations, but countcount-ing the fraction of individuals being detected in each iteration. Meanwhile, the false positive rate for each program was not strictly con-trolled in the power comparison. Therefore, we used the term‘adjusted power’instead of‘power’in the description of the results. We also used an alternative evaluation
method, in which the power was calculated only based on the iterations when all the individuals who carry the simu-lated founder haplotypes were being detected, while miss-ing any individual with the simulated founder haplotype was defined as a negative detection. The result of this al-ternative method was presented in Additional file 1: Table S1. It can be seen that very low detection power was ob-served for short haplotypes for all the programs evaluated using this method.
[image:3.595.60.539.86.547.2]When detecting pair-wise sharing only, HaploShare outperformed other programs for haplotypes of 20 to 30 generations old and this advantage was even greater if multiple sharing was considered (Table 1 and Additional file 1: Table S2). The length cutoff in selecting haplotypes
shared pair-wise affected the adjusted detection power of HaploShare. At a cutoff of 0.5 cM instead of 1.0 cM, ad-justed detection power increased, especially for founder haplotypes of older age (Table 1 and Additional file 1: Table S3). HaploShare was more powerful than other pro-grams even when only pair-wise evaluation was per-formed. This indicates that the improved power of HaploShare was not solely based on the multiple sharing analysis scheme.
PLINK and DASH are programs that make use of case control data. Identification of shared haplotypes that reach statistical significance based on the controls by
PLINK, DASH, and HaploShare was examined. Two, five, or 10 out of 1,000 individuals were assigned founder haplotypes of 10 to 50 generations of age. HaploShare showed higher adjusted power in detecting shared ex-tended haplotypes reaching significance (Table 2 and Additional file 1: Table S4, S5) as well as simulated hap-lotypes reaching detection threshold (Table 1). However, these data also showed that a number of the simulated founder haplotypes were detected but did not reach stat-istical significance.
[image:4.595.59.539.89.427.2]To address a potential issue that might arise from the similarity in the simulation of the shared founder
haplotypes and the algorithms used in their detection by HaploShare, an alternative set of founder haplotypes was also generated (described in Methods). With shared haplotypes by siblings phased by BEAGLE serv-ing as the shared recent founder haplotypes, Haplo-Share achieved comparable adjusted power to when using founder haplotypes generated by its own algo-rithm (Additional file 1: Table S6), indicating that gen-erating and detecting founder haplotypes both by HaploShare did not cause inflation in adjusted power. This alternative set of founder haplotypes were also used to test other tools and the results were consistent for founder haplotypes generated by different methods (Additional file 1: Table S7). Similarly, we have done testing and evaluation of HaploShare and other soft-ware using WTCCC data, a widely used data source
from subjects of European ancestry. Comparable re-sults were achieved (Additional file 1: Table S8), indi-cating that the performance of the various programs is not dependent on the data and is not population-specific.
Evaluation of false positive detections
[image:5.595.58.538.112.221.2]Extended haplotypes that were shared by a number of case individuals but without intrinsic relationship with the underlying disease may still reach significance and were considered false positive detections for the sake of testing the different tools, even though some of them might be true IBD derived from a recent common founder. Log likelihood ratios of sharing by IBD vs. chance for extended haplotypes detected from control samples (see Methods) follow a shifted Gamma distribution
Table 1 Comparison of adjusted power on detecting pair-wise haplotype-sharing IBD between HaploShare, BEAGLE, GERMLINE, PLINK, DASH, and IBD-Groupon
Age of simulated regions (generations)
Length (cM)
HaploShare (multiple)b
HaploShare (pair-wise)c
BEAGLE IBD
BEAGLE fastIBD
PLINK GERMLINE DASH plus GERMLINE
BEAGLE plus IBD-Groupon
Thresholda 1 cM 0.5 cM 1 cM 0.5 cM N/A N/A 0.5 Mb 0.5 cM 0.5 cM N/A
50 1.14 45.1 47.8 30.2 38.7 36.6 30.8 0.0 41.9 36.4 29.2
40 1.28 51.9 54.6 35.9 46.9 41.4 40.8 0.0 44.7 40.3 39.3
30 1.53 94.8 95.1 66.6 81.4 49.2 48.8 19.1 49.2 47.7 49.2
20 2.35 97.7 97.8 80.0 90.1 73.2 73.9 39.2 61.1 62.3 73.7
10 4.18 100.0 100.0 94.6 96.9 97.1 96.2 65.6 70.1 72.6 96.5
All results shown here are detections of pair-wise sharing reaching threshold based on respective thresholds in respective programs, no comparison to controls was involved.
a
For HaploShare, GERMLINE, DASH, and PLINK, it is the minimum genetic distance (or physical distance) of the haplotypes shared pair-wise to be selected for further analysis; for BEAGLE, it is the prior IBD probability; for BEAGLE fastIBD, it is the fastIBD score, and for IBD-Groupon, it is also the fastIBD score. b
Haplotypes shared pair-wise surpassing a certain genetic distance (0.5 or 1 cM) are further analyzed for sharing by multiple individuals, which by itself increases power of detecting more individuals sharing an extended haplotype (Step 4, Figure1).
c
Analysis stops at only detecting haplotypes shared pair-wise without merging pair-wise sharing into sharing by multiple individuals (stops at Step 3, Figure1).
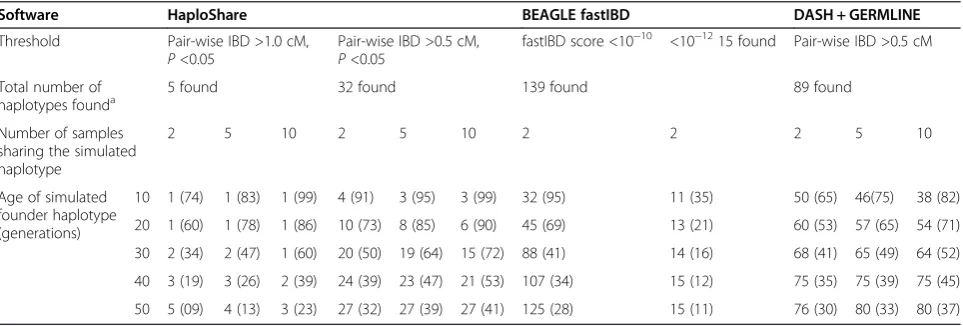
Table 2 Adjusted power and rank of the simulated founder haplotypes among all the regions found by HaploShare, BEAGLE fastIBD, and DASH
Software HaploShare BEAGLE fastIBD DASH + GERMLINE
Threshold Pair-wise IBD >1.0 cM, P<0.05
Pair-wise IBD >0.5 cM, P<0.05
fastIBD score <10−10 <10−1215 found Pair-wise IBD >0.5 cM
Total number of
haplotypes founda 5 found 32 found 139 found 89 found
Number of samples sharing the simulated haplotype
2 5 10 2 5 10 2 2 2 5 10
Age of simulated founder haplotype (generations)
10 1 (74) 1 (83) 1 (99) 4 (91) 3 (95) 3 (99) 32 (95) 11 (35) 50 (65) 46(75) 38 (82)
20 1 (60) 1 (78) 1 (86) 10 (73) 8 (85) 6 (90) 45 (69) 13 (21) 60 (53) 57 (65) 54 (71)
30 2 (34) 2 (47) 1 (60) 20 (50) 19 (64) 15 (72) 88 (41) 14 (16) 68 (41) 65 (49) 64 (52)
40 3 (19) 3 (26) 2 (39) 24 (39) 23 (47) 21 (53) 107 (34) 15 (12) 75 (35) 75 (39) 75 (45)
50 5 (09) 4 (13) 3 (23) 27 (32) 27 (39) 27 (41) 125 (28) 15 (11) 76 (30) 80 (33) 80 (37)
Shown are the rank and (detection power %) of the simulated haplotypes. a
[image:5.595.58.540.520.683.2](solid curve, Additional file 1: Figure S2). A distribution of the largest likelihood ratios (the extreme values) derived from iterations by repeated applications of this process was obtained and it follows a Gumbel distribution. The right tail to theP= 0.05 point of this distribution (dashed curve, Additional file 1: Figure S2) was used to obtain a cutoff for the log likelihood ratio of an extended haplo-type. At a selection threshold for pair-wise sharing of 1 cM, on average 7.3 × 10⁵extended haplotypes shared by two to 20 individuals among a pool of 1,000 people were found and evaluated, and on average, nine surpassed the
quasi P value cutoff in 100 repeats. Comparing these
shared haplotypes in cases with those by controls showed that on average 4.4 of them were likely to be shared by both cases and controls without significant frequency dif-ference between the two groups, and they were removed from further consideration, leaving 4.6 false positives on average. This gave an empirical false positive rate of 6.28 × 10⁻⁶(Additional file 1: Table S9). The false discov-ery rate (FDR) depends on the ratio of shared extended haplotypes associated with the underlying disease and those that are not, which is an unknown parameter. As-suming 10,000 or 1,000 non-disease associated shared haplotypes would be evaluated for each disease associated
haplotype with significant quasi P value, then FDR was
calculated as 0.059 or 0.006, respectively. Reducing the threshold for selection of pair-wise sharing from 1 cM to 0.5 cM increased adjusted power but caused a slight in-crease in the false positive rate and FDR (Additional file 1: Table S9).
We also compared the adjusted power of HaploShare with BEAGLE fastIBD + IBD-Groupon under the same level of false positive rate. Parameters from HaploShare and BEAGLE were adjusted so that the same number of non-simulated findings were detected, which made the false positive rate identical between the two methods. Summarized results showed that when controlling the false positive rate, HaploShare still demonstrated superb power against BEAGLE fastIBD + IBD-Groupon (Additional file 1: Table S10).
An important concern is how many such shared ex-tended haplotypes will be found and, what would be the rank of the recent founder haplotypes associated with diseases among all such regions found. Under the condi-tions above, the ranks of simulated founder haplotypes shared by two, five, or 10 samples (0.02%, 0.05%, and 1% of the cases) among all haplotypes reaching the threshold
were in the range of 1 to 5 on average from the 100 simu-lations (Table 2 and Additional file 1: Table S11), depend-ing on the age of the haplotype and the number of the individuals who shared it. This was significantly better than BEAGLE fastIBD and DASH tested on the same dataset, which either detected too many regions and ranked poorly the simulated founder haplotypes (BEAGLE fastIBD using fastIBD score of 1 × 10⁻¹⁰and DASH using pair-wise results from GERMLINE and pair-wise IBD >0.5 cM), or had unacceptable power if 1 × 10⁻¹²was used as the fastIBD score (Table 2).
For HaploShare, 1 cM as selection threshold for ex-tended haplotypes shared pair-wise gave a good balance of adjusted power and false positive detection. At a threshold of 0.5 cM, many more extended haplotypes reached sig-nificance (32 vs. 5), and the simulated founder haplotypes had much lower ranking among all the significant haplo-types detected. A significant gain in adjusted power was observed using 0.5 cM as the threshold (Table 2) if small numbers of individuals (for example, two or five of 1,000) shared a founder haplotype, but little if more did (for ex-ample, 10).
Computing efficiency
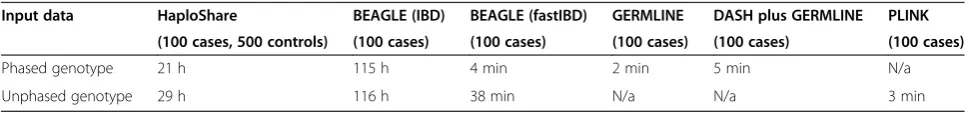
To investigate computing efficiency, 100 samples were selected as cases for both HaploShare and other pro-grams. An additional 500 samples were provided for HaploShare as controls. GERMLINE, PLINK, and BEA-GLE fastIBD took 2, 3, and 4 min, respectively, and DASH took 3 min processing results from GERMLINE, to process the 100 samples while BEAGLE IBD took nearly 5 days. HaploShare took 29 h to finish dealing with 100 cases and repeatedly (1,000 times) drawing 100 samples from controls to generate the empirical null dis-tribution of extended haplotype sharing. The major computationally expensive step for HaploShare was to combine pair-wise shared haplotypes into sharing by multiple individuals, a process not adopted by other pro-grams. Detection of pair-wise sharing by HaploShare took 5 min for 100 cases, comparable to the other faster programs (Table 3).
[image:6.595.56.541.677.734.2]There is a significant increase in computing time if the threshold for selecting pair-wise shared haplotypes is re-duced. A cutoff of 0.5 cM takes three times as long to compute as a cutoff of 1 cM. On a larger dataset with 500 cases and 1,000 controls, nearly 88 h were required to finish the analysis. The time complexity is approximately
Table 3 Comparison of computing time between HaploShare, BEAGLE, GERMLINE PLINK, and DASH
Input data HaploShare BEAGLE (IBD) BEAGLE (fastIBD) GERMLINE DASH plus GERMLINE PLINK
(100 cases, 500 controls) (100 cases) (100 cases) (100 cases) (100 cases) (100 cases)
Phased genotype 21 h 115 h 4 min 2 min 5 min N/a
quadratic in sample size (Additional file 1: Table S12). The test was run on a computer with Intel® Core™2 Quad Pro-cessor Q9650 and 8 GB of RAM.
Detection of a known recent founder haplotype (real data)
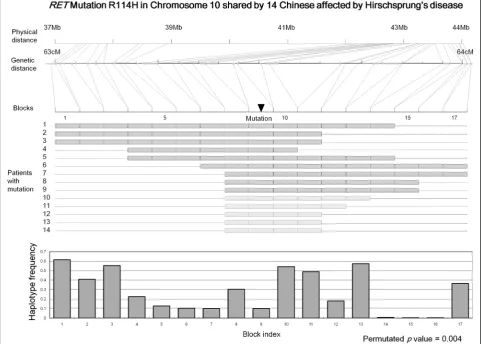
A R114H mutation in the Ret proto-oncogene (RET) is
known to be associated with Hirschsprung’s disease and shared by a small number of Chinese cases [22]. This mutation was not found in any of the Chinese controls, or in Caucasian cases or controls. An ancestral 250.2 kb haplotype on which the mutation resided was found to
be shared by all the cases who carried the R114H RET
mutation but none of the non-carriers, indicating that this mutation was probably derived from a recent founder [22].
Data on 173 Hirschsprung’s disease cases and 436 con-trols, all of whom Chinese ethnicity and genotyped by an Affymetrix 500K chip, were analyzed. Based on the
original study, 14 of the 173 cases carry the R114H RET
mutation. Evaluation by HaploShare showed that the
ex-tended haplotype on which the R114HRETmutation
re-sided had a significant quasi P value of 0.004. Several
other extended shared haplotypes reached empirical sig-nificance (31 regions with quasi P <0.05 and nine
re-gions with quasi P <0.01), which could be additional
recent founder haplotypes still to be confirmed, or false positive results caused by population stratification or
random chance. The haplotype that the R114HRET
mu-tation resided on ranked fourth among all the significant haplotypes.
For the RETlocus, a shared haplotype of about 7 Mb,
[image:7.595.57.540.341.685.2]much bigger than the reported haplotype in the original study, was detected although the region has a genetic distance of about 1 cM only (Figure 3). Nine of the 14 cases carrying the mutation were identified directly using a threshold of 0.5 cM for selecting pair-wise shared haplotypes. Five additional cases were identified
through further loosening the inclusion criterion to 0.25 cM, a built-in process of HaploShare for regions with confirmed sharing of extended haplotypes. The core haplotype region shared by all 14 cases spanned about 220 kb, consistent with the original report [22].
Discussion
Next-generation sequencing technology greatly acceler-ated the pace of novel mutation detections. However, firmly establishing a link between detected variants and an underlying disease is still difficult, largely due to the low allele frequencies of the variants and the limited number of individuals that can be sequenced. Detection of extended haplotypes that are shared potentially IBD among cases can help evaluate the rare variants found. Conversely, the individuals and regions suggested by such analyses can serve as candidates for next-generation sequencing, focusing resources on a limited number of individuals and/or regions that share a poten-tial founder haplotype.
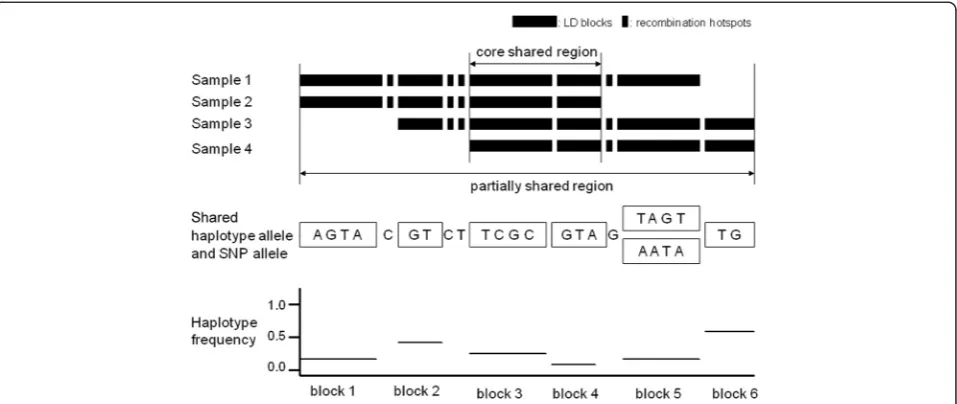
The HaploShare algorithm presented here facilitates the detection of haplotypes potentially shared IBD among multiple individuals, rather than only pairs, from a case group based on equivalent analyses in a control group. Haplotypes shared among small numbers of indi-viduals (<2% as default cutoff ) are evaluated by log like-lihood ratios of shared as IBD vs. shared by chance. By comparing these ratios to a distribution of maximal values from those equivalently analyzed in a control group, statistically significant extended haplotype sharing in cases can be identified with good power and reason-able computational speed.
These features of HaploShare lead it to outperform existing programs, showing greater adjusted power and reduced false positives, while maintaining tractable com-putational performance. By recording all possible haplo-type pairs that can explain block-wise genohaplo-types and all possible transition between blocks, HaploShare can overcome phase uncertainty that may have affected the power of algorithms based on Hidden Markov Model, which may account for most of its improvement in sen-sitivity. HaploShare is more computationally intensive than PLINK, GERMLINE, DASH, and BEAGLE fastIBD, but delivers multiple shared haplotypes, rather than only pair-wise sharing. Its computational performance is much better than BEAGLE-IBD. Most importantly, dir-ect comparison to the best sharing in controls help iden-tify sharing that is likely associated with an underlying disease.
HaploShare requires the control sample size to be lar-ger than that of the cases. If this is not practical, Haplo-Share can generate virtual samples according to LD between blocks, SNP allele frequencies and block-wise haplotype frequencies of existing samples or those from
HapMap or other studies. Many of the measures used to generate empirical null distributions of shared haplo-types reflected the compromises made due to lack of huge number of controls in practice. An alternative ap-proach is to treat cases that do not carry the haplotype under evaluation as controls. This not only increases the availability of control samples, but also provides an add-itional measure that can reduce the false positive rate if there is a population substructure mismatch between cases and controls. Although homogeneous populations are not essential for HaploShare, good matching of cases and controls is desirable. This was highlighted in the WTCCC Bipolar disorder dataset where greater case-case IBD than control-control IBD was found, probably due to different geographical origins between the cases and controls [16].
Even in an outbred population, various cryptic rela-tionships may exist. This may complicate the evaluation of extended haplotype sharing and presents a major source of false positive detections. HaploShare adopted a non-region-specific approach to evaluate sharing of ex-tended haplotypes genome-wide, based on the likelihood ratios of sharing IBD vs. by chance to reduce false posi-tive detections. To supplement this approach, an add-itional step of region-specific comparison between cases and controls was used to compare the detected regions between cases and controls, to distinguish those specific to a case group from the ones existing at the similar level in the general population. This approach signifi-cantly reduced false positive detection with little effect on power based on simulation results (Additional file 1: Table S5).
Increases in SNP coverage over that of the Illumina Beadchip 610-Quad used in the examples here, such as by making use of rare variants identified by either the 1000 Genome Project or other whole genome or exome sequencing efforts (like the exon-chip) will likely in-crease the power of detection. Thus, identification of shared ancestral haplotypes of much older age or shared by fewer individuals than demonstrated here should be possible. With modest modification, HaploShare can be made applicable to detection of potential haplotype-sharing IBD on the same locus but on different alleles by different pairs, to identify disease loci where allelic het-erogeneity may exist. If parallel computing is imple-mented, HaploShare is capable of working on thousands of samples within days. HaploShare extends our ability to evaluate extended haplotypes shared among cases that are associated with diseases with a computationally prac-tical procedure.
Conclusion
ancestral haplotypes by multiple individuals, evaluated by control data from the same population. HaploShare tackles the issue of phase uncertainty by utilizing popula-tion haplotype informapopula-tion and considering any combina-tions of haplotypes that can explain genotypes in a region. It is efficient enough to apply to large scale GWAS data. Comparison of HaploShare and other methods on both simulated and real data demonstrated its improved power and reduced false positive rate.
Materials and methods
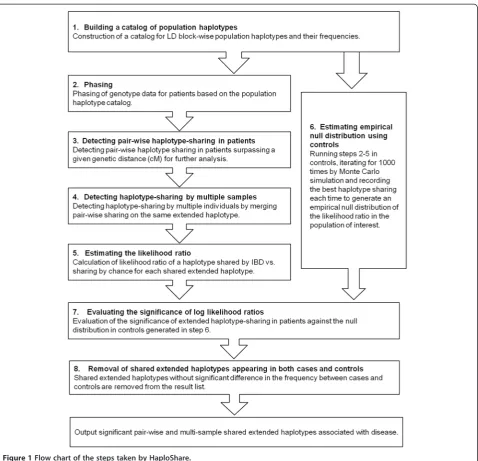
A flow chart of the seven-step processes that Haplo-Share uses in detecting and evaluating haplotype-sharing IBD is shown in Figure 1.
Step 1. Construction of a catalog of population haplotypes
The entire genome of each control subject is divided into regions of LD blocks and recombination hotspots based on LD between SNPs in healthy controls, using a modification of an earlier method [23]. A pair of SNPs is considered to have strong or weak LD if the one-sided upper 95% confidence bound of D’ is >0.98 or <0.90. Pairs between these values are not considered. If (‘strong LD’pairs) / (‘strong LD’pairs +‘weak LD’pairs) >0.95 in a region, it is considered an LD block. Otherwise it is treated as a recombination hotspot and these SNPs will be considered individually. Evaluation of LD blocks and
hotspots starts from the most 5′SNP in a chromosome.
Once the first pair of adjacent SNPs with strong LD is identified, downstream SNPs are added to the block by evaluating the LD of each addition with all SNPs in the region, until the definition of an LD block is no longer met or two adjacent SNPs are separated by >50 kb. PHASE software [24,25] is then used to generate a cata-log of haplotypes for each predefined LD block together with their population frequencies.
If no control data are available, LD blocks and recom-bination hotspots are defined from genetic distances be-tween SNP markers obtained from HapMap. A genetic distance smaller than 0.001 centiMorgans (cM) between two adjacent SNPs within 10 kb extends an LD block. The two methods usually generate similar results of LD blocks and recombination hotspots (Additional file 1: Figure S1). Phased data from the corresponding popula-tion in HapMap will be used to generate a catalog of haplotypes in this case.
Step 2. Phasing of genotypes in cases based on a population haplotype catalog
Genotypes in cases in each LD block are phased into haplotypes based on the population haplotype catalog. Several scenarios may apply. (A) Only one pair of haplo-types in the catalog can explain the genohaplo-types in a block.
(B) If more than one pair of haplotypes is consistent with the genotypes in a block, all the possible pairs of haplotypes will be recorded and used in later steps in identifying haplotype sharing. (C) The genotype can only be explained by a known haplotype together with a haplotype that does not exist in the catalog. A low popu-lation frequency, which is estimated as
hu<1− ffiffiffiffiffiffiffiffiffi 0:95 2pm
is assumed for the undetected haplotype. Here mis the
sample size of the controls used to generate the haplo-type catalog and a 95% probability of a haplohaplo-type being absent in the controls is assumed. (D) The genotypes are not consistent with any of the known haplotypes in the catalog. In this case, genotyping errors are assumed and the LD block will not be used for initial detection of haplotype sharing. However, it will not prevent extension of a shared haplotype that contains it.
Step 3. Detecting pair-wise haplotype-sharing in cases After obtaining phasing results for all the cases, pairs of individuals are scanned and compared for potential haplotype sharing across each chromosome. Only haplo-types shared in an LD block (not SNPs in recombination hotspots) are used to initiate matching. The shared re-gion is extended in both directions while supported by haplotypes in LD blocks or SNPs in hotspots, allowing for potential genotyping errors. Genotyping errors are tolerated if 1% or fewer SNPs in an extended haplotype do not comply with haplotype-sharing. No incompatibil-ity is allowed in the first and the last 20 SNPs of an ex-tended shared haplotype to avoid false extensions. Extended haplotypes shared pair-wise longer than a pre-set genetic distance (such as 0.5 or 1 cM as used in the simulations shown in this study) are selected and evalu-ated for sharing among multiple individuals.
and have a total length of shared haplotype that is at least half the threshold initially used (see step 3 above).
Step 5. Estimating the likelihood ratio of a haplotype shared by IBD vs. sharing by chance
Most shared haplotypes from the general population are short and common, although physical length can be a poor indicator [26]. True recent founder haplotypes, however, are expected to be longer and may contain multiple block-wise haplotypes of low frequency in the population. Here we introduce an estimate of the likeli-hoods of sharing due to IBD or by chance and use the logarithm of their ratio to evaluate haplotype sharing events.
If sharing is due to random chance, then inheriting haplotypes from different blocks should be independent events, disregarding weak LD between blocks. Thus, its likelihood can be estimated as the product of the likeli-hoods of inheriting haplotypes in different LD blocks.
The probability of sharing haplotype iin LD block j by
random chance by kj individuals is designated as Pj,
which, based on the population frequency of the shared haplotype and the number of individuals who share the haplotype, can be estimated as:
Pj¼hjikj⋅ 2 1
kj
2k k
The population frequency of haplotype i in block jis
hji. Here k is the number of individuals who share the
extended haplotype, and kjis the number of individuals
ink that share haplotypeiin block jandkj≦k.
2k k
stands for the number of possible combinations of k
chromosomes from a total of 2k chromosomes, and
2 1
kj
indicates that one of the two haplotypes is shared
by each of the kj individuals. The likelihood of sharing
the extended haplotype by random chance is:
L Hð Þ ¼0 ks ⋅ Ym
j¼1
Pj
where s is the total number of individuals considered
(for example, the sample size of cases), andmis the total number of LD blocks within this extended shared haplo-type. ThusL(Ho)represents the probability ofk
individ-uals sharing an extended haplotype by random chance,
and the extended haplotype has m LD blocks with
re-spective haplotype frequencies of hji. Only block
haplo-types are considered for the likelihood estimation. If the region is shared due to inheritance from a recent common ancestor, the likelihood can be estimated as a function of the estimated age, n, of the shared haplotype (generations) based on the genetic length of the region and k, the number of individuals who share the extended haplotype:
L Hð Þ ¼1 0:5n⋅k
So n×k represents the total number of meioses in
[image:10.595.60.539.89.291.2]shaping the shared extended haplotype and 0.5 is the
chance that the haplotype is inherited in each meiosis. Since different individuals may share different lengths of
the extended haplotype, n is estimated by the average
genetic distancedg(cM) of the shared haplotype for each
of thekindividuals:
E dg ¼ 100
n
An inherited haplotype of 2 cM on average indicates that approximately 50 meioses may have occurred in the surrounding region, suggesting sharing of a common an-cestor about 50 generations ago. The logarithm of the likelihood ratio of sharing by IBD and sharing by chance is then estimated as:
log10L Hð Þ1
L Hð Þ0
Step 6. Estimating empirical null distribution using controls
The likelihood ratio may be inflated due to weak LD be-tween haplotype blocks. Differences in coverage over the genome, especially on rare genetic variants may intro-duce inaccuracies. Thus a genome-wide correction is ne-cessary to make the likelihood ratio comparable across different regions. A Monte Carlo simulation process is used to survey the distribution of shared haplotypes in healthy controls.
If a region is shared bykindividuals among a total ofs
cases, then s samples are selected randomly from the
total pool of controls. For these individuals, haplotype-sharing is detected and the likelihood ratios of haplotype-sharing by IBD and sharing by chance are calculated as de-scribed above. In each simulation, the largest likelihood ratio from all the extended haplotypes in the entire
gen-ome shared by k or fewer individuals is recorded. The
reason of using the largest likelihood ratio from each it-eration to calculate the null distribution in a population rather than using those from all the extended haplotypes evaluated is a reflection of the difficulty of estimating the null distribution of the likelihood ratio while taking the multiple testing issue into consideration. Since it is very difficult to model the effect on likelihood ratios by the age of the extended haplotype and the number of in-dividuals sharing it, this constraint ensures that the ex-tended haplotypes in cases that are more recent in history are detected. This process is repeated at least 1,000 times by selecting different set of samples from controls by random. If the available samples in the con-trols are smaller than 2s, virtual samples are generated according to the SNP allele and block haplotype fre-quencies of the existing samples, as detailed below. Each simulation round uses the entire control sample except
for the extended haplotypes already selected and recorded, to avoid repeated selection of the same haplotypes among simulations. This is an approach addressing the issue that the control samples are often not large enough to allow repeated simulation without selecting the same subset of individuals between different rounds.
This generates a collection of extreme values of likeli-hood ratios on haplotype-sharing from controls, which follow a Gumbel distribution, with the goodness of fit al-ways reaching 0.99 or higher under Anderson-Darling test performed in Matlab (P >0.01, accept H0,which indicates
that the data fit the distribution). Therefore, this tion is treated as the empirical genome-wide null distribu-tion of the likelihood ratios for haplotype-sharing in the population of interest (shown as dashed curves in Figure 2 and Additional file 1: Figure S2), from which the type I error can be estimated and thresholds determined based on the area under the curve on the right tail.
If control samples are not available or are smaller than twice of that of the cases, HaploShare generates a virtual control data set based on the haplotypes and their popula-tion frequencies based on HapMap data or the provided controls. Briefly, for genotypes in blocks, two haplotypes are randomly selected with probability proportional to their population frequency. For genotypes in recombin-ation hotspots, SNP alleles are chosen by a Markov model with the chance of being selected proportional to its weak LD to its 5′SNP, as described previously [26]. This pro-cedure ensures that the block-wise haplotype frequencies and LD for recombination hotspot SNPs remain similar to those in the original HapMap samples or the limited con-trols provided.
Step 7. Evaluating the significance of log likelihood ratios
P values are defined as the probability of exceeding the observed statistic under the null hypothesis. As men-tioned above, the null hypothesis generated in this method (step 6) was not based on all the extended hap-lotypes evaluated, but the best ones from the iterations. Therefore, to avoid confusion, we used the term‘quasiP
value’ instead of ‘P value’ in this method. The ‘quasi P
value’ is not directly reflecting the false positive rate of the method, but only evaluating the significance of each haplotype sharing. The distribution generated in step 6 was applied to find the ‘quasi P values’of the haplotype sharings identified among the cases. Additional file 1: Table S10 demonstrated the way to calculate the false positive rates from certain quasiPvalues.
Step 8. Removing the extended haplotypes shared by both cases and controls without significant frequency differences
those shared in controls to find the ones overlapping in both location and allele, and without significant differ-ences in the number of individuals who share the haplo-type. For each shared haplotypes found to be significant in cases, HaploShare examines the samples in all the controls that carry the same haplotype by the following criteria: (1) there is a complete overlap on the core haplotype between sharing in cases and controls; (2) the samples in controls also share over 50% of the entire ex-tended haplotype shared in cases; and (3) there is no significant difference in the frequency of the shared haplotype between cases and controls based on Chi square test (P>0.05). The haplotypes shared in cases as well as in controls so defined are considered to be with-out evidence of association with the underlying disease and are removed from the findings.
Generation of datasets to evaluate HaploShare and other programs
A real dataset of Hong Kong Chinese samples genotyped using Illumina 610-Quad Beadchips was used to evaluate this methodology (>2,800 individuals; see Additional file for details of the data). The data was first used to evalu-ate the phasing method introduced in HaploShare. Ge-notypes from one set of 1,000 individuals were used to generate the block-wise population haplotype catalog and another set of 1,000 individuals was randomly chosen to test the phasing process. About 91% of the markers were found to be located in LD blocks and the rest in recombination hotspots. Ninety-seven percent of the block-wise genotypes could be explained by a unique pair of haplotypes; 2.7% were explained by more than one pair of haplotypes and 0.2% of the block-wise geno-types could only be explained by one known haplotype and an unknown haplotype. Very rarely were block-wise genotypes (<0.01%) not compatible with any known haplotype in this dataset, although this will depend on the size of the control sample used and the error rate of the genotyping platform.
To generate recent founder haplotypes, the meiosis process was simulated as described previously [27]. In each simulation, one sample was selected as an‘ancestor’ and several samples as the last generation‘descendants’. The genotypes of the selected samples within LD blocks were phased according to the block-wise haplotype cata-log introduced above (or by using genotypes from family members phased by BEAGLE, see below). LD between two adjacent SNPs in recombination hotspots or between LD blocks was modeled as described above. Therefore, LD both within and between blocks was taken into account in the phasing process.
After phasing, a single ‘ancestor’ SNP was randomly
chosen as the‘founder mutation’. In the simulated meiosis process, the extended haplotype carrying the mutation
was shortened through each simulated recombination event [27]. Once the range of the haplotype carrying the
‘founder mutation’was determined, one of the alleles in its location in each of the last generation ‘descendants’ was replaced with the mutation-carrying founder type to generate genotypes carrying this ancestral haplo-type. The ‘affected descendants’ created this way were mixed with other randomly chosen individuals in the
‘case’group for testing HaploShare and other programs. Additional file 1: Figure S3 shows the correlation of the genetic distance and age (generations) of the founder haplotypes simulated in this study.
An alternative method of generating founder haplo-types that is less similar to the algorithm used by Haplo-Share was also used in this study. It used data from 192 sib-pairs genotyped using Illumina 610-Quad Beadchip. Regions potentially shared IBD between siblings were defined as any region of more than 10 cM in genetic dis-tance and contains fewer than 0.1% of markers with complete genotype mismatch (discordant homozygous genotypes). For each sib pair, 960 such potential IBD re-gions of various lengths (1, 2, 3, 4, and 5 cM in genetic distance) were randomly selected. Phasing of the IBD re-gions was performed using BEAGLE [16]. The haplo-types that were shared IBD between siblings were then used as ‘founder haplotypes’ in the simulation process described above and the sensitivity of HaploShare in de-tecting the founder haplotypes generated by the two dif-ferent methods was compared.
The false positive rate and the rank of the simulated founder haplotypes among all the significant extended haplotypes shared in the entire genome were evaluated. One thousand individuals were randomly selected from the real dataset of Hong Kong Chinese samples as test-ing data in each simulation. In 100 replications each, two, five, or 10 of the 1000 individuals were inserted with a simulated recent founder haplotype of 10to 50 generations in age. All shared extended haplotypes (sim-ulated and un-sim(sim-ulated) identified by HaploShare at a
significance level of quasi P <0.05 were counted and
ranked by their quasi P values. The average number of
shared haplotypes identified and the rank of the simu-lated founder haplotypes were used to evaluate false positive detection. Due to its design constraints, BEA-GLE fastIBD can only use simulated pair-wise sharing of haplotypes derived from these simulations as a test for false positives.
Data availability
The program and the data used for test the programs are available from the following websites:
2. Hapmap genetic distance map:http://hapmap.ncbi. nlm.nih.gov/downloads/recombination/
3. Hapmap phasing genotype:http://hapmap.ncbi.nlm. nih.gov/downloads/phasing/?N=D
4. HaploShare (windows) and testing data:http://paed.
hku.hk/genome/software.htmlorhttps://github.com/
jonsonfox/HaploShare
Additional file
Additional file 1: Figure S1.Number of SNPs and the length of the haplotype blocks.Figure S2.Estimation of false positive rate.Figure S3.
Length of pair-wise sharing (cM, overlapped region only) of the simulated IBD regions of different age. Quality control of the testing data. The parameters used for GERMLINE, BEAGLE, DASH, and PLINK.Table S1.
Alternative comparison of adjusted power on detecting pair-wise haplotype-sharing IBD between HaploShare, BEAGLE, GERMLINE, PLINK, DASH, and IBD-Groupon using an alternative method.Table S2.Ninety-five percent confidence intervals of the adjusted power in Table 1.Table S3.
Comparison of adjusted power on detection of pair-wise haplotype-sharing IBD between HaploShare and others (sort by length).Table S4.Ninety-five percent confidence intervals of the adjusted power in Table 2.Table S5.
[image:13.595.305.537.99.740.2]Adjusted power of detection on shared extended haplotype significantly associated with diseases.Table S6.Adjusted power comparison on founder haplotypes generated by two different methods.Table S7.Adjusted power and rank of the founder haplotypes derived from sibpairs among all the regions found by HaploShare, BEAGLE fastIBD, IBD-Groupon, and DASH.
Table S8.Comparison of adjusted power on detecting haplotype-sharing IBD between HaploShare, BEAGLE, GERMLINE, PLINK, DASH, and IBD-Groupon on simulated data from WTCCC data.Table S9.False positive rate and false discovery rate.Table S10.Power comparison with same false positive rate.Table S11.Ninety-five percent confidence intervals of the rank in Table 2.Table S12.A breakdown of time consumed by different steps by HaploShare.
Competing interests
The authors declare that they have no competing interests.
Authors’contributions
WY designed the study; DY developed the program; WY and DY wrote the paper; YLL, PS, DKS, and LZ contributed ideas for the design and revised the paper. All authors read and approved the final manuscript.
Acknowledgements
This project was partially supported by S K Yee Medical Foundation general award (to YLL and WY). We thank Merce Garcia-Barcelo and Paul Kwong Hang Tam for kindly providing us with Hirschsprung’s disease data; DY and LZ are partially supported by SRT Genomic program of The University of Hong Kong and Edward the Sai Kim Hotung Paediatric Education and Research Fund. We also thank support from RGC of Hong Kong SAR (GRF HKU783813M, 17125114, HKU 784611 M, and HKU 770411 M).
Author details
1Department of Paediatrics and Adolescent Medicine, LKS Faculty of Medicine, The University of Hong Kong, 21 Sassoon Rd., Pokfulam, Hong Kong. 2Department of Psychiatry, LKS Faculty of Medicine, The University of Hong Kong, Pokfulam, Hong Kong.3Centre for Genomic Sciences, LKS Faculty of Medicine, The University of Hong Kong, Pokfulam, Hong Kong.4State Key Laboratory for Emerging Infectious Diseases, The University of Hong Kong, Pokfulam, Hong Kong.
Received: 2 September 2013 Accepted: 24 April 2015
References
1. Hirschhorn JN. Genomewide association studies–illuminating biologic pathways. N Engl J Med. 2009;360:1699–701.
2. Cho JH. Genome-wide association studies: present status and future directions. Gastroenterology. 2010;138:1668–72.
3. Manolio TA, Collins FS, Cox NJ, Goldstein DB, Hindorff LA, Hunter DJ, et al. Finding the missing heritability of complex diseases. Nature. 2009;461:747–53.
4. Maher B. Personal genomes: the case of the missing heritability. Nature. 2008;456:18–21.
5. Bodmer W, Bonilla C. Common and rare variants in multifactorial susceptibility to common diseases. Nat Genet. 2008;40:695–701. 6. Carvajal-Carmona LG. Challenges in the identification and use of rare
disease-associated predisposition variants. Curr Opin Genet Dev. 2010;20:277–81.
7. Cirulli ET, Goldstein DB. Uncovering the roles of rare variants in common disease through whole-genome sequencing. Nat Rev Genet. 2010;11:415–25.
8. Bansal V, Libiger O, Torkamani A, Schork NJ. Statistical analysis strategies for association studies involving rare variants. Nat Rev Genet. 2010;11:773–85.
9. Houwen RH, Baharloo S, Blankenship K, Raeymaekers P, Juyn J, Sandkuijl LA, et al. Genome screening by searching for shared segments: mapping a gene for benign recurrent intrahepatic cholestasis. Nat Genet. 1994;8:380–6.
10. Kong A, Masson G, Frigge ML, Gylfason A, Zusmanovich P, Thorleifsson G, et al. Detection of sharing by descent, long-range phasing and haplotype imputation. Nat Genet. 2008;40:1068–75.
11. Miyazawa H, Kato M, Awata T, Kohda M, Iwasa H, Koyama N, et al. Homozygosity haplotype allows a genomewide search for the autosomal segments shared among patients. Am J Hum Genet. 2007;80:1090–102.
12. Service SK, Lang DW, Freimer NB, Sandkuijl LA. Linkage-disequilibrium mapping of disease genes by reconstruction of ancestral haplotypes in founder populations. Am J Hum Genet. 1999;64:1728–38.
13. Thomas A, Camp NJ, Farnham JM, Allen-Brady K, Cannon-Albright LA. Shared genomic segment analysis. Mapping disease predisposition genes in extended pedigrees using SNP genotype assays. Ann Hum Genet. 2008;72:279–87.
14. Purcell S, Neale B, Todd-Brown K, Thomas L, Ferreira MA, Bender D, et al. PLINK: a tool set for whole-genome association and population-based linkage analyses. Am J Hum Genet. 2007;81:559–75.
15. Gusev A, Lowe JK, Stoffel M, Daly MJ, Altshuler D, Breslow JL, et al. Whole population, genome-wide mapping of hidden relatedness. Genome Res. 2009;19:318–26.
16. Browning SR, Browning BL. High-resolution detection of identity by descent in unrelated individuals. Am J Hum Genet. 2010;86:526–39.
17. Browning BL, Browning SR. A fast, powerful method for detecting identity by descent. Am J Hum Genet. 2011;88:173–82.
18. Gusev A, Kenny EE, Lowe JK, Salit J, Saxena R, Kathiresan S, et al. DASH: a method for identical-by-descent haplotype mapping uncovers association with recent variation. Am J Hum Genet. 2011;88:706–17.
19. Moltke I, Albrechtsen A, Hansen TV, Nielsen FC, Nielsen R. A method for detecting IBD regions simultaneously in multiple individuals–with applications to disease genetics. Genome Res. 2011;21:1168–80. 20. Rodriguez JM, Bercovici S, Huang L, Frostig R, Batzoglou S. Parente2: a fast
and accurate method for detecting identity by descent. Genome Res. 2015;25:280–9.
21. He D. IBD-Groupon: an efficient method for detecting group-wise identity-by-descent regions simultaneously in multiple individuals based on pairwise IBD relationships. Bioinformatics. 2013;29:i162–70.
22. Cornes BK, Tang CS, Leon TY, Hui KJ, So MT, Miao X, et al. Haplotype analysis reveals a possible founder effect of RET mutation R114H for Hirschsprung’s disease in the Chinese population. PLoS One. 2010;5:e10918.
23. Gabriel SB, Schaffner SF, Nguyen H, Moore JM, Roy J, Blumenstiel B, et al. The structure of haplotype blocks in the human genome. Science. 2002;296:2225–9.
24. Stephens M, Smith NJ, Donnelly P. A new statistical method for haplotype reconstruction from population data. Am J Hum Genet. 2001;68:978–89.
26. Zhang L, Yang W, Ying D, Cherny SS, Hildebrandt F, Sham PC, et al. Homozygosity mapping on a single patient-identification of homozygous regions of recent common ancestry by using population data. Hum Mutat. 2011;32:345–53.
27. Yang W, Wang Z, Wang L, Sham PC, Huang P, Lau YL. Predicting the number and sizes of IBD regions among family members and evaluating the family size requirement for linkage studies. Eur J Hum Genet. 2008;16:1535–43.
Submit your next manuscript to BioMed Central and take full advantage of:
• Convenient online submission
• Thorough peer review
• No space constraints or color figure charges
• Immediate publication on acceptance
• Inclusion in PubMed, CAS, Scopus and Google Scholar
• Research which is freely available for redistribution