Topology Optimization of Bridge Structures
Using Optimality Criteria Method
Akash Dhiman1, Anadi Misra2
1
PG Student, 2Professor, Mechanical Department, College of Technology
GBPUAT Pantnagar, Uttarakhand- India-263145
Abstract - Topology Optimization is a technique through which optimal distribution of material can be computed for a given structure. Optimality Criteria is one of the gradient based method through which the topology optimization of structures can be done. In this paper topology optimization of bridge structures under plane stress condition has been done through a finite element software ANSYS. For descritization of structures 8 node 82 element has been used. This work provides a mathematical approach for topology optimization of bridge structure under different loading and boundary conditions. The results of 2 point load bridge structure are validated and compared with the results obtained by Method of Moving Asymptotes.
Keywords - Topology Optimization, Optimality Criteria Method, Method of Moving Asymptotes, 8 node 82, Finite Element, Plane Stress
I. INTRODUCTION
In modern perspective the term “Optimization” is very important. In a general sense optimization means finding the best possible result for a given problem under given constraint by maximizing desired factors and minimizing undesired ones. In recent times “Topology Optimization” is a hot topic of discussion in mechanical engineering field. Topology optimization is a mathematical technique which optimizes the material distribution in a predefined design space under the given loading conditions and boundary conditions. In topology optimization a desired property of a mechanical structure is maximized such as stiffness and by minimization of weight. Topology optimization is based on Finite Element Analysis (FEA).Topology optimization is applied at the starting of design stage to arrive at a conceptual design that is then further refined in accordance with the performance and manufacturing constraint. The goal of topology optimization is to find the ideal structure where weight has been minimized and strength has been maximized. This is accomplished by iterating on the shape and topology of a structure until the model converges to an optimum arrangement. In topology optimization, the goal is to minimize a specific structural property of the structure, for example compliance. Compliance is a form of work done on the structure by the applied load. Lesser compliance means lesser work is done by the load on the structure, which results in lesser energy being stored in the structure which in turn, means that the structure is stiffer.
Mathematically,
Compliance = ∫Vfu dV + ∫S tu dS + ∑ ……...(1)
Where,
u = Displacement field
f = Distributed body force (gravity load etc.)
Fi = Point load on ith node
ui = ith displacement degree of freedom
t = Traction force
S = Surface area of the continuum
V = Volume of the continuum
There are many methods used for topology optimization such as method of moving asymptotes, genetic algorithm, BESO, ESO, optimality criterion approach etc. Here in this paper we have used Optimality Criterion Approach for the topology optimization in ANSYS. This paper considers the maximization of static stiffness through the inbuilt topological optimization capabilities of the commercially available FEA software to search for the optimum material distribution. The optimum material distribution depends upon the configuration of the initial design space and the boundary conditions (loads and constraints).
II. MATERIALS AND METHODS
A. The Optimality Criterion Approach
1035
common to use iterative optimization techniques to solve this problem, e.g. the method of moving asymptotes, optimality criteria (OC) method, to name two. Here we choose the latter. At each iteration of the OC method, the design variables are updated using a heuristic scheme.
The Lagrangian for the optimization problem is defined as: L(xj) = u
T
Ku + Λ ( ∑ jvj - Vo) + λ1 ( Ku – F ) + ∑ 2 j
+ (xmin – xj) + ∑ 3 j
( xj - 1 )………... ..(2)
Where Λ, λ1, λ2and λ3 are Lagrange multipliers for the various constraints. The optimality condition is given by:
=0 where j = 1,2,3…..n ……..… (3)
Now compliance,
C = uTKu………….………(4) Differentiating eq. (1) w. r. t. xj, the optimality condition can be written as:
Bj = - ˄ = 1………..(5)
The Compliance sensitivity can be evaluated as using equation:
= - p(xj)p-1ujT kj uj………...(6)
Based on these expressions, the design variables are updated as follows:
xjnew = max (xmin - m), if xj Bjn ≤( xmin , xmin - m)
=xjBjn, if max(xmin - m)<xj Bjn<min (1, xj +m)
=min (1, xj +m), if min(1, xj +m) ≤ xj Bjn……(7)
Where, m is called the move limit and represents the maximum allowable change in a single OC iteration. Also, n is a numerical
damping coefficient, and is usually taken to be ½. The Lagrange multiplier for the volume constraint Λ is determined at OC
iteration using a bisection algorithm. xj is the value of the density variable at each iteration step. ujis the displacement field at
each iteration step determined from the equilibrium equations.
The optimization algorithm structure is explained in the following steps: Make initial design, e.g. homogenous distribution of material.
For this distribution of density, compute by finite element method the resulting displacements and strains.
Compute the compliance of the design. If only marginal improvement in compliance over last design, stop iterations. Else, continue.
Compute the update of design variable, based on the scheme shown in equation (7). This step also consists of an inner iteration loop for finding the value of Lagrange multiplier for the volume constraint.
Repeat the iteration loop.
III. SPECIMEN GEOMETRY AND BOUNDRY CONDITIONS
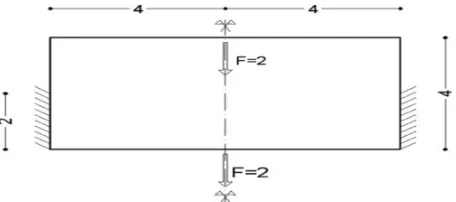
[image:3.612.194.422.580.681.2]A. Problem1. Two Point Load Bridge Structure
Figure 1 shows a clamped rectangular lamina under plane stress condition acted upon by loads in the middle points of the lower and upper side of the specimen. Young’s modulus E = 1, Poissonʼs ratio µ = .35 and volume fraction = .35. Meshing of 90 Χ 90
8 node 82 elements has been done.
Fig. 1 Design domain of two point load bridge structure
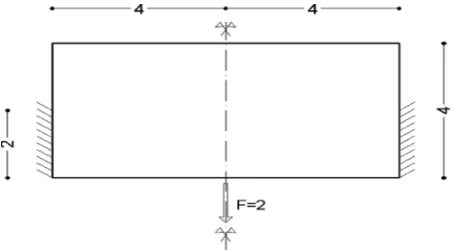
Fig. 2 represents a clamped rectangular structure under plane stress condition subjected to a point load at the middle point of the lower side. The material properties are - Young’s modulus E = 1, Poissonʼs ratio µ = .35 and volume fraction = .35.For
[image:4.612.194.421.120.246.2]descritization meshing of 90 Χ 90 8 node 82 elements has been taken.
Fig. 2 Design domain of single point bridge structure
C. Problem3.Bridge Structure Subjected To Uniformly Distributed Load
[image:4.612.195.416.339.450.2]Figure 3 shows a bridge structure subjected to uniformly distributed load at the upper edge and having the lower edge constrained. The rectangular shape must be optimized to bring the loads to the ground avoiding the chance of running into undesired designs in the plane stress context. .Here also the material properties are - Young’s modulus E = 1, Poissonʼs ratio µ = .35 and volume fraction = .35.For descritization meshing of 90 Χ 90 8 node 82 elements has been taken.
Fig. 3 Design domain of uniformly loaded bridge structure
IV. RESULTS AND DISCUSSION
In the present work topology optimization of bridge structure has been done under different loading and boundary conditions. The main objective was to minimize the compliance which is achieved in all three examples considered. The optimized shapes of the structures are shown in which red area shows solid material and white region depicts void region. The compliance versus iteration plot shows convergence of compliance.
A. Two Point Load Bridge Structure
The shape and compliance of this structure has been compared with the results obtained from Method of Moving Asymptotes. Table 1 shows comparison of compliance
TABLE I
COMPAIRING VALUES OF OPTIMALITY CRITERIA AND METHOD OF MOVING ASYMPTOTES
Method Optimality Criteria Method
1037
[image:5.612.239.379.79.146.2]Fig.4 Shape obtained by Optimality Criteria Method
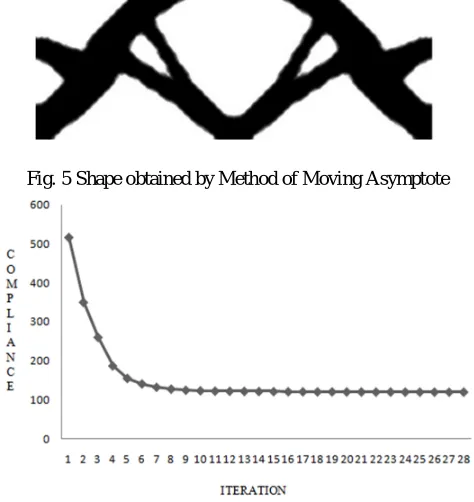
Fig. 5 Shape obtained by Method of Moving Asymptote
Fig. 6 Compliance v/s iteration graph of two point load bridge structure
Table 1 shows comparison between final compliance values obtained by Optimality Criteria Method and Method of Moving Asymptote. The result obtained by Optimality Criteria is better than Method of Moving Asymptote as the compliance obtained by former method is 9.03% smaller than the later one. Figure 4 and 5 shows comparision between shapes obtained by Optimality Criteria Method and Method of Moving Asymptotes. Both shapes are almost identical in which upper and lower arches separated by a void region. Figure 6 shows plot of compliance versus iterations in which y- axis shows compliance and x-axis shows iterations. In starting compliance falls sharply from 516.63 to 126.61. After 8th iteration graph has an almost constant slope up to final value of 119.9 in 28th iteration.
B. Single Point Load Bridge Structure
[image:5.612.187.424.215.466.2]Fig. 7 Optimized shape obtained by Optimality Criteria Method TABLE II
COMPAIRING INITIAL AND FINAL COMPLIANCE VALUES.
Initial value Final value Compliance 165.63 41.267
[image:6.612.185.428.299.458.2]From table no. 2 it can be seen that compliance is reduced from initial value of 165.63 to a final value of 41.267. This means there is an almost 4 times decrement in the compliance value thus satisfying the objective of compliance minimization.
Fig. 8 Compliance v/s iteration graph of single point load bridge structure
Figure 8 shows plot of compliance versus iteration, having compliance on y-axis and iteration on x-axis. Graph shows a steep fall of compliance from 165.63 to 50. 281 (at 7th iteration), then having a somewhat less steep slope from 50.281 to 42.211 (at 14th iteration).From 14th iteration onwards graph has a almost constant slope up to the final value of 41.267 at 24th (final) iteration.
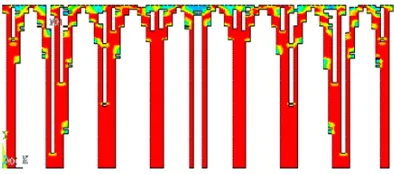
[image:6.612.208.405.623.710.2]C. Bridge Structure Subjected To Uniformly Distributed Load
Figure 9 shows the optimized shape of bridge structure subjected to uniformly distributed load at the upper side. As seen from the figure a table like structure is formed and legs coming out from it to support the load. There are certain low density areas (small green and blue patches) in the structure. The shape obtained after optimization is symmetric about the central axis. There are four pillars each on left and right side, symmetrically distributed around the central pillar. The central pillar is almost 50% void and 50% solid. The innermost and the outermost pillars on both sides of central pillar are solid while the two middle pillars (on either side of central pillar) are having void region in the middle part enclosed by solid region at the outer periphery.
1039
TABLE III
COMPAIRING INITIAL AND FINAL COMPLIANCE VALUES.
Initial Value Final Value Compliance 52960 36004
Compliance value is decreased by 16956 or by 32% thereby getting a stiffer structure than the initial one.
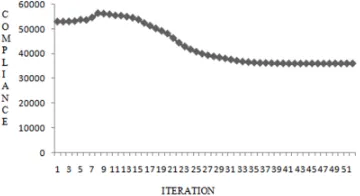
[image:7.612.216.396.181.279.2]Fig. 10 Compliance v/s iteration plot of bridge structure subjected to uniformly distributed load
Figure 10 represents a plot between compliance and iteration, having compliance on x-axis and iteration on y-axis. In this plot compliance firstly increases from 52960 (1stiteration) to 56353 (8th iteration). From 9th iteration to 16th iteration graph has an almost flat slope. From 16th to 29th iteration compliance value decreases by having a relatively large slope and from 29th to 52nd iteration graph again has an almost flat slope.
V. CONCLUSION
In this work, study of bridge structure under different loading and boundry conditions has been done. The results of Two point load bridge structure has been compared with the work of Bruggi and Venini (2007) and on observing from the results Optimal Criteria Method gives lower value of compliance by 9.03% which shows that Optimal Criteria Method by ANSYS is more effective than Method of Moving Asymptote. The structures obtained after topology optimization gives a clear understanding of where to retain the material and where to omit it for a specified volume fraction and given boundry and loading conditions. This helps in reduction of unwanted material and getting a stiffer structure than the initial one. In third structure that is bridge structure subjected to uniformly distributed load there are some green and blue low density areas which connects certain parts of roof to the legs of the structure. In proper sense the roof should be connected to the legs by solid red region, not by the low density green and blue areas but this is limitation of topology optimization that sometimes ambiguous structures are obtained.
REFERENCES
[1] Hui Zhang, Xiong Zhang & Shutian Liu, (2008) “A new boundary search scheme for topology optimization of continuum structures with design-dependent loads” Springer-Verlag 2008, Struct Multidisc Optim (2008) 37:121–129 DOI 10.1007/s00158-007-0221- 4.
[2] Kai A. James and Joaquim R.R.A. Martins, (2011) “An isoparametric approach to level set topology optimization using a body-fitted finite-element mesh”, Computers and Structures 90–91 (2012) 97–106.
[3] M. Bruggi, C. Cinquini,(2009) “An alternative truly-mixed formulation to solve pressure load problems in topology optimization”, Comput. MethodAppl. Mech. Engrg. 198 (2009) 1500–1512.
[4] M. P. Bendsøe, and N. Kikuchi, (1988) “Generating optimal topologies in structural design using a homogenization method” Comput. Meth. Appl. Mech.Eng., vol: 71: 197-224.
[5] Matteo Bruggi and Paolo Venini, (2007) “Topology optimization of incompressible media using mixed finite elements” Comput. Methods Appl. Mech. Engrg. 196 (2007) 3151–3164.
[6] Mohammad Rouhi, Masoud Rais-Rohani and Thomas N. Williams, (2010) “Element exchange method for topology optimization”, Springer-Verlag 2010, Struct Multidisc Optim (2010) 42:215–231 DOI 10.1007/s00158-010-0495-9.
[7] O. Sigmund, P.M. Clausen, Topology optimization using a mixed formulation: an alternative way to solve pressure load problems, Comput. Methods Appl. Mech. Engrg. 196 (13–16) (2007) 1874–1889.
[8] Qi Xiaa, Michael Yu Wangb and Tielin Shia, (2014) “Topology optimization with pressure load through a level set method”,Comput. Methods Appl. Mech. Engrg. 283 (2015) 177–195.
[9] Svanberg K (1987) The method of moving asymptotes—a new method for structural optimization. Int J Numer Methods Eng 24(2):359–373. [10] Xiaoping Qian, (2013) “Topology optimization in B-spline space”, Comput. Methods Appl. Mech. Engrg. 265 (2013) 15–35.