Technology (IJRASET)
Extracting Automatic Place Label from
Longitudinal Smartphone Data
Divya.M1, Prem kumar.R2, Saranya.M3
Sri Venkateswara College of Engineering and Technology, India
Abstract: The location tracking functionality provides unprecedented opportunity to the understanding of individual mobility in daily life. I am interested in understanding human mobility patterns based on sequence of place visits which encode at a coarse resolution, most daily activities. For the first ten times we are using the GPS convention, through that data can be registered in our server. After that if the connection is on or off that will not be considered through the server places can be registered. We are creating an application that can be implemented and installed in our mobile phone. Through the web service code and URL the server can be connected and data can be registered. First, we study human mobility from sequences of place visits, including visiting patterns on different place categories. Second, we address the problem of automatic place labeling from smart phone data without using any geo-location information. Our study on a large-scale data collected from 114 smart phone users over 18 months confirms many intuitions, and also reveals findings regarding both regularly and novelty trends in visiting patterns. Keywords: Smartphone Data, Human Mobility, Place Extraction, Place Visit, Place Labeling, Location Monitoring.
I. INTRODUCTION
Location is a key feature for context-aware mobile ser-vices. In particular, the places in everyday life are the an-chors around which social networks like FourSquare and location sharing services like Facebook Places have been built and are exploited, enabled by the widespread use of smartphones, which allow to provide location explicitly (via check-ins) or to infer it from sensors [1], [2]. Given the importance that places play in our lives, it is not surprising that current research is examining methods to automatically characterize places and understand their functions – from private to professional spaces and from transportation hubs to leisure sites [3], [4].
The availability of various forms of geolocation data coming from mobile phones has allowed researchers to study human mobility at large scale in recent years. Human trajectories were used to characterize a law of human motion from mobile cell-tower data in [5], how-ever the differences in travel distances and the inherent anisotropy of each trajectory must be corrected in order to observe recurrent travel patterns. In another study using Foursquare data [6], it was shown that trips are not explicitly dependent on physical distance but on the set of places satisfying the objective of the trip. These and other findings confirm that the concept of place – which has a central role in this paper– is key for studying individual mobility patterns.
When considering a user’s location traces as sequences of place visits, several questions arise for characterizing the place visit patterns such as how often the user visits new places and how this compares to the frequency with which he goes to places in general. Beyond these basic questions, we are also interested in identifying general place visiting patterns of a population and what affects place visiting patterns. For instance, do woman and men have different patterns? or how the visiting patterns change with respect to time?. Moreover, as user behavior (including place visiting patterns) is strongly dependent on the function of the places themselves, one could expect some place semantics to be inferable from sensed data. Besides characterizing the place visits, we are also interested in the problem of classifying places into categories (e.g., Home, Restaurant, etc.), that we call automatic place labeling in this paper.
Technology (IJRASET)
We are interested in studying the place labeling prob-lem in a location privacy-sensitive setting, i.e., when by design physical geolocation is not available as a feature. Labeling places in this setting is possible because all places are not created equal: our needs, obligations, and preferences impose patterns on the places we go to[5]. In other words, few places represent the routine in our daily life [13], but a variety of places (sometimes quite significant in number) are visited too. Furthermore, smartphone users are known to follow certain patterns of phone usage based on the places they are in [14]. These two aspects are valuable in the context of privacy-sensitive place characterization from smartphone data, as places are labeled not from physical location but from contextual cues available on smartphones.
Android Architecture
This paper presents a study on (1) characterization of real-life place visiting patterns from smartphone data; and (2) automatic place labeling in a location privacy-sensitive setting. Our work uses large-scale data col-lected from a population of 114 smartphone users over 18 months [15]. Our paper has three contributions. We first conduct an analysis of place visits in daily life, where places are inferred continuously from phone sen-sor data. This is unlike previous literature that uses cell-tower data (which has limitations of spatial reso-lution) and location-based social network data (which has limitations of check-in frequency). We demonstrate that in practice, beyond the few places that represent an individual’s routine structure, people tend to visit new places on a regular basis, resulting in large number of places that are visited infrequently. In the second place, we demonstrate that this aspect of human behavior has key implications, showing (through an experiment involving manual labeling of visited places) that infre-quently visited places are significantly harder to remem-ber and label accurately. In the third place, we addressed the problem of automatic place labeling without using raw geolocation coordinates. Our system achieves an accuracy of 75% in a privacy-preserving setting, and further analysis shows that the accuracy is bounded by the frequency with which a place is visited: while the few frequently visited places in phone users’ daily life can be recognized reliably, the largest fraction of places are more challenging to label. This result suggests important implications for design of mobile services.
II. RELATED WORK
Thanks to the rise of techniques for estimating people location [16], [17], the study of human mobility has emerged as a relevant topic in recent years. A large part of self-reported data used in traditional studies (e.g. [18]) could be replaced by electronic diaries generated by sensing systems [19], [20]. With a large number of built-in sensors, smartphones can record quality data without the need of additional devices. Furthermore, compared to recent efforts to collect mobility data from location-based social networks (LBSNs) like Foursquare [6], smartphones offer a definite advantage due to their ability to record data continuously if efficient systems for battery consumption are put in place [21].
Technology (IJRASET)
studied the predictability of human mobility from GSM tower data [23], whose location accuracy varies depending on the region, and is relatively coarse for locating many urban places such as cafes, restaurants, etc. In this work, we consider location data with state-of-the-art accuracy extracted from GPS and WiFi sensors, allowing us to extract meaningful places that people visit in their daily life.
Previous works on human mobility understanding dif-fer from our work on the variables under study. Besides seminal works on individual mobility [5], [23], there are recent works which focus on urban environments. In [24], it was shown that social relationships can explain a significant fraction of all human movement on data from LBSNs. In [4], location data was transformed into activity data in order to study daily activity patterns. These studies share a limitation: the lack of continuous mobility traces due to the fact that location is only available either when connections to a cellular network are made (through voice, text, or data) or when users explicitly check-in within a LBSN. Using a continuous sensing framework, Eagle was an early proponent of the identification of daily mobility patterns from simplified cell-tower data, in which each cell-tower ID was mapped to three semantic categories: Home,Work, and Other [13]. Similar tasks were also addressed by other authors [25].
The automatic extraction of places that people visit has been addressed in previous works, with different ways of defining places [3], [26], [27]. For example, in [26] a place is defined as a segment of consecutive coordinates which satisfy a upper bound distance and a lower bound duration. This definition corresponds to what we called a stay point or visit of a given place in this paper. While many recent works have considered the place extraction task [28], [29], relatively fewer attempts have been made to infer the semantic meaning of the extracted places. In the Reality Mining data set [19], cell tower IDs for Home and Work were labeled, and an incomplete list of other places were labeled too but often treated as belonging to a single group (Other). The semantic annotation of places was also studied on location based social networks [30] where place category is inferred from check-ins. Closely related to our goals, the works in [7], [31] made a first attempt to recognize user activity from location traces, conducted on a small data set involving five people for one week. Addressing the problem at a much larger scale and in a daily life setting, we face multiple challenges such as noisy data recorded in real life conditions; ob-taining human annotation of places and self-reports ofplace visits; and performing automatic place recognition without knowing the geographic location.
Our work is conducted on a large-scale mobile phone data with state-of-the-art quality of location trace using GPS and WiFi [15]. Importantly, the longitudinal, contin-uously recorded location traces allowed us to character-ize many individual mobility aspects that cannot be done with other data based on GSM tower IDs or LBSN check-ins in previous works due to temporal sparsity. Instead of relying on raw geo-location or manually annotated data, our analysis is based on an automatic place extrac-tion framework that transforms the raw location trace into a sequence of place visits. Finally, we use annota-tions collected for a subset of extracted places, which are used both to understand place visiting patterns and to infer the place category from smartphone data.
III. PROBLEM STATEMENT
A. Data And Preprocessing
1) Data Collection: The data set comes from the Lausanne Data Collection Campaign (LDCC) [15], which was collected using Nokia N95 smartphones on a 24/7 basis in French-speaking Switzerland. The recording software is designed to run in the background, uploading recorded data automat-ically once a day via a user-defined WiFi connection. Since activating all sensors will wipe out the battery within a few hours, the sensing software was optimized with a state machine [15] which allows dynamic sam-pling rates (e.g. turn GPS off if the phone is detected to be indoors). At the end, users can record data continu-ously with the only restriction of charging the phone once a day. Also, participants were given additional battery chargers to charge the phone on the car or in the office if necessary. Finally, location data is not available when people go outside Switzerland due to the need of internet connection of the GPS module. The data comes from a period of 18-months started in late 2009. The data features 114 volunteer users who carry the smartphone as their main and unique mobile phone. Most of users are 20-40 years old, distributed between professionals and students from two univer-sities. On average, each user contributed 14 months of data including non-recording time for which the phone was off (roughly 17% non-recording user-days). The data corresponds to 20M geographic coordinates, 768K app log events, and 26M Bluetooth records, among several other sensor types.
Technology (IJRASET)
being segmented into multiple short visits. Note that the chosen region size is similar to the one reported in previous work on place recognition [28] with GPS data, which studied 3 different sizes: 200m 200m, 300m 300m, 400m 400m in which 300 300 was regarded as a reasonable choice. We use a recent place extraction approach [29] which consists of two steps. In the first step, the raw location trace is segmented into stay points and transitions. A stay point corresponds to a subsequence of the location trace for which the user stayed within a small circular regions (radius=100 meters) for at least 10 minutes. Note that a place (e.g., a restaurant) that the user visited mul-tiple times corresponds to multiple stay points, having similar geographic regions but differ in the timestamp of the visit. In the second step, a grid clustering algorithm is applied on the centers of these stay points, which results in a list of places. The clustering algorithm divides the space with a uniform grid, where each cell is a square region of side length equal to 30 meters. It starts with all stay points in the working set and an empty set for stay regions. At each iteration, the algorithm looks for the 5 5-cell region that covers most stay points and removes the covered stay points from the working set. This process is repeated until the working set is empty. Finally, the centers of 5 5-cell regions are then used to define circular stay regions that we called places. In our framework, the place extraction is done for each user separately, therefore places are user-specific. The place extraction step outputs more than 10,000 dis-tinct places for the set of 114 users. By mapping the raw trajectory data between these places, we obtain a sequence of check-ins and check-outs on the set of places. After filtering out short duration visits of less than 10 minutes, the whole data contains 107,000 visits with a total stay duration of 618,000 hours, covering 65% of the time when the sensing software was active.
3) Data Annotation: Place annotation process. In order to validate the placeextraction framework and collecting ground truth for place labeling task, users were asked to label their places as shown on an online map at the end of the recording period. We first described this process in [14]. Due to the large number of discovered places, annotation was obtained for only a small subset of discovered places. Each participant was asked to annotate a set of eight automatically selected places (among many others), con-sisting of the five most frequently visited locations of the user during the recording period, and three infrequent places that were randomly chosen from the lowest tenth percentile (in terms of total time spent). Each of the eight places was presented to the user, one by one, in random order, on an online map.
(%
) 100 (%) 100
80 80
U se rs us e r s
60 60
O
f of
e 40 pe rc e nt a ge 40
20 20
0 0
1 2 3 4 5 6 50 100 150 200 number of visits per day total number of places
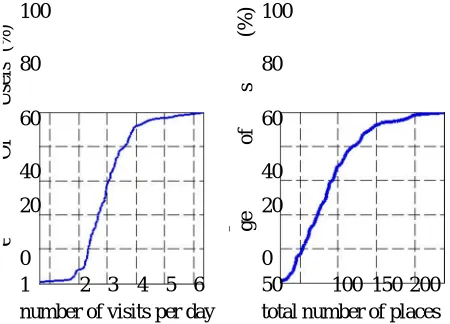
Fig. 1. Cumulative distribution of users with respect to the average number of visits per day and the number of dis-tinct places visited during the data collection campaign.
and not sure. For the second question, “This location is highly relevant to me.”, the user chose a score from 1 (totally disagree) to 5 (totally agree). The third question concerns the visit frequency, “I visit this location ...”, where the user selected one among 6 options: Once a day or more, 4-6 times per week, 1-2 times per week, 1-3 times per month, Less than once a month, and Never. Finally, the user was asked to select the most appropriate place label from a list of 22 mutually exclusive predefined labels. Besides the list of labels, there is a special category named ”I don’t know” which was introduced for places that the user could not remember or did not want to provide annotation for. In practice, 17% of the selected infrequent places were labeled as ”I don’t know” while only 3% of the selected top places were assigned the same label. The total number of places annotated in this way was 912.
[image:5.612.192.417.394.556.2]Technology (IJRASET)
information about the user such as age or gender was also collected. Each user filled in a questionnaire regarding demographic attributes. Besides age and gender, users also declared their marital status and their job position. There are three categories of marital status: single or divorced, in a relationship, and married or living with partner. Regarding job, there were four categories in increasing order of position: Training (e.g., university student, apprentice, trainee), PhD stu-dent, Non-executive Employee, and Executive Employee.
IV. PROPOSED SYSTEM
The proposed system work is carried out in the following steps:
1. The user has options like to check his/her current location on Google Map located by marker, finding the most popular and known sites like schools, colleges, hotels, and hospitals those are near or comes within a specific range as per current location.
2. Database server evaluates user request as a query by applying the current location information of users, a. Location information updates continuously as per the change of location of moving mobile user. b. Find the road network distance from current location to interest point by using the Google API Services.
3. Once the query has been submitted; every time the result of it reevaluated as per changed location, and passed to the mobile user. The proposed system has been implemented using the Android SDK with the Eclipse IDE and AVD (Android Virtual Device) emulator . An emulator provides the android hardware and software environment.
A. Place Visiting Patterns
Our analysis starts with basic statistics of places and their dynamics. We address the following questions: How many places do people go to in everyday life? How often are these places visited? How often do people visit new places? What are the effects of demographics and calendar in the dynamics of place visits? Each key finding is highlighted below in bold italic font.
How many places do people visit? Figure 1(left) illus-trates the cumulative distribution of users with respect to the average number of visits per day, showing that a large fraction of people visited from 2 to 4 places per day. Note that the typical home-work-home dailyroutine corresponds to 2 visits per day since we only count the check-in time of visits: one at Work in the morning, and one at Home in the evening.
For example, the foursquare data in [32] is highly sparse, with one checkin every five days on average, while in [5], [23], location data is only available when people make calls or send SMS .
We estimated that, on average, each person visited 90 distinct places during the data collection campaign. To get clearer understanding on the variation among peo-ple, Figure 1(right) shows the cumulative distribution of users with respect to the number of distinct places visited during the study. Most people visited 50-150 places, furthermore there are 8% of users who visited more that 150 places, and 16% of users visited less than 50 places during the recording period. We remark that the recording time varies from 4 to 18 months depending on the user, so the results presented here are influenced by that fact. More reliable measures related to the number of places people visited will be considered later in the section.
How often are places visited? While people can easilyprovide a list of frequently visited places in their lives, it would be hard to exactly recall the list of places visited only a few times, even for those that correspond to valuable experiences. Studying the set of places that people visited during one year and a half, we found a simple explanation to this observation: there are a hugenumber of infrequently visited places compared to a few places places that people usually go. we show the cumulative distributions of the number of places with respect to visit frequency. Note that the linear shape of the log-log plot in the inset of suggests that the distribution follows the Zipf’s law, which is popular for distributions of frequency over rank. One half of the places were visited only once during the campaign, and the fraction of places that were visited more than once a month is less than 10%, while only about 3% of places were visited at least once a week. This also means that over the set of places that people visited for at least 10 minutes, the largest fraction corresponds to places that were only occasionally visited.
B. Analyzing The Semantics Of Places
Technology (IJRASET)
history? Does the reported visiting frequency match the estimates based on mobile phone data? How do people spend time in the main place categories? Again, we highlight the answers to these questions in bold italic font.
Validation of discovered places. Participants wereasked to give relevance scores (from 1 to 5) assessing how the selected places were relevant to them. On one hand, 95% of the top places were confirmed to have been visited and to be relevant to the user. About 70% of the top places got positive scores (4 or 5) for the question on relevance, and about 21% of the top places got a border-line score (3). Surprisingly, about 9% of the top places in terms of time spend on them are not highly regarded by their users. Focusing on these places, we found about one third of them are frequently visited places such as Home, Work, Restaurant , Home of a friend, or Train Station, which means that not all significant places interms of amount of location traces are significant to the users. Besides frequently visited places, there are also several insignificant places (e.g., a park next to home) and infrequently visited places in which people stayed for long time (e.g., a hotel) which were in the top 5 but deemed as not relevant. On the other hand, about one fifth of the infrequent places are not remembered by the user, and these places are much less relevant to the user than the top places. 43% of these places got relevance score of 1 or 2. After a close inspection, the lowest tenth percentile of the discovered places contains many one-time, short-visit places such as a break spot during a could not compute the false negative rate (visited but undetected) of the place discovery method, however a study [29] with a similar place discovery algorithm on a small subset (8 users over 5 months) of the data shows that the false negative rate is about 15% due to missing data (e.g., phone off, sensing failure).
Statistics of annotated places. For further analysis,all annotations were inspected manually in order to avoid ambiguous regions (e.g., a restaurant near a train station), filtering out annotations with low certainty (e.g. places that people were unsure they had visited). Due to the imbalance among categories, we redefined a new set of 10 main categories as shown in Figure 5. Home stands for the user’s main home and Friend-Home stands for home of a friend or relative. The category Work/School consists of four raw labels that were pre-sented to users: main working place, part-time working place, main school, and other school. Similarly, Friend-Work/School consists of three raw labels: working place of a friend or relative, school of a friend or relative, and school or daycare of my child. The Transportation category corresponds to transport-related places (e.g., bus stop, metro station, etc.) but not to being on a transport. Outdoor sport corresponds to outside activities such as walking, hiking, skiing while Indoor sport is the category for gym, badminton, etc. The last three main categories (i.e., Restaurant or bar, Shop or shopping center, and Holiday) correspond to raw labels that were presented to users. Other raw labels that were presented to users are: my free-time home, other location my child visits, cultural or entertainment location, night club, non sports related hobby, place to hang out or relax, and Other & I don’t know. At the end, we got 488 annotated places in the 10 main categories as shown in Figure 5, and a special category called Other consisted of annotated places that do not belong to the 10 main categories or places with low certainty annotation. The set of top-five places was dominated by the three categories Home (26%), Work/School(15%) and Friend-Home (30%), while List of 10 main place categories and some basic attributes. While the set of places that were asked for annotation cover 90% of staying time, the set of annotated places that belong to the 10 main category covers 78% of staying time.
Label #places #visits time(hours) Home 122 30343 350814 Friend-Home 76 3388 23681 Work/School 142 22638 105721 Transportation 36 208 114 Friend-Work/School 14 571 1125 Outdoor sport 31 478 1317 Indoor sport 19 669 1030 Restaurant or bar 14 432 676 Shop or shopping
center 24 408 399 Holiday 10 28 212 Total of main
Technology (IJRASET)
the set of selected infrequent place are dominated by
Transportation (24%), Shopping (15%), and Other (28%). Looking for places that are not relevant to their users, we found that most Holiday places are not highly regardedby their users, while about half of the Shopping places are marked as not important. Among the remaining categories, Transportation and Outdoor sport also have high fractions of irrelevant places, which probably cor-respond to infrequently visited places such as a stop in the mountain or a bus stop. Finally, Table 2 reports the exact number of annotated places and other statistics for each main category. As can be seen, while the main 10annotated categories consist of few number of places (4.7% of the total number of places), it covers more than half of the visits, corresponding to 78% of the total stay time in both annotated and unannotated places. Friend-Home is the third most popular category after Home and Work/School, reflecting the fact that many people visited their friends or relatives on a regular basis.
C. Automatic Place Labeling
The set of annotated places allow us to study the task of automatic place labeling in a supervised learning framework. We consider the place labeling task as a multi-class classification task with 10 place categories. Our place labeling systems employ a random forest [37] as basic classifier. Feature selection was done using greedy forward search with cross-validation accuracy as criterion. While random forests can deal with multi-class classification tasks, we observed that the multi-class random forest is biased by popular categories (e.g. Home or Work) and does not focus on discriminating rare categories. For this reason, we also trained a one-vs-all random forest for each category, and then combined the votes of one-one-vs-all random forests to decide the winner class. In this setting, feature selection was ran separately for each one-vs-all problem. All evaluation measures are computed in a leave-one-user-out setting, i.e., the system is trained on annotated places of 113 users, then tested on the annotated places of the remaining user.
System Architecture
Extracting location privacy-sensitive features
We focus on four categories of features derived from four data types: 1) mobility data; 2) application usage; 3) Blue-tooth; and 4) WiFi. As discussed, our system is placed in the context that privacy has high priority. Sensitive information (e.g., absolute position or Bluetooth MAC address of observed devices) are neither stored nor sent to any external database in form of queries.
nor-Technology (IJRASET)
malized time spent per month considering only months when the place was visited.Visiting time in the weekly calendar. We consider different time slots in the weekly calendar and estimate mobility features for each time slot, such as the percentage of visits intersecting with night time (0-6am). We also com-puted the average time per month that the user spent at the place in a given time slot, and the conditional probability of a time slot given that the place is visited.
Note that no geolocation information is used by our place labeling system as this data type is intrusive in terms of privacy [9]. This is one key difference between our work and previous analysis using external databases (e.g. Microsolf Map Point [8], [7]) to query for types of nearby businesses and other information. The full set of mobility features is described in Table 3. Some features (e.g., number of visits) are more relevant if we consider the relative rank among all places that a user visited (e.g. the most visited place, the second most visited place, etc.) rather than the absolute number. For this reason, we also use the rank of the value as a feature.
V. ALGORITHM DETAILS
Density-based and/or grid-based approaches are popular for mining clusters in a large multidimensional space wherein clusters are regarded as denser regions than their surroundings. In this chapter, we present some grid-based clustering algorithms. The computational complexity of most clustering algorithms is at least linearly proportional to the size of the data set. The great advantage of grid-based clustering is its significant reduction of the computational complexity, especially for clustering very large data sets.The grid-based clustering approach differs from the conventional clustering algorithms in that it is concerned not with the data points but with the value space that surrounds the data points. In general, a typical grid-based clustering algorithm consists of the following five basic steps:
A. Creating the grid structure, i.e., partitioning the data space into a finite number of cells. B. Calculating the cell density for each cell.
C. Sorting of the cells according to their densities. D. Identifying cluster centers.
E. Traversal of neighbor cells.
VI. FINAL DISCUSSION AND IMPLICATIONS
This study contributes to our understanding of places in people’s daily lives and to the possibility of inferring place categories from smartphone data.
Our analysis is based on the LDCC mobile sensing framework that extracts automatically places that peo-ple visit. While people usually follow simple routines involving a few frequent places, we observe that most of them keep exploring new places, resulting in a large number of places for many individuals. If people could receive relevant recommendation for new places (e.g., restaurants, leisure-related places, etc.), the number of visited places could be even higher. The study suggests that personalized recommendation could be a plausible approach. For instance, the number of distinct places per week has significant correlation with other variables such as the frequency at which people visit new places, and this might suggest what users might find such service useful.
Together with annotation, we also used feedback on the meaning and the quality of some of the discovered places (5 top frequent places and 3 infrequent places). Highly positive feedback was obtained for the set of frequent places, with 95% of them confirmed by the users. Interestingly, one fifth of the set of infrequent places were not remembered by people. While some of these places might actually not be important for users, we believe that if the phone was able to remind the user about events that might have been forgotten, they could elicit positive personal uses related to memory and self-reflection.
Along with this analysis on place labeling, the pre-diction task was proposed as part of the Mobile Data
Challenge [38]. Our results in this paper show that it is not easy to recognize the semantic meaning for
Technology (IJRASET)
due to many factors including the current privacy-sensitive data we use. This is a valuable result if privacy is the main concern (i.e., if users wanted that the category of certain infrequent places could not be inferred automatically).
If the category of infrequent places is not a privacy concern, one could think of adding more sensors to the smartphone in order to improve the recognition rate of infrequent places, besides collecting more training data. For example, a light sensor and a thermometer could help recognizing indoor-outdoor environments with-out heavy battery consumption. Acoustic noise sensors could be a privacy-sensitive solution for adding audio data. We remark that while the absolute recognition rate is low for many infrequent categories, the results are still promising and our current system could be useful even for complex situations. For example, in the case of confusion among a few categories, the system could present the most likely categories to the user asking for annotation. This could be a reasonable solution if the required amount of interaction was minimal and there were clear incentives for users to tag their own data. This direction might be investigated in the future.
VII. ACKNOWLEDGMENTS
I wish to thank, first and foremost, my Professor MR.R. PREM KUMAR and my parents…
REFERENCES
[1] A. Noulas, S. Scellato, C. Mascolo, and M. Pontil, “An empirical study of geographic user activity patterns in foursquare,” in Proc.ICWSM ’11, 2011, pp. 570– 573.
[2] Schwinger, W., Grin, C., Prll1, B., and Retschitzegger, W. A lightweight framework for location-based services. In Lecture Notes in Computer Science (Berlin, 2005), Springer, pp. 206_210
[3] Sandeep Kumar, Mohammed Abdul Qadeer, Archana Gupta, ―Location Based Services using Androidǁ , IEEE 2009.
[4] N. Kiukkonen, J. Blom, O. Dousse, D. Gatica-Perez, and J. Laurila,“Towards rich mobile phone datasets: Lausanne data collection campaign,” in Proc. ICPS, Berlin, 2010.
[5] D. Kim, Y. Kim, D. Estrin, and M. Srivastava, “Sensloc: sensing everyday places and paths using less energy,” in Proc. Sensys ’10.ACM, 2010, pp. 43–56. [6] L. Vu, Q. Do, and K. Nahrstedt, “Jyotish: A novel framework for constructing predictive model of people movement from joint wifi/bluetooth trace.” in PerCom’11, 2011, pp. 54–62.
[7] C. Song, Z. Qu, N. Blumm, and A.-L. Barabsi, “Limits of predictability in human mobility,” Science, vol. 327, no. 5968, pp.1018–1021, 2010.
[8] E. Cho, S. A. Myers, and J. Leskovec, “Friendship and mobility: user movement in location-based social networks,” in Proc. KDD, 2011, pp. 1082–1090. [9] K. Farrahi and D. Gatica-Perez, “Probabilistic mining of sociogeographic routines from mobile phone data,” IEEE J-STSP, vol. 4,no. 4, pp. 746–755, 2010. [10] J. H. Kang,W.Welbourne, B. Stewart, and G. Borriello, “Extractingplaces from traces of locations,” in Proc. WMASH 04. ACM Press,2004, pp. 110–118. [11] M. Kim, D. Kotz, and S. Kim, “Extracting a mobility model from real user traces,” in Proc. INFOCOM ’06. Barcelona, Spain: IEEE Computer Society Press,
April 2006.
[12] V. W. Zheng, Y. Zheng, X. Xie, and Q. Yang, “Collaborative location and activity recommendations with gps history data,”in Proc. WWW. ACM, 2010. [13] R. Montoliu and D. Gatica-Perez, “Discovering human places of interest from multimodal mobile phone data,” in Proc. MUM, Limassol, Cyprus, 2010, pp.
12:1–12:10.
[14] M. Ye, D. Shou, W. Lee, P. Yin, and K. Janowicz, “On the semantic annotation of places in location-based social networks,” in Proc.KDD ’11. ACM, 2011, pp. 520–528.
[15] H. Cramer, M. Rost, and L. E. Holmquist, “Performing a checkin: emerging practices, norms and ’conflicts’ in location-sharing using foursquare,” in Proc. MobileHCI ’11. New York, NY, USA:ACM, 2011, pp. 57–66.
[16] M. C. Gonzalez, C. A. Hidalgo, and A.-L. Barabasi, “Understanding individual human mobility patterns,” Nature, vol. 453, no.7196, pp. 779–782, June 2008. [17] R. Lu, X. Lin, X. Liang, and X. Shen, “Secure Provenance: The Essential of Bread and Butter of Data Forensics in Cloud Computing,” Proc. ACM Symp.