IJPSR (2019), Volume 10, Issue 10 (Research Article)
Received on 25 January 2019; received in revised form, 24 April 2019; accepted, 14 June 2019; published 01 October 2019
HPTLC METHOD DEVELOPMENT AND VALIDATION FOR IDENTIFICATION AND QUANTIFICATION OF LUPEOL IN THE LEAVES OF ALSTONIA SCHOLARIS
M. M. Sanaye * and S. Zehra
Prin. K. M. Kundnani College of Pharmacy, Cuffe Parade, Colaba, Mumbai - 400005, Maharashtra, India.
ABSTRACT: In ancient literature plant Alstonia scholaris (Apocynaceae) has
been considered medicinally important in the treatment of various ailments. Extracts of this plant have shown wide spectra of pharmacological activities like anti-cancer, hepatoprotective, anti-inflammatory, anti-diabetic, etc. These activities can be attributed to the depositories of various phytoconstituents like alkaloids, flavonoids, phenols, triterpenoids, saponins, etc. present in it. Thus, a simple and precise HPTLC method has been developed for identification and quantification of a pentacyclic triterpenoid- lupeol in the leaves of Alstonia scholaris. The developed method was validated following ICH guidelines concerning linearity, range, specificity, precision, accuracy, LOD, and LOQ. After derivatization, the optimized mobile phase Toluene:Ethyl acetate: Formic acid (7:2:1 v/v/v) exhibited good resolution of bands at 580 nm. The Rf value of
lupeol was found to be 0.63 and amount quantified in ethanol and chloroform extracts of leaves was 0.31 and 0.35% w/w respectively. The calibration curve of lupeol was linear between 200-1000 ng/band with correlation coefficient 0.9990. LOD and LOQ were 55 and 166.69 ng/band respectively. Recovery was 91.88%. Thus the developed method was found to be specific, precise, and accurate for identification and quantification of lupeol in the leaves of Alstonia scholaris and can be used for routine analysis of the plant.
INTRODUCTION: Since antiquity, natural products have played a crucial role in the treatment and prevention of various health conditions of mankind across the globe. In recent years, there has been a witness of the increased resurgence of interest in natural products for treatment and management of diseases, which is evident from the greater inclination of developed countries towards the use of herbal drugs and remedies 1.About 50% of the approved drugs during the last few years are either directly or indirectly derived from natural products 2.
QUICK RESPONSE CODE
DOI:
10.13040/IJPSR.0975-8232.10(10).4598-04
This article can be accessed online on
www.ijpsr.com
DOI link: http://dx.doi.org/10.13040/IJPSR.0975-8232.10(10).4598-04
The global market of products derived from plants is estimated to be 83 billion dollars and continues to grow 3.According to reports of WHO, between 65-80%populations of developing countries use the medicinal plant as remedies 4. One such medicinal plant, Alstonia scholaris Linn. R. Br. (Apocynaceae) popularly known as “Saptaparni” has been used since long back for treatment of many disease conditions. It is known for its pharmacological activities like anti-oxidant 5, anti-bacterial 6, Broncho-vasodilatory 7, hepatoprotective 8, anti-cancer 9, anti-diabetic 10, anti-stress 11, anti-urolithiasis 12, analgesic and anti-inflammatory 13 activities. These activities can be attributed to the rich amount of various secondary metabolites like alkaloids, glycosides, flavonoids, triterpenoids, steroids, saponins, and phenols present in them 12.
Amongst various phytoconstituents, pentacyclic triterpenoids have received greater attention of
Keywords:
Alstonia scholaris,Pentacyclic triterpenoid, Lupeol, HPTLC,
Quantification, Validation
Correspondence to Author: Dr. (Mrs.) M. M. Sanaye
Associate Professor,
Prin. K. M. Kundnani College of Pharmacy, Cuffe Parade, Colaba, Mumbai - 400005, Maharashtra, India.
researchers during the last few decades due to its wide spectrum of pharmacological activities. Many of these triterpenoids and their derivatives are being marketed as therapeutic agents or as a dietary supplement around the world 14. Lupeol (also known as fagarasterol) is one such active pentacyclic triterpenoid and phytosterol derived from lupane subgroup. It is reported to be non-toxic in animals up to 2000 mg/kg 15 and well known for its beneficial activity against inflammation, cancer, arthritis, diabetes, cardiovascular diseases, renal disorder and hepatic toxicity 16.
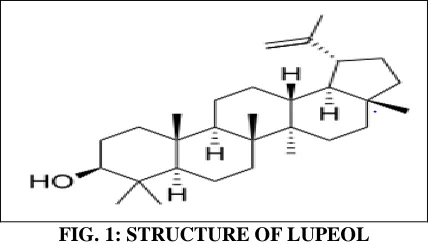
FIG. 1: STRUCTURE OF LUPEOL
Upon investigation, a good amount of active pentacyclic triterpenoids has been reported to be present in leaves of A. scholaris 17.Thus, attempts have been made in the present study to develop quick and simple HPTLC method to identify and quantify lupeol in the ethanol (EtAS), and chloroform (ChAS) extracts of leaves of A. scholaris. Also, the developed method was validated following ICH guidelines for the extract possessing greater amount of lupeol.
MATERIAL AND METHODS:
Plant Material: The fresh leaves of A. scholaris were procured from Joginder Nursery, Delhi. Leaves were shade dried, crushed, and ground to obtain a coarse powder. This powder was subjected to Soxhlet extraction using ethanol and chloroform as solvents to get EtAS and ChAS extracts of leaves of A. scholaris. Extraction was continued till the siphon tube showed colorless solvent, after which extracts obtained were collected. Excess of solvent from each extract was evaporated on an electronic water bath to obtain semi-solid mass. All extracts were stored in air tight container in the refrigerator at 2-8 °C.
Fresh leaves of A. scholaris with flowers were authenticated at St Xavier’s Blatter Herbarium under specimen number NI-1417 of N. A. Irani.
Chemicals and Reagents: Standard Lupeol (purity ≥94%) was procured from Sigma Aldrich (USA). Methanol, toluene, ethyl acetate, and formic acid were of analytical grade and purchased from S.D. Fine Chem Ltd., (Mumbai, India). Anisaldehyde sulphuric acid (ASR) reagent was freshly prepared and used. All the other chemicals used were of analytical grade and procured from authorized vendors.
Instruments: Linomat V sample applicator, Twin trough developing chamber (20 × 10 × 4 cm), Chromatogram immersion device III, TLC plate heater, TLC plate scanner used were from Camag (Muttenz, Switzerland) and 100 µL Hamilton syringe (Sigma-Aldrich, United States).
Standard Stock Solution Preparation: 10 mg of standard lupeol was accurately weighed and transferred to the 10 ml volumetric flask. This was initially dissolved in 5 ml of methanol, sonicated at 2500-3000 rpm for 30 min and then diluted up to the mark with methanol which gave a stock solution of 1 mg/ml.
Sample Solution Preparation: 100 mg of EtAS and ChAS were accurately weighed and transferred to 10 ml volumetric flask each. The extracts were initially dissolved in 5 ml of methanol, sonicated at 2500-3000 rpm for 30 min, filtered through Whatman filter paper no. 41 and diluted up to the mark with methanol, which gave a stock solution of 10 mg/ml.
Year of Experimentation and Site: Experiment was performed in the year 2018 at Prin. K. M. Kundnani College of Pharmacy and Anchrom Laboratory, Mumbai, India.
Method:
Identification of Lupeol: Extracts EtAS and ChAS (2 and 5µl each; 10 mg/ml), standard lupeol (2 and 5µl; 1 mg/ml) were loaded on Aluminium silica gel 60 F254 TLC plate. Also, extracts (5 µl each; 10
mg/ml) were spiked with standard (5 µl; 1 mg/ml) on same TLC plate.
Preparation of Calibration Curve for Quantification: Amount of lupeol present in EtAS and ChAS was determined by constructing a calibration curve of standard lupeol. Different concentrations of standard lupeol 0.1, 0.2, 0.3, 0.4, 0.5 mg/ml (2 µl each) and extracts EtAS and ChAS (10 µl each; 10 mg/ml) were loaded on TLC plate
[image:3.612.53.566.182.427.2]in triplicate. The plate was developed and scanned according to the chromatographic conditions mentioned in Table 1. Calibration curve of lupeol was obtained by plotting peak areas (×106) vs. concentration of lupeol applied. Amount of lupeol in each extract was calculated from this calibration curve.
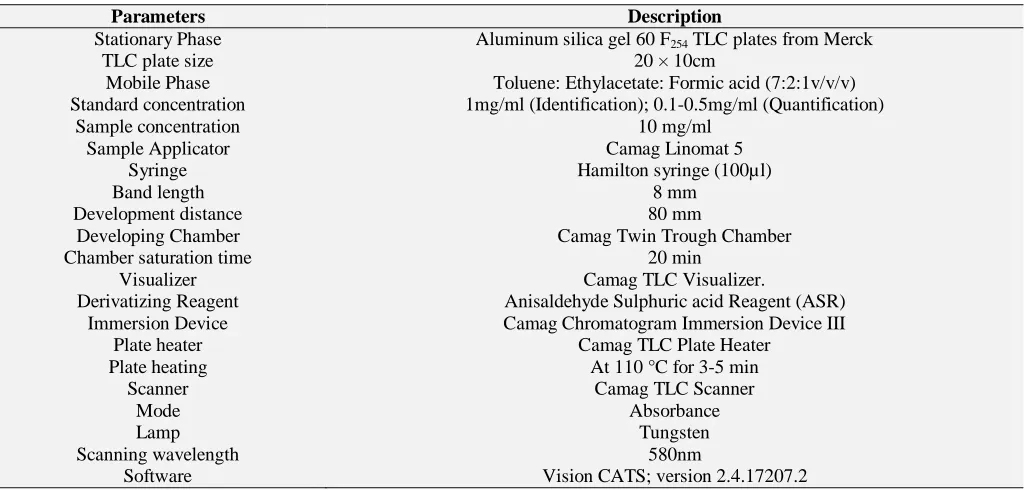
TABLE 1: OPTIMIZED CHROMATOGRAPHIC CONDITIONS FOR IDENTIFICATION AND QUANTIFICATION OF LUPEOL IN EXTRACTS EtAS AND ChAS
Parameters Description
Stationary Phase Aluminum silica gel 60 F254 TLC plates from Merck
TLC plate size 20 × 10cm
Mobile Phase Toluene: Ethylacetate: Formic acid (7:2:1v/v/v) Standard concentration 1mg/ml (Identification); 0.1-0.5mg/ml (Quantification)
Sample concentration 10 mg/ml
Sample Applicator Camag Linomat 5
Syringe Hamilton syringe (100µl)
Band length 8 mm
Development distance 80 mm
Developing Chamber Camag Twin Trough Chamber
Chamber saturation time 20 min
Visualizer Camag TLC Visualizer.
Derivatizing Reagent Anisaldehyde Sulphuric acid Reagent (ASR) Immersion Device Camag Chromatogram Immersion Device III
Plate heater Camag TLC Plate Heater
Plate heating At 110 °C for 3-5 min
Scanner Camag TLC Scanner
Mode Absorbance
Lamp Tungsten
Scanning wavelength 580nm
Software Vision CATS; version 2.4.17207.2
Validation: The developed HPTLC method was validated for quantification of lupeol in extract ChAS as per the guidelines laid down by International Conference on Harmonization (ICH) concerning linearity and range, specificity, precision, accuracy, the limit of detection (LOD) and limit of quantitation (LOQ) 18.
Linearity and Range: The stock standard solution (1mg/ml) was diluted with methanol to obtain 0.1, 0.2, 0.3, 0.4 and 0.5 mg/ml concentration solutions, which gave 200, 400, 600, 800, 1000 ng/band on plate with 2µl of application volume. Regression equation, correlation coefficient (r2), coefficient of variation (% CV), or relative standard deviation (% RSD) of the calibration curve were estimated to determine method Linearity. Range of the analytical procedure was determined from the concentrations of the calibration curve.
Specificity: Specificity of the method was verified by applying bands of standard lupeol, ChAS, diluent (Methanol), and a mobile phase (Toluene:
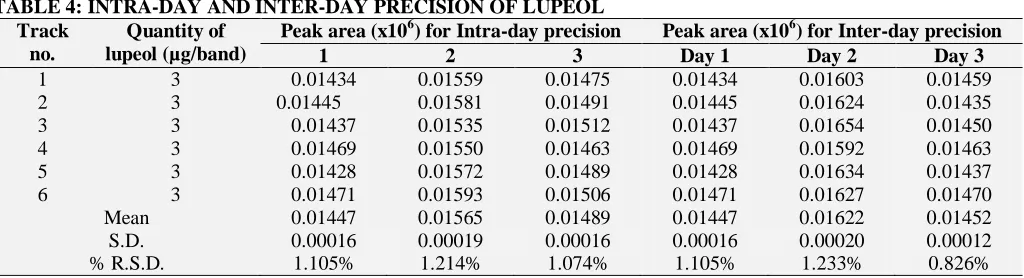
Ethyl acetate: Formic acid 7:2:1 v/v) which was developed and scanned according to optimized chromatographic conditions mentioned in Table 1. Precision: Precision was determined in terms of intra-day precision (Repeatability) and inter-day precision (Intermediate precision). Intra-day precision was determined in triplicate by applying 6 bands each of 3 µl at 100% concentration of standard lupeol (1mg/ml) with the same method on the same day but with different time intervals. Inter-day precision was performed on 3 consecutive days with the same method as described for intra-day precision.
Accuracy: Accuracy of the method was determined by spiking triplicate bands of the sample with 80%, 100% and 120% of standard lupeol. The percent recoveries and average percent recovery were calculated.
stated experimental conditions was determined based on signal to noise ratio by using the following formula
LOD = 3.3(𝛿 /S)
𝛿 is sthe tandard deviation of the response and S is sthe lope of cthe alibration curve.
Limit of Quantitation (LOQ): LOQ or the lowest amount of analyte that can be detected and quantified with acceptable accuracy, precision and variability was determined based on signal to noise ratio by using the following formula
LOQ = 10 (𝛿 /S)
𝛿 is sthe tandard deviation of the response and S is sthe lope of cthe alibration curve.
RESULTS AND DISCUSSION:
Identification of Lupeol by Developed Method: HPTLC method for detection and quantification of lupeol from extracts EtAS and ChAS was standardized for composition of mobile phase, mobile phase saturation time, and plate loading volume. Optimized mobile phase Toluene: Ethyl acetate: Formic acid (7:2:1 v/v/v) exhibited good resolution of bands as indicated by sharp and symmetrical peaks.
The Rf value of standard lupeol was found to be
0.631. Extracts EtAS and ChAS also displayed a peak at Rf 0.632 and 0.629 respectively, thus
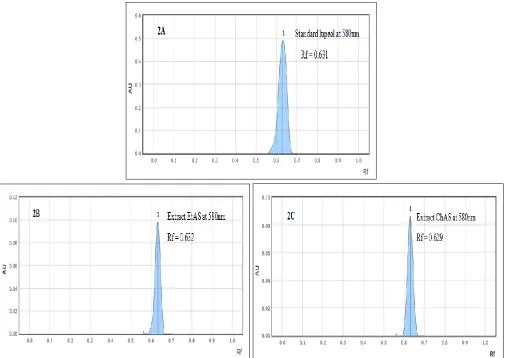
denoting the presence of lupeol. Densitogram of standard lupeol and lupeol in extracts EtAS and ChAS at 580 nm is shown in Fig. 2.
FIG. 2: DENSITOGRAM OF STANDARD LUPEOL, EXTRACT EtAS AND ChAS. Fig. 2A, 2B and 2C represent
chromatogram or densitogram of standard lupeol, extract EtAS and ChAS respectively at 580nm. The Rf values were found to be 0.631, 0.632, and 0.629 for standard lupeol, extract EtAS and ChAS, respectively.
Quantification: Amount of lupeol present in extracts EtAS and ChAS was quantified successfully with the developed HPTLC method. The amount of lupeol quantified in extracts EtAS
[image:4.612.55.560.294.652.2]TABLE 2: QUANTIFIED AMOUNT OF LUPEOL IN 10 mg EXTRACT OF EtAS AND ChAS Track
no.
Sample Volume
applied (µl)
Amount of sample (µg/band)
Rf Amount of
lupeol (ng/band)
Concentration of lupeol (µg/10mg
of extract)
Mean concentration/ 10mg of extract
1 EtAS 10 100 0.63 317.1 31.71
31.64µg
2 EtAS 10 100 0.63 318.2 31.82
3 EtAS 10 100 0.63 314.0 31.4
9 ChAS 10 100 0.63 352.6 35.22
35.26µg
10 ChAS 10 100 0.63 349.4 34.94
[image:5.612.314.564.426.573.2]11 ChAS 10 100 0.63 356.3 35.63
FIG. 3: QUANTIFICATION PLATE. It represents HPTLC
fingerprint profile used for quantification of lupeol in extracts EtAS and CHAS concerning standard lupeol used in the concentration range of 0.1, 0.2, 0.3, 0.4 and 0.5 mg/ml.
Method Validation: The proposed method was validated using extract ChAS, which exhibited significant high content of lupeol in it.
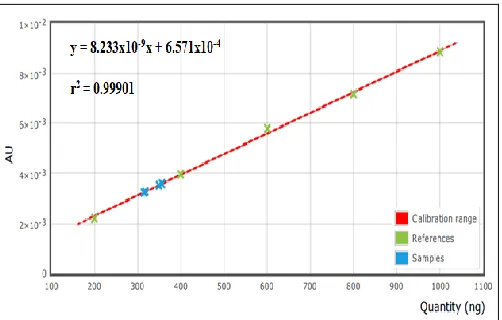
Linearity and Range: Linearity of lupeol was validated by the linear regression equation and correlation coefficient. The calibration curve was found to be linear over the concentration range of 200-1000 ng/band, and correlation coefficient (r2) was found to be 0.999018 [Refer Fig. 4, Table 3].
FIG. 4: CALIBRATION CURVE. It represents calibration
curve for quantification of lupeol in extracts EtAS and ChAS where the x-axis represents the quantity of lupeol in ng and y-axis represents area under the curve
TABLE 3: LINEARITY AND RANGE OF CALIBRATION CURVE
Parameters Result
Range of linearity 200-1000 ng/band Regression equation y = 8.233×10⁻⁹x + 6.571×10⁻⁴ Correlation coefficient (r2) 0.99901812
Coefficient of variation 1.85% (%CV/% RSD)
Specificity: Peak purity was assessed by comparing peak start, peak apex, and peak end of an extract with that of standard. The Rf of extract
[image:5.612.49.300.537.697.2]and standard lupeol was found to be 0.63. There was no other interfering peak by other phytoconstituents of extract around the retention time of lupeol. Also, mobile phase and diluent did not show any interference. Thus, the method was found to be quite specific for the determination of lupeol in ChAS [Refer Fig. 5].
FIG. 5: SPECIFICITY PLATE. It represents a TLC plate used for assessment of specificity of the proposed method. Track 1 and 2 represents standard lupeol, 3 and 4 represents extract ChAS and 5, and 6 represents diluent (methanol) and mobile phase Toluene: Ethyl acetate: Formic acid (7:2:1 v/v/v).
TABLE 4: INTRA-DAY AND INTER-DAY PRECISION OF LUPEOL Track
no.
Quantity of lupeol (µg/band)
Peak area (x106) for Intra-day precision Peak area (x106) for Inter-day precision
1 2 3 Day 1 Day 2 Day 3
1 3 0.01434 0.01559 0.01475 0.01434 0.01603 0.01459
2 3 0.01445 0.01581 0.01491 0.01445 0.01624 0.01435
3 3 0.01437 0.01535 0.01512 0.01437 0.01654 0.01450
4 3 0.01469 0.01550 0.01463 0.01469 0.01592 0.01463
5 3 0.01428 0.01572 0.01489 0.01428 0.01634 0.01437
6 3 0.01471 0.01593 0.01506 0.01471 0.01627 0.01470
Mean 0.01447 0.01565 0.01489 0.01447 0.01622 0.01452 S.D. 0.00016 0.00019 0.00016 0.00016 0.00020 0.00012
% R.S.D. 1.105% 1.214% 1.074% 1.105% 1.233% 0.826%
Accuracy: Average percent recovery was found to be 91.88% when extract ChAS was spiked with
80%, 100% and 120% of standard lupeol [Refer Table 5, Fig. 6].
TABLE 5: % RECOVERY OF LUPEOL IN EXTRACT ChAS WHEN SPIKED WITH 80%, 100% AND 120% OF STANDARD LUPEOL
Sample volume (µl) % lupeol spiked Lupeol spiked in µl Peak area (×106) % Recovery Average recovery
3 80 1.6 0.010592 96.15
91.88%
3 100 2.0 0.010985 85.53
3 120 2.4 0.012794 93.97
FIG. 6: RECOVERY/ACCURACY PLATE. It represents a
TLC plate used for determination of % recovery when extract ChAS was spiked with 80%, 100% and 120% of standard lupeol.
LOD and LOQ: The LOD and LOQ for extract ChAS were found to be 55.0 ng/band and 166.69 ng/band respectively.
CONCLUSION: A new HPTLC method was developed for the identification and quantification of lupeol in the leaves of A. scholaris. The reliability of the method was confirmed by assessing validation parameters as per ICH guidelines. The proposed HPTLC method was found to be simple, specific, sensitive, precise and accurate for identification and quantification of lupeol in the leaves of A. scholaris. Thus, the developed and validated method can be used for standardization, quality control analysis and quantification of lupeol in leaves of A. scholaris.
Also, as leaves of A. scholaris possess therapeutic potential in treatment and management of various medical conditions and they possess good content of triterpenoid, thus can be used as a potential source for isolation of one of the pharmacologically important pentacyclic triterpenoid-lupeol.
ACKNOWLEDGEMENT: The authors gratefully acknowledge ANCHROM Laboratories, Mulund, Mumbai, India for providing necessary facilities to carry out this work.
CONFLICT OF INTEREST: The authors of this research article declare no potential conflict of interest.
REFERENCES:
1. Lanfranco G: Popular Use of Medicinal Plants in the Maltese Islands. Insula 1992; 1: 34-35.
2. Veeresham C: Natural products derived from plants as a source of drugs. J Adv Pharm Technol Res 2012; 3(4): 200-01.
3. Palhares RM, Drummond MG, Brasil BDSAF, Cosenza GP, das Graças Lins Brandão M and Oliveira G: Medicinal plants recommended by the world health organization: DNA barcode identification associated with chemical analyses guarantees their quality. PLoS One 2015; 10(5): e0127866.
4. WHO (World Health Organization) The World Traditional Medicines Situation, in Traditional medicines: Global Situation, Issues and Challenges. Geneva 2011; 3: 1-14. 5. Mistry D, Parekh B and Pithawala M: Studies on
[image:6.612.58.408.268.475.2]6. Hussain A, Zaman MK and Ramteke AM: Antibacterial activity of trunk bark of Alstonia scholaris. Asian Journal of Pharmaceutical and Clinical Research 2010; 3: 46-47. 7. Channa S, Dar A, Ahmed S and Rahman AU: Evaluation
of Alstonia scholaris leaves for Broncho-vasodilatory activity. Journal of Ethnopharmacology 2005; 97: 469-76. 8. Husain A: Hepatoprotective activity of methanolic extract
of stem bark of Alstonia scholaris (L.) R. Br. American Journal of Pharm Tech Research 2012; 2(2): 545-55. 9. Ahmad S, Ahmad S, Ali A and Afzal M:
Anti-carcinogenic and anti-mutagenic activity of Alstonia scholaris on the albino mice bone marrow cells and peripheral human lymphocyte culture against methyl methane sulfonate induced genotoxicity. Adv Biomed Res 2016; 5: 92.
10. Anurakkun NJ, Bhandari MR and Kawabata J: α-Glucosidase inhibitors from Devil tree Alstonia scholaris. Food Chemistry 2007; 103: 1319-23.
11. Kulkarni MP and Juvekar AR: Effect of Alstonia scholaris (Linn.) R. Br. on stress and cognition in mice. Indian Journal of Experimental Biology 2008; 47: 47-52. 12. Sanaye MM and Zehra S: In-vitro evaluation of
anti-urolithiatic activity of leaves of Alstonia scholaris. International Journal of Current Research 2018; 10(07): 71869-74.
13. Shang JH, Cai XH, Feng T, Zhao YL, Wang JK, Zhang LY, Yan M and Luo XD: Pharmacological evaluation of A. scholaris: Anti-inflammatory and analgesic effects. Journal of Ethnopharmacology 2010; 129(2): 174-81. 14. Sheng H and Sun H: Synthesis, biology and clinical
significance of pentacyclic triterpenes: A multi-target approach to prevention and treatment of metabolic and vascular diseases. Nat. Prod. Rep 2011; 28: 543-93. 15. Ahmad S, Khan M, Akhtar R and Imran M: Isolation and
Characterization of lupeol from Tephrosia villosa Pers. Indo American Journal of Pharmaceutical Research 2016; 6(06): 5717-22.
16. Saraf A and Shinde P: HPTLC fingerprint profile, isolation and validation of marker compound lupeol in Derris heyneana (Wight and Arn) Benth. Int J Pharm Bio Sci 2016; 7(4): 714-21.
17. Wang CM, Chen HT, Wu ZY, Jhan YL, Shyu CL and Chou CH: Antibacterial and synergistic activity of pentacyclic triterpenoids isolated from Alstonia scholaris. Molecules 2016; 21(2): 139.
18. International Conference on Harmonisation of technical requirements for registration of pharmaceuticals for human use. ICH Harmonised Tripartite Guideline; Validation of analytical procedures: Text and Methodology: ICH Q2 (R1), ICH Secretariat, Geneva, Switzerland 2005.
All © 2013 are reserved by International Journal of Pharmaceutical Sciences and Research. This Journal licensed under a Creative Commons Attribution-NonCommercial-ShareAlike 3.0 Unported License.
This article can be downloaded to Android OS based mobile. Scan QR Code using Code/Bar Scanner from your mobile. (Scanners are available on Google Play store)
How to cite this article: