Optimized superpixel and AdaBoost
classifier for human thermal face
recognition
Ibrahim, A, Tharwat, A and Gaber, T
http://dx.doi.org/10.1007/s1176001712126
Title
Optimized superpixel and AdaBoost classifier for human thermal face
recognition
Authors
Ibrahim, A, Tharwat, A and Gaber, T
Type
Article
URL
This version is available at: http://usir.salford.ac.uk/id/eprint/52076/
Published Date
2018
USIR is a digital collection of the research output of the University of Salford. Where copyright
permits, full text material held in the repository is made freely available online and can be read,
downloaded and copied for noncommercial private study or research purposes. Please check the
manuscript for any further copyright restrictions.
Noname manuscript No.
(will be inserted by the editor)
Optimized SuperPixel and AdaBoost Classifier for Human
Thermal Face Recognition
Abdelhameed Ibrahim · Alaa Tharwat · Tarek Gaber · Aboul Ella Hassanien
Received: date / Accepted: date
Abstract Infrared spectrum-based human recognition systems offer straightforward and robust solutions for achieving an excellent performance in uncontrolled illu-mination. In this paper, a human thermal face recogni-tion model is proposed. The model consists of four main steps. Firstly, the grey wolf optimization algorithm is used to find optimal superpixel parameters of the quick-shift segmentation method. Then, Segmentation-based Fractal Texture Analysis algorithm is used for extract-ing features and the Rough Set-based methods are used to select the most discriminative features. Finally, the AdaBoost classifier is employed for the classification process. For evaluating our proposed approach, ther-mal images from the Terravic Facial infrared dataset were used. The experimental results showed that the proposed approach achieved (1) reasonable segmenta-tion results for the indoor and outdoor thermal images, (2) accuracy of the segmented images better than the non-segmented ones, and (3) the Entropy-Based Fea-ture Selection method obtained the best classification accuracy. Generally, the classification accuracy of the
∗Abdelhameed Ibrahim
Faculty of Engineering, Mansoura University, Egypt
∗Alaa Tharwat
Faculty of Engineering, Suez Canal University, Egypt Faculty of Computer Science and Engineering, Frankfurt University of Applied Sciences, 60318 Frankfurt am Main, Germany
∗Tarek Gaber
Faculty of Computers and Informatics, Suez Canal Univer-sity, Egypt
∗Aboul Ella Hassanien
Faculty of Computers and Information, Cairo University, Egypt
∗Scientific Research Group in Egypt, (SRGE),
http://www.egyptscience.net
proposed model reached to 99% which is better than some of the related work with around 5%.
Keywords Feature Selection (FS)· Rough Set·Grey
Wolf Optimization (GWO)·Thermal Face image
1 Introduction
Biometric characteristics of a person are crucial for iden-tification and verification. Face recognition is the most appealing modality for human identification. Unlike the fingerprint, face recognition, which is non-invasive, pas-sive and straightforward biometric solutions, has been widely used in biometric technologies such as passports utilization and driver licenses. Recently, most studies of face recognition approaches make use of visual images [1]. However, they are not accurate enough in uncon-trolled environments [2].
Different imaging modalities, including infrared (IR) imaging sensor could be used to implement face recog-nition models [2]. The main idea of thermal imaging is that according to an object’s temperature and char-acteristics, each object emits infrared energy different than other objects. Thus, each object has a different thermal signature. This signature is primarily derived from the pattern of the superficial blood vessels existed under the facial skin. The thermal image is unique for each person since the vein and tissue structure of each face are unique [3].
2 Abdelhameed Ibrahim et al.
obtained results were 94.11% and 92.15%, respectively,
using the Terravic Facial IR Dataset. Also, Seal et al.
proposed an approach used Discrete Wavelet Trans-form (DWT) for feature extraction and dimensional-ity reduction [5]. The experiments using their private database showed that the recognition rate was 95%. However, using Terravic Facial IR dataset achieved a
recognition rate of 93%. Gaber et al. proposed a
hu-man thermal face recognition model which used the Segmentation-based Fractal Texture Analysis (SFTA) algorithm to extract texture features and then the Ran-dom Linear Oracle ensembles to identify the human face after applying two different dimensionality reduc-tion techniques, namely, Linear Discriminant Analy-sis (LDA) [6] and PCA [7]. The experimental results proved that LDA-based approach was more efficient than PCA-based one and the best accuracy rate achieved was 94.12% using the Terravic Facial IR dataset [8].
Computational cost is one of the important factors in the success of any face recognition system. A su-perpixels method with optimizing its parameter using an optimization technique, such as Gray Wolf Opti-mization (GWO) algorithm, should promote the com-putational cost as it minimizes an enormous number of pixels. Superpixels can be generated by many methods such as quick-shift [9], which can be controlled by the
parameters of Ratio,Kernel Size andDistance.
In this paper, a human thermal face recognition model is proposed. This model consists of four main steps. Firstly, the GWO algorithm was employed for finding the optimal superpixelization parameters of the quick-shift segmentation method used for extracting su-perpixels of the thermal face. Secondly, the SFTA al-gorithm was used for extracting face features. Thirdly, Rough Set-based methods were utilized to select the most discriminative features. Fourthly, the AdaBoost classifier was employed to match the features of the training patterns and the unknown pattern. Terravic Facial IR dataset thermal images were used to evaluate the proposed approach.
The next sections are presented as follow: Section 2 gives the theoretical background. Section 3 presents the proposed thermal face recognition model. Section 4 shows the experimental results. Finally, Section 5 shows the conclusions and discussion.
2 Preliminaries
2.1 Quick-Shift Method
The method of quick-shift is used for extracting su-perpixels from a thermal face image [10]. The charac-teristics of superpixels depend on the ratio, kernel size
and maximum distance parameters. The ratio indicates the trade-off between spatial and intensity consistency, whereas the kernel size controls the scale to estimate the density. The last parameter represents the maximum distance between pixels. The quick-shift’s parameters should be optimized to produce useful face extraction from thermal images. Hand segmentation of a few im-ages can help to find the parameters’ values that show a good segmentation result [9].
2.2 Grey Wolf Optimization
Grey Wolf Optimization (GWO) algorithm simulates the movements of the wolves when they search for food and avoiding their enemies. The grey wolves live in packs or groups. Each pack contains four different cat-egories [11]. The alpha (α) or leaders are responsible
for making decisions in the pack. The beta wolves (β)
help the alpha wolves in decision making or any other activities in the pack. They are the best candidates to be the next alpha wolves. the delta wolves (δ) have to
submit toαandβ wolves. Theomega wolves (ω) have
to submit to the other dominant wolves [11, 12]. Mathematically, in GWO algorithm, the fittest so-lution is known as alpha (α). Beta (β) and delta (δ) are the second and third best solutions, respectively. The
other solutions are supposed to be omega (ω). During
the hunting process, grey wolves encircle the prey and theα,βandδwolves guide other wolves, whileωwolves follow the three candidates as denoted in Equation (1).
− →
G(t+ 1) =−→Gp(t)−
− →
A .−→D , −→D =|→−C .−→Gp(t)−
− →
G(t)| (1)
where t is the current iteration, −→A, −→C are coefficient vectors, −→Gp is the position of prey and
− →
G is the
po-sition of grey wolf. The vector −→A is defined as, −→A = 2−→a .−→r1− −→a and
− →
C vector is given by,−→C = 2−→r2, where
the components of −→a are decreasing linearly from 2
to 0 over the course of iterations, and r1, r2 are
vec-tors with random values in [0,1]. Hence, −→a is the up-dating or control parameter of the GWO algorithm that controls the trade-off between exploration and ex-ploitation [11]. The values ofais calculated as follows,
−
→a = 2−t.(2/M ax
iter), whereM axiteris the maximum iteration number allowed for the optimization. The best
solutions, α, β and δ, guide the other search agents
(including ω) to change their positions as denoted in
Equations (2, 3 and 4).
−→
Di=|
− →
C .−G→i−
− →
G|, i=α, βandδ (2)
−→
G0i=|−G→i−
− →
A .−D→i|, i=α, βandδ (3)
− →
2.3 Segmentation-based Fractal Texture Analysis (SFTA)
SFTA is one of the methods that are used to extract features from grayscale images. SFTA consists of two steps. First, an input grayscale image,I, is decomposed or divided into a set of binary images using multi-level threshold algorithm, such as Two-Threshold Binary De-composition method. Second, three features; namely, fractal dimension, mean, and size are extracted from each binary image region’s boundary [13].
In the first step, the input grayscale image (I) is de-composed into a set of binary images (Ibi, i= 1,2, . . . , nt),
where nt represents the total number of thresholds or
levels. The threshold values are computed using Otsu’s algorithm (more details about Otsu’s algorithm are in [14]). The input image is then decomposed into a set of
binary images (Ib) by applying two threshold
segmen-tation method. The goal of the second step is to extract features from the region’s boundary of the binary im-ages that are calculated in the first step. The SFTA feature vector contains the fractal dimension that rep-resents the complexity of the object’s boundary, mean and size, which are computed from the region’s bound-ary of each binbound-ary image. Hence, the length of the SFTA feature vector proportional with the value of the thresh-old parameter, which is a user-defined parameter [13].
2.4 Rough Set
In data analysis, rough set method is used for
calculat-ing the dependencies between features. Let P, Q ⊆A,
andPdepends totally on, i.e.,Q(Q⇒P). This means
that the features fromP are determined by by the
fea-tures fromQ. The degree of dependencyk(0≤k≤1) is given byk=γ(Q) =|P OSP(Q)|
|U| , where|U|denoted the
cardinality of the universe U which consists of a
non-empty finite set of objects,P OSP(Q) =Sx∈U/QP Xis
the positive region of the relation U/Qwith respect to
P,P X={x∈U|[x]P ⊆X}is the lower approximation
whereX ⊆U andk=γ(Q) represents the dependency
between condition features and decision feature. The
value ofkis (1) one whenP depends totally onQ, (2)
zero whenP does not depend onQand (3) 0≤k≤1
whenPdepends partially onQ. The quality of
approx-imation of classification is measured by the degree of dependency [15].
In rough set methods, the main goal is to find the minimal subset of features (R), i.e., reduct, that achieved classification performance approximately the same as the original features (C). This can be achieved by find-ing a reduct that achieves the smallest cardinality [15].
3 Proposed Thermal Face Recognition Model
3.1 Segmentation Phase
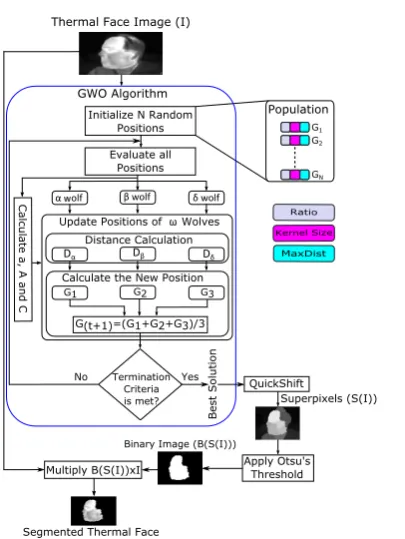
In this phase, a modified version of our method [9] was used to extract a human face from its thermal im-age. In this version, the segmentation method is based on the superpixels (quick-shift) and the GWO algo-rithm. Firstly, the model selects a thermal face image
Ii for the ith input image from total number of
im-agesN in a group fori= 1,2,3, ..., N. The GWO algo-rithm is then used to search for best solutions, i.e., best
values for quick-shift parameters (Ratio, KernalSize
and M axDist). The Quick-Shift method is then ap-plied with its automatically predetermined parameters to produce the superpixels. The superpixels image is then thresholded using the Otsu’s method, where each superpixels image based on the optimum threshold is converted to a binary imageIb. Finally, we extract the pixel values from the relevant original thermal image. Based on GWO and the superpixels with automatic thresholding, the best results can be achieved by ex-tracting faces from thermal images. Figure 1 shows the steps of the segmentation phase. More details about this phase are given below.
3.1.1 Representation of position
The positions of all grey wolves’ were initialized ran-domly, where the position of each wolf represents the values of the parameters of the quick-shift method and the positions are changed iteratively until it reaches near the optimal solution. The lower boundaries of the
Ratio,KernalSizeandM axDistparameters were 0.2, 2 and 4 respectively, while the upper boundaries were 0.8, 12 and 20, respectively. The Otsu’s thresholding method is then used to find the optimal threshold. This
threshold is used to generate a binary image Ib from
the superpixels image. Finally, the relevant pixel val-ues, from the original thermal image, are extracted or segmented (ISeg) by multiplying the original image by the binary image. After evaluating all grey wolves’ po-sitions, the first, second and third best positions are as-signed toα,β andδwolves, respectively. The other po-sitions are assigned toωwolves. Theα,β andδwolves guide the other wolves as in Equations (2, 3 and 4). The positions of wolves are changed iteratively until the stopping criteria are met.
3.1.2 Fitness function
4 Abdelhameed Ibrahim et al.
maximum similarity, and ISeg =B(S(I))×I is a seg-mented image withS(I) as the superpixel generation of
an imageI and B as the binary image generated from
the superpixel image. The similarity is equal to the ra-tio between the number of similar pixels to the total number of pixels using the generated images based on the populationG1, G2, ..., GN.
3.2 Feature Extraction Phase
SFTA was utilized in this phase for extracting features from all images, i.e., training and testing images. In the training phase, the features were represented by a feature matrix, while in the testing phase; they are rep-resented as a vector.
3.3 Feature Selection Phase
In this phase, a set of features were selected using rough set-based methods which increase the classification ac-curacy and reduce the classification time. To achieve this aim, the training data are used as an input to rough set-based methods to find the minimal feature subset. In our proposed model, three different rough set-based methods are employed for feature selection: (1) Quick Reduct Feature Selection (QRFS) [15], Dis-cernibility Matrix-based Feature Selection (DMFS) [15] and Entropy-Based Feature Selection (EBFS) [15].
3.4 Classification Phase
The AdaBoost classifier was employed for classifica-tion in this phase. The aim of AdaBoost classifier is to combine the outputs of a number of simple classi-fiers or weak learners such as decision trees and Neural Networks. AdaBoost has two main parameters: (1) the
number of iterations (T) and (2) the weights of the
training patterns (w) that are initialized to be equal. In AdaBoost, the simple classifiers are used to train the model using the training patterns, this is called training step. In this step, the parameters of AdaBoost are first initialized. For each iteration (t) some of the training patterns are selected based on the weights,wt, of these patterns to form a distribution (Dt). The se-lected patterns are then used to train the current simple classifier (Ct). The error rate t of Ct is then calcu-lated as follows, t = PNj=1wtjljt, where N represents the total number of training patterns, ljt = 1 if Ct is misclassified xj; otherwise, ltj = 0, xj is the jth pat-tern. If t ≥0.5, the weights are reinitialized again to be equal. The weight of the current weak learner (αt) is
Initialize N Random Positions
Evaluate all Positions
α olf β wolf δ wolf
Calcul
ate a, A a
nd C
Distance Calculation
Dα Dβ Dδ
Calculate the New Position
G1 G2 G3
G(t+1)=(G1+G2+G3)/3 Update Positions of Wolves
Termination Criteria is met?
Yes No
Best Soluti
on
Population
G1
G2
GN
Thermal Face Image (I)
QuickShift
Apply Otsu's Threshold
Superpixels (S(I))
Binary Image (B(S(I)))
Multiply B(S(I))xI
Segmented Thermal Face GWO Algorithm
Ratio
Kernel Size
[image:5.595.321.524.81.351.2]MaxDist
Fig. 1: Block diagram of the proposed segmentation method.
then calculated as follows,αt=t/(1−t). The weights of the training patterns are then updated to be used in the next iteration. In the testing step, to classify an unknown pattern,xtest, the outputs of all weak learn-ers are aggregated using the weighted voting method to estimate the final decision [16].
In this phase, the selected features of the training samples were used to train the AdaBoost classifier. The class of an unknown image was determined using the weak learners that were trained in the training step. The weighted voting method is then used to calculate the weight of each class, and assign the class with the maximum weight to the unknown image.
4 Experimental Results and Discussion
4.1 Experimental Setup
To evaluate proposed model, the Terravic Facial In-fraRed (IR) dataset [17] was used. The dataset
con-tains 20 classes with grayscale images (360×240) and
4.2 Experimental Scenarios
In this section, five experiments were conducted to test the proposed model. More details of each scenario are presented in the next sections.
4.2.1 Segmentation Experiment
In this experiment, the proposed segmentation method was evaluated against indoor and outdoor thermal im-ages. In the GWO algorithm, the number of search
agents, n, was ten and the maximum number of
itera-tions,t, was 20. Figure 2 shows the results for the eighth class. As shown, the proposed segmentation method achieves reasonable results because the difference be-tween the face area and the other objects, e.g. clothes, glass and other surroundings, is evident. This experi-ment showed the robustness of the proposed segexperi-menta- segmenta-tion method for the indoor and outdoor thermal images.
4.2.2 Thermal face recognition using segmented/non-segmented images
The aim of this experiment is to evaluate our proposed model using segmented and non-segmented images. In this experiment, different values of the threshold
pa-rameter, nt, were used and the size of the AdaBoost
classifier was three. Moreover, only ten images from each class were used to train the model while the rest of the images were used to test the model. This is because increasing the number of training images increased the computational and classification time. For example, if we increased the number of training images to 190 im-ages for each class; then the number of features will be
190×200×10 = 380000 features when only ten
fea-tures will be extracted from each image compared with only 20000 features when ten images were used. Thus, more classification time will be required which is not suitable for real-time applications. Table 1 summarizes the results of this experiment.
(a) (b)
[image:6.595.303.530.122.222.2](c) (d)
[image:6.595.100.222.610.717.2]Fig. 2: Sample of a thermal image ((a) indoor and (c) outdoor) and their extracted/segmented face (right).
Table 1: Accuracy (Acc.) and CPU time of the proposed model using segmented and non-segmented images.
Threshold Parameter (nt)
Without Segmentation With Segmentation
Acc. (%) CPU Time
(secs) Acc. (%)
CPU Time (secs)
1 78.33 6.23 85.56 6.78
2 78.33 15.02 88.33 13.90
3 78.89 25.57 88.11 23.44
4 79.17 33.16 89.22 32.93
5 75.83 35.41 89.22 39.89
6 83.06 45.78 93.89 50.59
7 81.11 60.92 93.28 58.87
8 77.22 64.31 93.33 71.62
9 80.83 78.88 92.72 84.94
10 82.22 93.45 92.72 90.54
As shown in Table 1, the accuracy was increased when the value of threshold parameter was increased until it reached to a value (approximately 93%), after that value, the accuracy does not improve anymore. On the other hand, the CPU time was increased without achieving noticeable progress in the accuracy. Secondly, the proposed model achieved better accuracy results using the segmented images than using non-segmented images. In addition, the best accuracy was obtained when the value of the threshold parameter was equal
to or more than six. Thirdly, the CPU time was
pro-portional to the value of threshold parameter.
To conclude, the segmented images achieved accu-racy better than the non-segmented ones, and the best
accuracy was obtained whennt≥6.
4.2.3 Feature selection experiment
Due to a high accuracy of the proposed model using segmented images over non-segmented images, in this experiment, the segmented images were used. The aim of this experiment was to test whether applying rough set reduction method could improve both of the identi-fication accuracy and system performance. To achieve this aim, in this experiment, three well-known rough set methods (QRFS, DMFS and EBFS) were used to reduce the number of features.
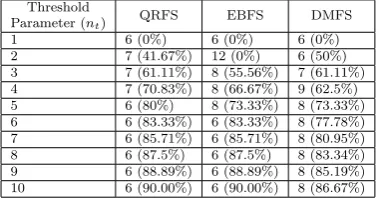
Table 2: The number of selected features and reduction rate (# features (reduction rate)) of QRFS, EBFS and DMFS methods.
Threshold
Parameter (nt) QRFS EBFS DMFS
1 6 (0%) 6 (0%) 6 (0%)
2 7 (41.67%) 12 (0%) 6 (50%)
3 7 (61.11%) 8 (55.56%) 7 (61.11%)
4 7 (70.83%) 8 (66.67%) 9 (62.5%)
5 6 (80%) 8 (73.33%) 8 (73.33%)
6 6 (83.33%) 6 (83.33%) 8 (77.78%)
7 6 (85.71%) 6 (85.71%) 8 (80.95%)
8 6 (87.5%) 6 (87.5%) 8 (83.34%)
9 6 (88.89%) 6 (88.89%) 8 (85.19%)
[image:6.595.322.512.654.753.2]6 Abdelhameed Ibrahim et al.
Table 2 summarizes the results of this experiment and Fig. 3 shows the CPU time of the three feature se-lection methods. Moreover, a comparison between the accuracy obtained using the original feature (with no reduction) and the features that were selected using QRFS, DMFS and EBFS methods is depicted in Fig. 4. A similar comparison was conducted for the required CUP time in the same cases and it is given in Fig. 5. From these two figures, it can be remarked that EBFS-based feature reduction method is the best in terms of the accuracy and CPU time. Moreover, Table 2 shows that the three methods achieved high reduction rate while achieving high accuracy rate too. Moreover, the reduction rates were proportional to the number of
fea-tures. For example, whennt= 1 the number of features
was six and the reduction rate was 0%. On the contrary,
when nt = 10 the number of features was 60 and the
reduction rate ranged from 86.67% to 90%.
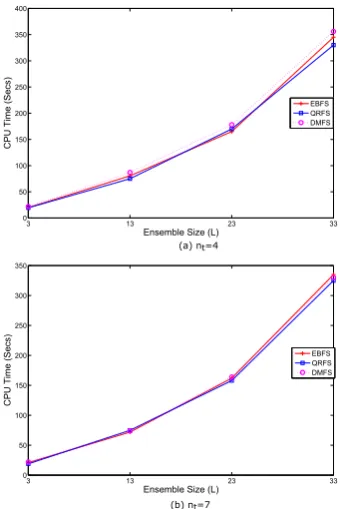
As shown in Fig. 3, the CPU time of the two feature selection methods (QRFS and EBFS) was much lower than DMFS method since the DMFS method complex-ity isO((N+logM)M2), whereNindicates the number
of features andM is the number of samples. Therefore,
the time required for calculating the discernibility ma-trix was increasing exponentially with increasing num-ber of patterns in the dataset. On the contrary, the com-plexity of EBFS and QRFS areO(N M2) +O(M3) and
O(M N2), respectively [15]. Hence, the required
[image:7.595.331.499.273.387.2]com-putational time for both QRFS and EBFS methods is lower than DMFS.
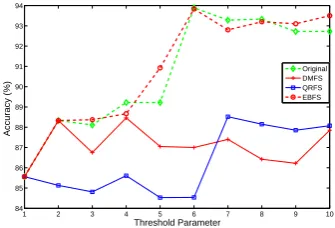
Figure 4 shows that the rough set-based feature selection methods achieved accuracy relatively equal to the accuracy of the original features. Additionally, EBFS obtained the best accuracy. Regarding the com-putational time, Fig. 5 shows a significant difference between the classification time of the selected and orig-inal features. This is because the number of the selected features was much smaller than the number of original features.
To conclude, rough set-based feature selection meth-ods removed irrelevant features; hence, reduced the clas-sification time than the original features. Moreover, in EBFS method, the selected features obtained accuracy relatively equal to the accuracy of the original features.
4.2.4 Ensemble Size experiment
The aim of this experiment was to test whether the size of the AdaBoost classifier could affect the accuracy of the classification and (2) the required CPU time. In this experiment, the proposed model was evaluated us-ing four different sizes of the AdaBoost classifier (L= 3,
L= 13,L= 23 and L= 33). The selected features
us-1 2 3 4 5 6 7 8 9 10
0 100 200 300 400 500 600 700 800
Threshold Parameter
CPU Time (secs)
DMFS QRFS EBFS
Fig. 3: CPU time of the three rough set-based feature selection methods, i.e., QRFS, EBFS and DMFS.
1 2 3 4 5 6 7 8 9 10
84 85 86 87 88 89 90 91 92 93 94
Threshold Parameter
Accuracy (%)
Original DMFS QRFS EBFS
Fig. 4: Accuracy of the proposed model using the orig-inal and selected features.
1 2 3 4 5 6 7 8 9 10
0 50 100 150 200 250 300
Threshold Parameter
CPU Time (secs)
DMFS QRFS EBFS Original
Fig. 5: A comparison between QRFS, EBFS, DMFS and the original features in terms of classification time.
ing the rough set-based methods were used to train Ad-aBoost classifier. In addition, different values of
thresh-old parameters were used (nt = 4 and nt = 7). The
[image:7.595.327.499.446.566.2]3 13 23 33 86
88 90 92 94 96 98 100
Ensemble Size (L)
Accuracy
(%)
EBFS QRFS DMFS
3 13 23 33
84 86 88 90 92 94 96 98
Ensemble Size (L)
Accuracy (%)
EBFS QRFS DMFS
(a) nt=4
[image:8.595.296.527.75.361.2](b) nt=7
Fig. 6: A comparison between QRFS, EBFS and DMFS methods in terms of classification accuracy using
dif-ferent ensemble sizes (L) and two different threshold
values.
3 13 23 33
0 50 100 150 200 250 300 350
Ensemble Size (L)
CPU
Time
(Secs) EBFS
QRFS DMFS
3 13 23 33
0 50 100 150 200 250 300 350 400
Ensemble Size (L)
CPU
Time
(Secs) EBFS
QRFS DMFS
(a) nt=4
(b) nt=7
Fig. 7: A comparison between QRFS, EBFS and DMFS methods in terms of classification time using different ensemble sizes (L) and two different threshold values.
the overfitting problem and more complex model. Sec-ondly, the CPU time also increased when the ensemble size increased too. This is because increasing the
num-6 7 8 9 10
0 200 400 600 800 1000 1200 1400 1600 1800 2000
Threshold Parameter
CPU Time (secs) N=10
N=15 N=20 N=25
6 7 8 9 10
96 96.5 97 97.5 98 98.5 99 99.5 100
Threshold Parameter
Accuracy (%)
N=10 N=15 N=20 N=25
(a)
[image:8.595.54.252.82.341.2](b)
Fig. 8: Accuracy and CPU time of the proposed model using different number of training images.
ber of weak learners led to an increase in the CPU time that is required to train the AdaBoost model.
4.2.5 Different numbers of training images
The aim of this experiment is to evaluate the influ-ence of the number of training images on the proposed model. The number of training images was ranged from 10 to 25, the range of values of threshold parameter was from six to ten, the number of weak learners was 13 and the features that were selected using EBFS method were used. The results obtained from this experiment are presented in Fig. 8.
As shown in Fig. 8(a), it can be remarked that the accuracy was proportional to the number of training images. This is because a small number of training sam-ples makes the model more sensitive to small variations in training samples, i.e., high variance. From the results in Fig. 8(b), it is apparent that increasing the number of training images increased the CPU time.
[image:8.595.74.245.412.667.2]8 Abdelhameed Ibrahim et al.
which extracts discriminative features, (3) using the rough set-based feature selection methods which re-move the irrelevant features and improve the classifi-cation accuracy and (4) using the AdaBoost classifier which increases the weight of critical samples and hence improves the classification performance.
5 Conclusions and Future Work
This paper proposed a face recognition model using thermal face images. The model has four phases: (1) face segmentation using both of Quick-shift and GWO method, (2) features extraction using SFTA method, (3) feature selection using different Rough set-based methods, i.e., QRFS, DMFS and EBFS, and (4) clas-sification/identification using the AdaBoost classifier. Many experiments were conducted to evaluate the pro-posed model (i) using segmented and non-segmented images; (ii) using the original and the selected features; (iii) using different sizes of the AdaBoost ensemble; (iv) using different numbers of training images. Experi-mental results proved a competitive performance of the proposed model using the segmented images used our proposed segmentation method. Using the segmented images, the accuracy was ranged from 85% to 92% while the results of the non-segmented images were ranged from 78% to 82%. This reflects how the seg-mentation phase is important for our model. Moreover, EBFS method reduced the number of features (with 90% reduction rate) and achieved accuracy better than the original features, and hence it reduces the classifi-cation time. Additionally, the EBFS method obtained results better than QRFS and DMFS. Also, our exper-iments proved that the performance of the proposed model proportional with the number of training images and the size of the AdaBoost ensemble. However, in-creasing the size of AdaBoost increases the complexity of the model and may lead to an overfitting problem. The best accuracy achieved was about 99% when the segmented images were used, the threshold parameter was 7, 25 images were used to train the model and 23 weak learners were used in the AdaBoost classifier.
Several directions for future studies can be suggested. First, for higher dimensional datasets, to speed up the computation, parallel algorithms can be employed. Sec-ond, try other optimization methods to explore the effectiveness of the proposed model for detecting ob-ject(s) in different thermal datasets such as Terravic Weapon IR dataset and Terravic Motion IR dataset.
References
1. Tharwat, A., Ghanem, A.M., Hassanien, A.E.: Three
different classifiers for facial age estimation based on
k-nearest neighbor. In: 9th International Conference on
Computer Engineering (ICENCO), IEEE (2013) 55–60
2. Ding, C., Tao, D.: A comprehensive survey on
pose-invariant face recognition. ACM Transactions on
Intelli-gent Systems and Technology (TIST)7(3) (2016) 37
3. Zaeri, N., Baker, F., Dib, R.: Thermal face recognition using moments invariants. International Journal of Signal
Processing Systems3(2) (2015) 94–99
4. Debotosh Bhattacharjee, Ayan Seal, S.G.M.N., Basu, D.K.: Comparative study of human thermal face recog-nition based on haar wavelet transform and local binary
pattern. Computational Intelligence and Neuroscience
2012(6) (2012)
5. Seal, A., Ganguly, S., Bhattacharjee, D., Nasipuri, M., Basu, D.K.: Thermal human face recognition based on haar wavelet transform and series matching technique. In: Multimedia Processing, Communication and Com-puting Applications. Springer (2013) 155–167
6. Tharwat, A., Gaber, T., Ibrahim, A., Hassanien, A.E.:
Linear discriminant analysis: A detailed tutorial. AI
Communications (Preprint) (2017) 1–22
7. Tharwat, A.: Principal component analysis-a tutorial.
In-ternational Journal of Applied Pattern Recognition3(3)
(2016) 197–240
8. Gaber, T., Tharwat, A., Ibrahim, A., Sn´ael, V.,
Has-sanien, A.E.: Human thermal face recognition based on random linear oracle (rlo) ensembles. In: Proceedings of the International Conference on Intelligent Networking and Collaborative Systems (INCOS). (2015) 91–98 9. Ibrahim, A., Gaber, T., Horiuchi, T., Snasel, V.,
Has-sanien, A.E.: Human thermal face extraction based on superpixel technique. In: Proceedings of the 1st Inter-national Conference on Advanced Intelligent System and Informatics (AISI2015, Springer (2016) 163–172
10. Vedaldi, A., Soatto, S.: Quick shift and kernel
meth-ods for mode seeking. In: Computer vision–ECCV 2008. Springer (2008) 705–718
11. Mirjalili, S., Mirjalili, S.M., Lewis, A.: Grey wolf
opti-mizer. Advances in Engineering Soft.69(2014) 46–61
12. Tharwat, A., Elnaghi, B.E., Hassanien, A.E.:
Meta-heuristic algorithm inspired by grey wolves for solving function optimization problems. In: International Con-ference on Advanced Intelligent Systems and Informatics, Springer (2016) 480–490
13. Costa, A.F., Humpire-Mamani, G., Traina, A.J.M.: An
efficient algorithm for fractal analysis of textures. In:
Proceedings of 25thSIBGRAPI Conference on Graphics,
Patterns and Images (SIBGRAPI), IEEE (2012) 39–46
14. Sezgin, M., Sankur, B.: Survey over image
threshold-ing techniques and quantitative performance evaluation.
Journal of Electronic imaging13(1) (2004) 146–168
15. Chen, Y., Zhu, Q., Xu, H.: Finding rough set reducts with fish swarm algorithm. Knowledge-Based Systems
81(2015) 22–29
16. Gaber, T., Tharwat, A., Hassanien, A.E., Snasel, V.: Bio-metric cattle identification approach based on weber’s lo-cal descriptor and adaboost classifier. Computers and
Electronics in Agriculture122(2016) 55–66