Background ducking to produce
esthetically pleasing audio for TV with
clear speech
Torcoli, M, FrekeMorin, A, Paulus, J, Simon, C and Shirley, BG
Title
Background ducking to produce esthetically pleasing audio for TV with
clear speech
Authors
Torcoli, M, FrekeMorin, A, Paulus, J, Simon, C and Shirley, BG
Type
Conference or Workshop Item
URL
This version is available at: http://usir.salford.ac.uk/id/eprint/50647/
Published Date
2019
USIR is a digital collection of the research output of the University of Salford. Where copyright
permits, full text material held in the repository is made freely available online and can be read,
downloaded and copied for noncommercial private study or research purposes. Please check the
manuscript for any further copyright restrictions.
Audio
Engineering
Society
Convention
Paper
10175
Presented
at
the
146
thConvention
2019
March
20
–
23,
Dublin,
Ireland
Thispaperwaspeer-reviewedasacompletemanuscriptforpresentationatthisconvention.ThispaperisavailableintheAES E-Library(http://www.aes.org/e-lib)allrightsreserved. Reproductionofthispaper,oranyportionthereof,isnotpermitted withoutdirectpermissionfromtheJournaloftheAudioEngineeringSociety.
Background Ducking to Produce Esthetically Pleasing
Audio for TV with Clear Speech
Matteo Torcoli1, Alex Freke-Morin1,2, Jouni Paulus1,3, Christian Simon1, and Ben Shirley2
1Fraunhofer Institute for Integrated Circuits IIS, Erlangen, Germany 2Acoustics Research Centre, University of Salford, UK
3International Audio Laboratories Erlangen, a joint institution of Universität Erlangen-Nürnberg and Fraunhofer IIS
Correspondence should be addressed to Matteo Torcoli ([email protected]) ABSTRACT
In audio production, background ducking facilitates speech intelligibility, while keeping the background track enjoyable. Technical details for recommendable ducking practices are not currently documented in literature. Hence, we first analyze common practices found in TV documentaries. Second, a subjective test investigates the preferences of 22 normal-hearing listeners on the Loudness Difference (LD) between commentary and background during ducking. Highly personal preferences are observed, highlighting the importance of object-based personalization. Statistically significant difference is found between non-expert and expert listeners. On average, non-experts prefer LDs that are 4 LU higher than the ones preferred by experts. Based on the test results, we recommend at least 10 LU difference between commentary and music and at least 15 LU between commentary and ambience.
1
Introduction
One of the most common complaints to broadcasters is about the low intelligibility of the foreground speech (e.g. dialog and commentary) in TV programs due to the background (sometimes also referred to asbed) being too loud compared to the speech [1]. The back-ground includes music and effects that are essential for the full understanding and enjoyment of the show. How-ever, the background can energetically mask the speech, making it impossible or tiring to understand. In some cases, the background also includes background speech, e.g. Voice-over-Voice (VoV), where a foreground voice translates a foreign language in the background. In this case informational masking can also occur [2].
Audio producers are challenged with the task of produc-ing audio mixes with enjoyable background and fully
intelligible foreground speech, at least under favorable listening conditions. In order to do so, it is common practice to attenuate the level of the background during periods of activity of the foreground speech.
This can be executed in different ways, which are all referred to asduckingin this paper. The most common ways are manual volume automation in a digital au-dio workstation and the side-chain compression of the background triggered by the foreground speech signal1. A combination of manual and side-chain control can also be used. In every case, a number of parameters are involved that need to be tuned.
1The technique based on the side-chain compression is what many
audio engineers refer to asducking. This paper uses the termducking
with a broader meaning, referring to any time-varying background attenuation with the aim of making the foreground speech clear.
Torcoli et al. Ducking for TV with Clear Speech
Loudne
ss [LU]
Time
Hold Shift
Speech
Background Loudness
Difference (LD)
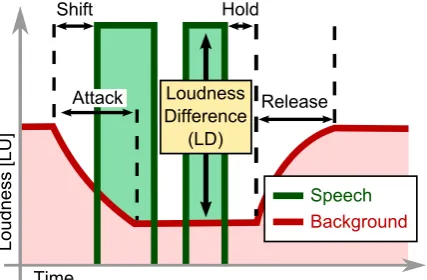
[image:3.595.73.287.125.265.2]Release Attack
Fig. 1:Ducking the background while foreground speech is active. This is controlled by parame-ters such as the Loudness Difference (LD) be-tween speech and background during ducking and time constants (attack, shift, hold, release).
These parameters are shown in Fig. 1 and can be cate-gorized into 2 groups: time constants and level param-eters. The time constants can be described by typical compressor parameters such as attack and release, com-plemented by a shift time, which describes the attack offset before speech is starting, and a hold time, which preventspumpingin short speech gaps. The main rel-ative level parameter is the Loudness Difference (LD) between foreground speech and background.
As loudness measure we adopt the integrated loudness as per ITU BS.1770-4 [3], i.e. as per EBU R 128 [4]. This is measured in Loudness Units Full Scale (LUFS) if relative to digital full scale or in Loudness Units (LU) if related to another specified level, e.g. in the case of the LD. A handy property of the LU is that a level increase by 1 dB leads to a 1 LU increase.
Best practices for an esthetically well tuned ducking are not defined by mixing handbooks and broadcaster rec-ommendations. Often the only recommendation given is that foreground speech has to be “comprehensible” and “clear”.
This paper sheds some light on the ducking parameters by studying the LD. This is done by analyzing the practices found in a sample of TV documentaries and by carrying out a subjective test on the LDs preferred by normal-hearing listeners. Related works are also reviewed and compared with our findings.
2
Literature Review
2.1 The perfect TV audio mix is personal
The right balance between foreground speech and back-ground was shown to depend on personal taste [5, 6], listener’s hearing acuity [7, 8, 9, 10], listening envi-ronment (e.g. envienvi-ronmental noise [11]), reproduction system (e.g. [12]), and listener’s mother tongue and content language [13].
Object-based audio systems such as MPEG-H Audio solve this problem by enabling the audience to per-sonalize the relative level of the foreground speech [14, 15, 16]. This service, known as Dialogue Enhance-ment, clearly increases the quality of experience for the final users [6, 17].
2.2 Desirable LD for the Default Mix
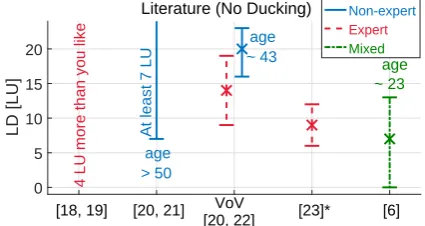
Even if object-based personalization is available, a de-fault mix is needed. This should satisfy as many lis-teners as possible. Some works in literature investigate the LD, even if considering a constant level of the back-ground and not in the context of ducking. These works are reviewed in the following and their main results are visually summarized in Fig. 2. If not specified other-wise, stereo signals are considered, with voice panned to the phantom center, quiet listening conditions, and high-end playback systems.
In guidelines by the BBC [18, 19], general suggestions such as the following are given: “Be aware of back-ground noise";“Take the music down. Our research showed that bringing music down slightly in the mix al-lowed people across the demographic to hear dialogue, including those with certain hearing loss. Once you’re happy with your mix, try taking the music down 4dB (one point on the PPM) and see if this impacts on your creative vision. The chances are it won’t!”.
A set of guidelines focused on speech intelligibility published by the German public broadcasters [20] sug-gest that the LD should be at least 7 LU and between 16 and 23 LU for VoV. These recommendations are based on the studies in [21] and [22]. In [21] a listen-ing test is carried out where people can rate test items mixed with LD = 2, 7, 10 LU by means of a question-naire. While listeners under the age of 50 do not show a clearly preferred condition, listeners over 50 prefer at least 7 LU for a comfortable listening experience.
AES 146thConvention, Dublin, Ireland, 2019 March 20 – 23
[18, 19] [20, 21] [23]* [6]
0 5 10 15 20
LD [LU]
4 LU more than you like
At least 7 LU
age > 50
age
~ 43 age
~ 23 Literature (No Ducking)
[image:4.595.74.287.127.240.2]VoV [20, 22]
Non-expert Expert
Mixed
Fig. 2:Overview on literature about desirable LD in TV audio mixes. No work takes into considera-tion ducking, but LD is studied as a static level difference. A modified loudness measurement is used in [23] and it is unknown to what extent it is comparable with the other values.
In [22], the focus is on VoV excerpts. These are mixed by audio engineers with LDs in the range 9-19 LU. Then, non-expert listeners between 23 and 58 years old (mean age 43) are asked to adjust the LD and to set it to their preferred level by means of a slider, starting from the LD set by the audio engineers. The results show two different groups of listeners. One group favor LDs similar to initial ones (average 14 LU), while a second group clearly prefers higher LDs (average 20 LU). Different listening conditions were also tested, e.g. with/without video, which do not led to any significant difference in the results. Hence, a LD between 16 and 23 LU is suggested to meet the preference of the most critical group.
In research by NHK [23] the balance between fore-ground speech and backfore-ground is investigated using a variation of the ITU BS.1770 loudness, which adopts smaller time constants. It is unknown to what extent this is comparable to the other loudness values. For documentary programs, the LD chosen by 12 mixing engineers is of 9±3 LU. Also a few samples of musi-cal shows and sport programs are considered. In these cases, LDs close to zero or even negative LDs are cho-sen by the same mixing engineers.
In [6], expert and non-expert listeners between 20 and 32 years old (median age 23) can set their preferred LD by means of the Adjustment/Satisfaction Test (A/ST). Among the test signals no VoV is present. Most of the preferred LDs lie between 0 and 13 LU, with an average of 7 LU.
Finally, in [24], the preferred speech-to-background ratios as well as the ratios that allow to only just under-stand everything in a sentence are investigated and pre-dicted by means of an objective intelligibility measure. Preferred ratios range between -6 to 16 dB depending on the type of content. However, results are given as energy ratios in dB and cannot be directly compared with the other reviewed works.
All these mentioned works consider a static level of the background without considering ducking. However, ducking is widely used in real-world material. To the best of our knowledge, this paper is the first study investigating desirable LDs during ducking.
As a marginal note, numerous publications analyze music mixing preferences, which are much more docu-mented than the ones for clear audio for broadcasting. The interested reader is referred to [25, 26] and refer-ences therein.
3
Commonly Used LDs During Ducking
In this section, we intend to gain an understanding of existing ducking techniques in TV by analyzing real-world content. Documentary programs are selected, as they are a common format in TV and they tend to feature extensive use of ducking in the audio mix. In this type of content, it is common that a foreground speech narrates some facts (making its intelligibility important) while the background tends to belong to the depicted scene or create the mood of the scene (contributing to the full enjoyment).
Twelve documentaries broadcast in the UK, Germany, and France are considered. The documentaries are het-erogeneous, comprising a range of production values.
We measure the LDs for 6 VoV, 12 Commentary over Music (CoM), and 6 Dialog over Music (DoM) ex-cerpts, while the background is ducked.Commentary
refers to speech recorded in an audio recording studio, e.g. in a sound booth, and features professionals who speak clearly. On the other hand,(location) dialog
can be less clear than commentary, as it is recorded on the scene location using portable gear and it can in-clude location background sounds and non-professional speakers.
Torcoli et al. Ducking for TV with Clear Speech
VoV CoM DoM 5
10 15 20
LD [LU]
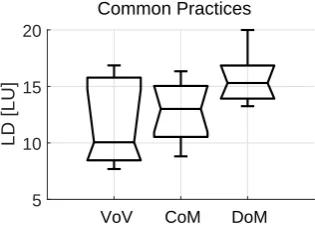
[image:5.595.101.259.129.244.2]Common Practices
Fig. 3:Boxplots2of the LDs during ducking found in
12 documentary programs broadcast in the UK, Germany, and France. Voice-over-Voice (VoV), Commentary-over-Music (CoM), and Dialog-over-Music (DoM) excerpts are considered.
excerpts are manually selected where ducking is em-ployed and the ducked background level is constant. For each excerpt, we isolate segments with active fore-ground voice and segments without forefore-ground voice. The segments belonging to the same excerpt and voice activity class are concatenated. The LD of one excerpt is estimated as difference between the integrated loud-ness of the concatenated mix segments when voice is active and the loudness of the background, i.e. the concatenated mix segments when voice is not active. For LDs above 5 LU, this estimation is experimentally found to give an average absolute error of 0.6 LU (abso-lute error variance is 0.2) on similar synthetic excerpts.
The found LDs are shown in Fig. 3 by boxplots2. Most of the values for VoV and CoM are within the 10-15 LU range, similarly to what was measured in the signals mixed by professionals in [20, 22].
The lowest LDs are found for VoV, which is surprising considering the possible informational masking. How-ever, voice-overs are recorded by professionals as for CoM, which is likely to enable comfortable listening in spite of the lower LDs. Higher LDs are found for DoM (14-17 LU). As location dialog can have lower clarity than commentary, audio engineers are likely to choose higher LD to compensate for this.
We also compare the usage of momentary and inte-grated loudness. When using momentary loudness,
2The ends of the boxes correspond to the 25/75% quantiles of
the data, the central bar corresponds to the median. The vertical lines extending from the box (whiskers) indicate the minimum and maximum points within 1.5 IQR (interquartile range).
values do not vary over 1 LU with respect to the inte-grated loudness. This can be explained by the short length and homogeneity of the analyzed excerpts.
Even if spanning different countries, topics, and pro-duction values, the considered selection of programs is small and the found values should be corroborated on a larger sample of broadcast material in future works.
4
Subjective Test on LD During Ducking
This section describes the subjective test carried out to determine what LDs listeners preferred during ducking in the context of documentary programs.
Method: The test is a multiple stimuli test, where each stimulus (or condition) has a different LD. Par-ticipants rate their preference for each condition with a slider ranging between 0-100 and labeled each 20-points range: bad, poor, fair, good, excellent. The 9 conditions correspond to increasing LDs. The mini-mum LDs are between -6 and 6 LU, while the con-dition with maximum LDs correspond to 20-28 LU. Conditions are presented ordered by ascending LD to eliminate the participant’s ability to identify what item is what and focus exclusively on ducking preference. The first condition features minimal or no ducking. The following conditions have the same background level when speech is not active, but increasing LDs when speech is active. The foreground speech has the same loudness for all conditions.
Instructions:The participants are told the following:
“Imagine you are hearing the presented audio pieces while watching television in your living room. Your task is to rate these different mixes (of background sounds and speech) based on your overall preference. This means that you rate the mix(es) that you would personally rather hear with the highest score.”’
Item Categories: The test focuses on commentary only, i.e. CoM as well as Commentary over Ambience (CoA). The minimum LDs for CoA are between -3 and 6 LU, i.e. these signals are examples of the special case in which ambience is particularly loud. Most of the time in broadcast material ambience has naturally low level, resulting in high LDs. Here, we are interested in analyzing the case in which also ambience has masking potential and ducking has to be applied.
Test Items: The test involves 12 different items (6 CoM and 6 CoA, each with the 9 different conditions).
AES 146thConvention, Dublin, Ireland, 2019 March 20 – 23
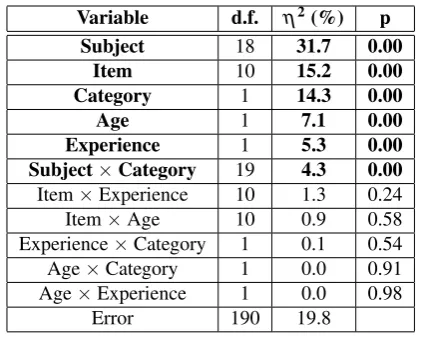
Variable d.f. η2(%) p
Subject 18 31.7 0.00
Item 10 15.2 0.00
Category 1 14.3 0.00
Age 1 7.1 0.00
Experience 1 5.3 0.00
Subject×Category 19 4.3 0.00
Item×Experience 10 1.3 0.24
Item×Age 10 0.9 0.58
Experience×Category 1 0.1 0.54 Age×Category 1 0.0 0.91 Age×Experience 1 0.0 0.98
[image:6.595.74.287.123.295.2]Error 190 19.8
Table 1:ANOVA of the preferred LDs: degrees of freedom (d.f.), effect sizeη2(given as
per-centage and reporting how much of the total variability can be explained by each effect), and p-values (if lower than 0.05, we reject the null hypothesis). Significant effects are marked in bold.
All test items feature German commentary panned to the center over stereo backgrounds. Examples of am-bience background are flowing water, street noise, car interior, subway hall. Music backgrounds feature no lyrics and can be categorized as soft rock, ambience music, and orchestral music. No accompanying video is shown. The sampling frequency is 48 kHz. A train-ing item is also present before the 12 test items for a better understanding of the experiment. This item is not considered in the results. During the training phase, the subjects are asked to modify the overall volume to a comfortable level.
Subjects: The test involves 11 expert listeners (be-tween 21 and 43 years old, median age 26) and 11 non-expert listeners (between 23 and 59 years old, median age 25). The expert listeners passed a listener-screening program and are verified for no hearing impairments and have high testing ability [27]. Five of them are pro-fessional audio engineers. All listeners have German as first language and have no known hearing impairments. They are volunteers and remunerated.
Location:Two similar listening rooms with high-end studio monitors are used. The rooms are quiet and acoustically treated so to resemble low-reverberant liv-ing rooms.
5
Subjective Test Results
The main analysis of the results is carried out on the preferred LDs, i.e. by considering the condition(s) with the highest score for each listener and item. In a few cases, more than one condition is rated with the highest score. In this case, the average LD is taken over the two or more preferred conditions.
A nested ANOVA with five factors was carried out on the preferred LDs. The five factors are: item, item category (CoM or CoA), subject, subject age, and sub-ject experience. The factor item is nested inside item category. The factor subject is nested inside age as well as inside experience. Item and item category are fixed factors, as they have fixed characteristics which could be used in a new experiment. Subject, age, and experi-ence are random factors, as they are samples randomly taken from the relevant population, on which we would like to generalize.
The factor age describes two groups created by taking the median age of the participants as threshold, i.e. 26. The first group comprises listeners born in 1992 or later. This group consists of 14 listeners with 24 as median age. The second group comprises 8 listeners born before 1992 with 34 as median age.
As shown in Table 1, all five factors are statistically sig-nificant. The factor subject can explain alone 31.7% of the total variability in the data, confirming that personal taste plays a fundamental role. As expected, item and category are significant factors, accounting together for the 29.5% of the total variability. The factor age explains 7.1% of the variability, even if no hearing-impaired or elderly listener is considered. Experience is statistically significant too, accounting for 5.3% of the variability. Experience is particularly interesting in our application, as TV mixes are created by experts for being consumed by non-experts. Finally, the only significant two-way interaction is between subject and category.
Torcoli et al. Ducking for TV with Clear Speech
CoM CoA All
0 10 20
LD [LU]
Listening Test: Preferred LD by Experience
CoM CoA All
0 Bad 20 Poor 40 Fair 60 Good 80 Excellent 100
Corresponding Rating
[image:7.595.94.503.121.250.2]Non-expert (11) Expert (11)
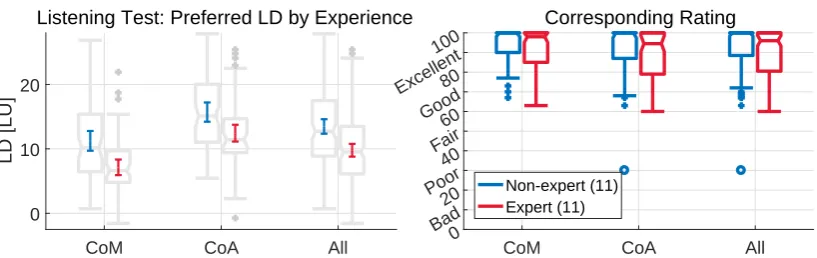
Fig. 4:The subplot on the left depicts 95% confidence intervals overlapping boxplots of the preferred LDs by category and experience. For each category, non-experts (in blue) are on the left and experts (in red) are on the right. The rating corresponding to the preferred LD is shown in the subplot on the right.
CoM CoA
-10 -5 0 5 10
LU
Good Range Relative Limits
Non-expert (11) Expert (11)
Fig. 5:Boxplots of the relative limit values of thegood rangefor each item and subject. This range includes the LDs rated above 60 and no more than 10 points below the preferred LD.
up perfectly the BBC hint of taking down the music by 4 dB [18, 19].
The right subplot of Fig. 4 depicts the ratings corre-sponding to the preferred LD. All the ratings lie in the “excellent” and “good” ranges, with only one exception (rating 30). This exception is due to a listener who complained about the fact that the background did not have much to do with what was being said in that item.
Beside the preferred LDs analyzed so far, we now con-sider the range comprising the LDs rated above 60 points (i.e. in the excellent and good ranges) and no more than 10 points below the preferred LD. We refer to this range as thegood range. Its limit values (rela-tive to the preferred LD) for each item and listener are shown in Fig. 5. They give a picture of the freedom that
[image:7.595.71.287.317.446.2]an audio engineer would have to meet the listener pref-erence. The interquartile ranges suggest that a±3 LU around the preferred LD would be still well received.
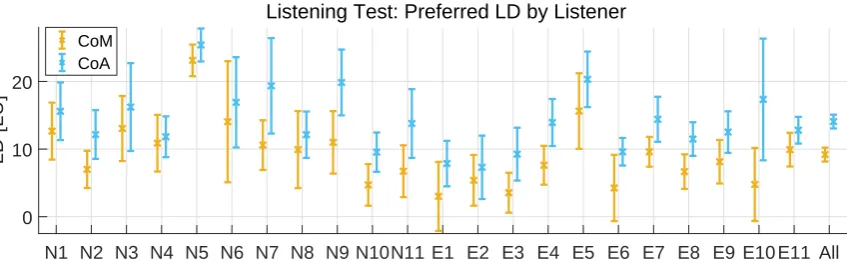
Fig. 6 visualizes the different preferences of the lis-teners. The different personal tastes can be clearly observed. It can be noticed that that the preferred LDs for CoM are consistently lower than the ones for CoA.
6
Discussion
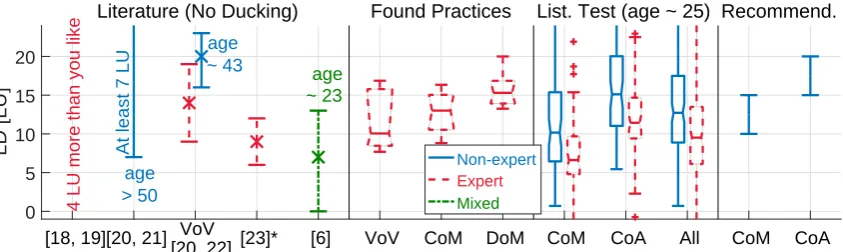
Fig. 7 summarizes the LD values presented so far and discussed in the following, where we also introduce our recommendations.
Our results show that non-expert listeners (such as the mix consumers) prefer LDs that are 4 LU higher than the levels preferred by experts (close to the mix cre-ators) on average. This backs up the rule of thumb suggested by the BBC to audio engineers on using LDs that are 4 LU higher than the ones they would like [18, 19]. A similar difference was documented in [22].
Trying to be more restrictive on LD values, German public broadcasters recommend at least 7 LU in general and at least 16 LU for VoV [20]. We found however that in broadcast material, it is common practice to use similar LDs for VoV and CoM, i.e. between 10 and 15 LU. Higher LDs are found only for DoM (14-17 LU), likely due to the innate lower intelligibility of location dialog.
Preferred LDs as low as 0 LU are found for expert and non-expert listeners in [6], where the median age is 23. The particularly low age of the listeners might explain
AES 146thConvention, Dublin, Ireland, 2019 March 20 – 23
N1 N2 N3 N4 N5 N6 N7 N8 N9 N10N11 E1 E2 E3 E4 E5 E6 E7 E8 E9 E10 E11 All 0
10 20
LD [LU]
Listening Test: Preferred LD by Listener
[image:8.595.88.512.124.255.2]CoM CoA
Fig. 6:Average and 95% confidence interval of the LD preferred by each subject for each category. For each subject, CoM (in yellow ocher) is depicted on the left and CoA (in light blue) on the right. Non-expert listeners have IDs starting withN, while expert IDs start withE.
the difference with the other reviewed works. These lower values are not recommendable for the default TV mix, but it is recommendable to make them available via the personalization offered by object-based systems such as MPEG-H Audio. The results of our listen-ing test also show that subjects have clearly different personal preferences for the LD values.
A recommendation on the LD for the default mix has to take into consideration the preference of non-expert listeners, as they are a sample similar to the consumers of the audio mix. Our listening test shows that non-experts prefer 6.5 - 15.4 LU for CoM and 11 - 20 for CoA. It is also shown that listeners well receive a range of±3 LU around the preferred LD. These are large ranges, but a recommendation can be made by suggestingat leastthe median values, i.e. trying to meet the preference of the half of the population that prefers higher LDs. Satisfying the higher half of the population also make the values closer to the ones that would be needed in suboptimal listening conditions or for hearing-impaired listeners.
Hence, as shown in the rightmost part of Fig. 7, we recommend at least 10 LU for CoM. Higher LDs need to be adopted for DoM. For CoA, at least 15 LU can be recommended. Esthetically pleasing upper limits can be considered 15 LU for CoM and 20 LU for CoA (i.e. the 75% quartile of the preferences of the non-expert listeners). The range 10 - 15 LU for CoM was also observed to be commonly used in the analyzed real-world programs.
The values discussed in this paper are for rather sta-tionary backgrounds. There might be cases and signals
where the optimal LD could deviate significantly from the recommended values. In these cases, the know-how of an experienced audio engineer is irreplaceable.
7
Conclusion
Ducking is a technique that facilitates speech intelligi-bility, while keeping the background enjoyable. Even if it is extensively used in TV audio, optimal values for its parameters are not documented in literature. This paper filled this void by focusing on the integrated Loudness Difference (LD) between foreground speech and background during ducking.
This was done by analyzing common practices found in a sample of TV documentaries and by carrying out a subjective test on the LDs preferred by 22 normal-hearing listeners. Our findings were compared with related works, even if these works considered a static level of the background and did not consider ducking.
The results clearly showed that only the personaliza-tion offered by object-base audio technologies such as MPEG-H Audio can meet the preferences of each sub-ject. Nevertheless, a default mix is needed satisfying as many subjects as possible.
For a default mix which is esthetically pleasing and has clear speech, we recommend a LD of at least 10 LU for Commentary over Music (CoM) and 15 LU for Commentary over Ambience (CoA). Higher LDs need to be used for location dialog.
Torcoli et al. Ducking for TV with Clear Speech
[18, 19] [20, 21] [23]* [6] VoV CoM DoM CoM CoA All CoM CoA 0
5 10 15 20
LD [LU]
4 LU more than you like
At least 7 LU
age > 50
age
~ 43 age
~ 23
Literature (No Ducking) Found Practices List. Test (age ~ 25) Recommend.
[image:9.595.87.509.126.252.2]VoV [20, 22]
Non-expert
Expert Mixed
Fig. 7:Integrated Loudness Difference (LD) between foreground speech and background for the default mix in TV audio. Visual summary of literature review, common practices found in the analyzed documentary programs, results from the preference listening test, and final recommendations for Commentary over Music (CoM) and Commentary over Ambience (CoA). A modified loudness measurement is used in [23] and it is unknown to what extend it is comparable with the other values.
that non-expert listeners (such as the audio consumers) prefer LDs that are higher than 4 LU than the ones preferred by expert listeners (such as the mix creators). This difference might be even higher when considering sub-optimal listening conditions.
Future works should include subjects with higher age and age-related hearing impairment. More items, item categories, and reproduction configurations should also be studied. In addition, only the LD was investigated, which is the main parameter of ducking, but not the only one. Other parameters such as the time constants should be analyzed in future works.
8
Acknowledgment
Special thanks go to all who took part in the listening test and to Mariola Hatalski for taking care of them.
References
[1] Armstrong, M., “From Clean Audio to Ob-ject Based Broadcasting,” in BBC Research & Development White Paper, WHP324, 2016, available at http://www.bbc.co.uk/rd/
publications/whitepaper324.
[2] Tang, Y. and Cox, T. J., “Improving Intelligibil-ity Prediction under Informational Masking Us-ing an Auditory Saliency Model,” inProc. of the Int. Conf. on Digital Audio Effects (DAFx), 2018.
[3] ITU-R Recommendation BS.1770-4, “Algorithms to measure audio programme loudness and true-peak audio level,” 2015.
[4] EBU Recommendation R 128, “Loudness Nor-malisation and Permitted Maximum Level of Au-dio Signals,” 2014.
[5] Fuchs, H., Tuff, S., and Bustad, C., “Dialogue En-hancement - technology and experiments,”EBU Technical Review, Q2, 2012.
[6] Torcoli, M., Herre, J., Fuchs, H., Paulus, J., and Uhle, C., “The Adjustment/Satisfaction Test (A/ST) for the Evaluation of Personalization in Broadcast Services and Its Application to Dia-logue Enhancement,”IEEE Trans. on Broadcast-ing, 64(2), pp. 524–538, 2018.
[7] Shirley, B. and Kendrick, P., “ITC Clean Audio Project,” inProc. of the 116th Audio Engineering Society Conv., Berlin, 2004.
[8] Shirley, B. and Kendrick, P., “The Clean Audio project: Digital TV as assistive technology,” Tech-nology and Disability, 18(1), pp. 31–41, 2006.
[9] Fuchs, H. and Oetting, D., “Advanced Clean Au-dio Solution: Dialogue Enhancement,”SMPTE Motion Imaging Journal, 123(5), 2014.
[10] Shirley, B., Meadows, M., Malak, F., Woodcock, J., and Tidball, A., “Personalized Object-Based
AES 146thConvention, Dublin, Ireland, 2019 March 20 – 23
Audio for Hearing Impaired TV Viewers,”J. of the Audio Engineering Society, 65(4), pp. 293– 303, 2017.
[11] Walton, T., Evans, M., Kirk, D., and Melchior, F., “Does Environmental Noise Influence Prefer-ence of Background-Foreground Audio Balance?” inProc. of the 141st Audio Engineering Society Conv., Los Angeles, 2016.
[12] Mapp, P., “Intelligibility of Cinema & TV Sound Dialogue,” inProc. of the 141st Audio Engineer-ing Society Conv., Los Angeles, 2016.
[13] Florentine, M., “Speech Perception in Noise by Fluent, Non-native Listeners,”J. of the Acoustical Society of America, 77(S1), pp. S106–S106, 1985.
[14] Herre, J., Hilpert, J., Kuntz, A., and Plogsties, J., “MPEG-H 3D Audio - The New Standard for Coding of Immersive Spatial Audio,”IEEE J. of Selected Topics in Signal Processing, 9(5), pp. 770–779, 2015.
[15] Kuech, F., Kratschmer, M., Neugebauer, B., Meier, M., and Baumgarte, F., “Dynamic Range and Loudness Control in MPEG-H 3D Audio,” inProc. of the 139th Audio Engineering Society Conv., New York, 2015.
[16] ISO/IEC, “Information technology – High effi-ciency coding and media delivery in heteroge-neous environments – Part 3: 3D audio,” Inter-national Standard 23008-3:2018, Second Edition, 2018.
[17] Torcoli, M., Herre, J., Paulus, J., Uhle, C., Fuchs, H., and Hellmuth, O., “The Adjust-ment/Satisfaction Test (A/ST) for the Subjective Evaluation of Dialogue Enhancement,” inProc. of the 143rd Audio Engineering Society Conv., New York, 2017.
[18] BBC Editorial Guidelines, “Hearing Im-paired Audiences,” 2011, available at
http://downloads.bbc.co.uk/ guidelines/editorialguidelines/
pdfs/hearing-impaired.pdf.
[19] BBC Academy, “Clear Sound: Best Prac-tice Tips,” 2017, available at https: //www.bbc.co.uk/academy/en/
articles/art20130702112135255.
[20] Sprachverständlichkeit im Fernsehen, Empfehlun-gen für Programm und Technik (Intelligi-bility in Television, Recommendations for
TV Program and Technique), ARD/ZDF,
2014, (in German) available at: https: //www.irt.de/webarchiv/showdoc.
php?z=NzE0MSMxMDA2MDE4I3BkZg==.
[21] Ebert, E. and Bodenseh, E., “Arbeitsergebnisse und die daraus resultierende Guideline(Speech Intelligibility in TV: A Guideline),” inProc. of the 28th Tonmeistertagung - VDT Int. Conv., 2014, (in German).
[22] Liebl, T., Goossens, S., and Krump, G., “Verbesserung der Sprachverständlichkeit, speziell bei Voice-Over-Voice-Passagen
(Improvement of Voice-Over-Voice Speech Intelligibility in Television Sound),” inProc. of the 28th Tonmeistertagung - VDT Int. Conv., 2014, (in German).
[23] Komori, T., Takagi, T., Kurozumi, K., and Mu-rakawa, K., “An Investigation of Audio Balance for Elderly Listeners using Loudness as the Main Parameter,” inProc. of the 125th Audio Engineer-ing Society Conv., San Francisco, 2008.
[24] Tang, Y., Fazenda, B. M., and Cox, T. J., “Auto-matic Speech-to-Background Ratio Selection to Maintain Speech Intelligibility in Broadcasts Us-ing an Objective Intelligibility Metric,”Applied Sciences, 8(1), p. 59, 2018.
[25] Fenton, S., “Automatic Mixing of Multitrack Material Using Modified Loudness Models,” in
Proc. of the 145th Audio Engineering Society Conv., New York, 2018.
[26] De Man, B., Reiss, J., and Stables, R., “Ten Years of Automatic Mixing,” inProc. of the 3rd Work-shop on Intelligent Music Production, 2017.