International Journal of Emerging Technology and Advanced Engineering
Website: www.ijetae.com (ISSN 2250-2459,ISO 9001:2008 Certified Journal, Volume 4, Issue 7, July 2014)
312
Implementation of Discrete Wavelet Transform For
Multimodal Medical Image Fusion
Nayera Nahvi
1, Onkar Chand Sharma
21Punjab Technical University, ECE Dept, SVIET, Banur, India
2Associate Professor and HOD, ECE Dept, SVIET, Banur , India
Abstract- Image Fusion is a technique by which two or more images are combined together to generate a single image that has important properties of both the original images. Generally, multifocal images are combined together with the help of image fusion to generate a high quality image. Other domain where Image fusion is readily used nowadays is in medical diagnostics to fuse medical images such as CT (Computed Tomography), MRI (Magnetic Resonance Imaging) and MRA. This paper aims to present a new algorithm to improve the quality of multimodality medical image fusion using Discrete Wavelet Transform (DWT) approach. Discrete Wavelet transform has been implemented using different fusion techniques including pixel averaging, min-max and max-min methods for medical image fusion. Performance of fusion is calculated on the basis of PSNR, MSE and the total processing time and the results demonstrate the effectiveness of fusion scheme based on wavelet transform.
Keywords-- Image Fusion, Multimodality medical image fusion, fusion rules, PSNR, MSE.
I. INTRODUCTION
Image fusion refers to the techniques that integrate complementary information from multiple image sensor data such that the new images are more suitable for the purpose of human visual perception and the computer processing tasks. The fused image should have more complete information which is more useful for human or machine perception. The advantages of image fusion are improving reliability and capability [1]-[3]. The successful fusion of images acquired from different modalities or instruments is of great importance in many applications such as medical imaging, microscopic imaging, remote sensing computer vision and robotics. Image fusion techniques can improve the quality and increase the application of these data. As the use of various medical imaging systems is rapidly increasing so multi-modality imaging is playing an important role in medical imaging field. The combination of the medical images can often lead to additional clinical information not apparent in the separate images [4-7]. The functional and the anatomical information are combined in a single image. Most of the available equipment is not capable of providing such data convincingly. Image fusion techniques allow the integration of different information sources. The fused image can have complementary spatial and spectral resolution characteristics [8].
Many fusion techniques have been proposed in the literature. Use of the simplest image fusion technique like pixel averaging will not recover well fused image due to reduced contrast effect. Other methods based on intensity hue saturation (IHS), principal component analysis (PCA) etc. have also been developed [9].
In this paper a novel approach for fusion of different medical images of MRI and CT has been proposed using wavelet transform. The CT and MRI of the same people and same spatial parts have been used for analysis and different fusion rules have been implemented on them.
II. METHODS FOR IMAGE FUSION
Various methods are available for image fusion applications but image fusion techniques are basically classified into two broad categories i.e. Spatial Domain Fusion method and Transform domain fusion method. These are explained below:
i. Spatial Domain Fusion Techniques
In spatial domain techniques, we directly deal with the image pixels. The pixel values are manipulated to achieve desired result. In frequency domain methods the image is first transferred in to frequency domain. It means that the Fourier Transform of the image is to be computed first. All the Fusion operations are performed on the Fourier transform of the image and then the Inverse Fourier transform is performed to get the resultant image. Image Fusion applied in every field where images are ought to be analyzed. For example, medical image analysis, microscopic imaging, analysis of images from satellite, remote sensing application, computer vision, robotics etc. The fusion methods such as averaging, Brovey method, principal component analysis (PCA) and IHS based methods fall under this category. Another important spatial domain fusion method is the high pass filtering based technique. The disadvantage of spatial domain approaches is that they produce spatial distortion in the fused image. Spectral distortion becomes a negative factor while we go for further processing such as classification problem.
ii. Transform domain based fusion technique
International Journal of Emerging Technology and Advanced Engineering
Website: www.ijetae.com (ISSN 2250-2459,ISO 9001:2008 Certified Journal, Volume 4, Issue 7, July 2014)
313
III. IMAGE FUSION BASED ON WAVELET TRANSFORM
The original concept and theory of wavelet-based multiresolution analysis came from Mallat. The wavelet transform is a mathematical tool that can detect local features in a signal process. It also can be used to decompose two dimensional (2D) signals such as 2D gray-scale image signals into different resolution levels for multiresolution analysis. Wavelet transform has been greatly used in many areas, such as texture analysis, data compression, feature detection, and image fusion. In this section, we briefly review and analyze the wavelet-based image fusion technique.
A. Wavelet Transform
[image:2.595.48.278.377.443.2]Wavelet analysis represents the next logical step: a windowing technique with variable-sized regions. Wavelet analysis allows the use of long time intervals where we want more precise low-frequency information, and shorter regions where we want high-frequency information.
Figure 1: Wavelet Transform on a signal
Wavelet Transform in contrast with the time-based, frequency-based, and STFT views of a signal:
Figure 2: Comparison of Various Transform Techniques
Wavelet analysis does not use a time-frequency region, but rather a time-scale region. Wavelets have scale aspects and time aspects; consequently every application has scale and time aspects.
For scale aspects, we present an idea around the notion of local regularity. For time aspects, we present a list of domains. When the decomposition is taken as a whole, the de-noising and compression processes are centre points.
One of the most popular successes of the wavelets is the compression of FBI fingerprints.
Wavelet transforms provide a framework in which a signal is decomposed, with each level corresponding to a coarser resolution or lower frequency band and higher frequency bands. There are two main groups of transforms, continuous and discrete. The discrete wavelet transform (DWT), which applies a two- channel filter bank (with down sampling) iteratively to the low pass band (initially the original signal). The wavelet representation then consists of the low- pass band at the lowest resolution and the high-pass bands obtained at each step. This transform is invertible and non redundant. The DWT is spatial-frequency decomposition that provides a flexible multiresolution analysis of an image.
In one dimension (1D) the basic idea of the DWT is to represent the signal as a superposition of wave lets. Suppose that a discrete signal is represented by f (t); the wavelet decomposition is then defined as
f (t) = ∑ cm,n ψm,n (t) (1)
m,n
Where ψm,n(t) = 2 –m/2ψ[2 -mt - n ] and m and n are integers.
B. Wavelet Transform for Image Fusion
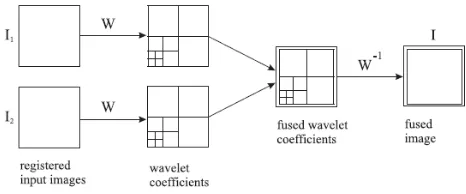
[image:2.595.324.557.468.565.2]The schematic diagram for wavelet based fusion techniques is shown in figure 3:
Figure 3: Image Fusion using discrete wavelet transform [10]
C. Algorithm
Following algorithm has been developed and implemented in MATLAB software using Image Processing Toolbox and Wavelets toolbox.
STEPS:
i. Read the image I1 and find its size. ii. Read the second image I2 and find its size.
iii. Compute and match the size if not same, make it same.
iv. Convert both images from grayscale to indexed
[image:2.595.52.278.498.647.2]International Journal of Emerging Technology and Advanced Engineering
Website: www.ijetae.com (ISSN 2250-2459,ISO 9001:2008 Certified Journal, Volume 4, Issue 7, July 2014)
314
v. Perform multi-level wavelet decomposition using
any wavelet.
vi. Generate the coefficient matrices of the level-three approximation (cA1) and horizontal, vertical and diagonal details (cH1, cV1, cD1, respectively). vii. Construct and display approximations and details
from the coefficients.
viii. Regenerate an image by multi-level Inverse
Wavelet Transform.
ix. Repeat the same with second image.
x. Now fuse the wavelet coefficients using either of averaging, max-min or min-max technique.
xi. Generate a final matrix of fused wavelet
coefficients.
xii. Compute the inverse wavelet transform to get the fused image.
xiii. Finally compute the PSNR and display the result.
xiv. Also, compute and compare the processing time by
each technique.
D. Block Diagram for Image Fusion
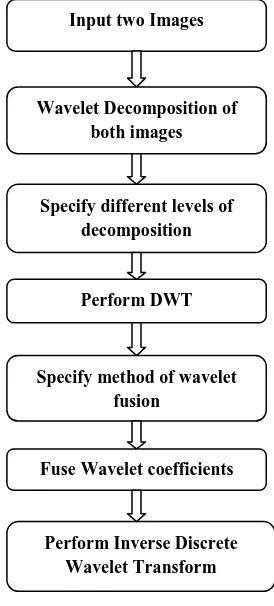
The block diagram for image fusion is shown in figure 4.
[image:3.595.86.223.404.707.2]
Figure 4: Block diagram for image fusion
The two input images are first read and converted to indexed images. After that the wavelet decomposition is done to find the approximate, horizontal, vertical and diagonal details.
The decomposition level and the type of wavelet used are specified. DWT is then performed on the input images. The coefficients found are then fused used a specific fusion rule and then the images are restored back using inverse discrete wavelet transform.
E. Fusion Techniques
The different fusion techniques used are mentioned below:
i) Averaging Technique
It is a well documented fact that regions of images that are in focus tend to be of higher pixel intensity. Thus this algorithm is a simple way of obtaining an output image with all regions in focus. The value of the pixel P (i, j) of each image is taken and added. This sum is then divided by 2 to obtain the average. The average value is assigned to the corresponding pixel of the output image which is given in equation (2). This is repeated for all pixel values.The fused image K( i,j) is given as
K (i, j) = {X (i, j) + Y (i, j)}/2 (2)
Where X (i , j) and Y ( i, j) are two input images and K(i,j) is the fused image.
ii) Maximum Selection Scheme
This scheme just picks coefficient in each subband with largest magnitude. A selection process is performed here wherein, for every corresponding pixel in the input images, the pixel with maximum intensity is selected, and is put in as the resultant pixel of the fused image K( i,j)
K(i, j) = Max.[w(I1(x,y)), w(I2(x,y))] (3)
Where I1(x,y), I2(x,y) are the input images.
iii) Minimum Selection Scheme
This scheme just picks coefficient in each subband with smallest magnitude. A selection process is performed here wherein, for every corresponding pixel in the input images, the pixel with minimum intensity is selected and is put in as the resultant pixel of the fused image K( i,j)
K( i, j) = Min.[w(I1(x,y)), w(I2(x,y))] (4)
IV. RESULTS
We have considered three different types of wavelets namely Haar, Daubechies (db2) and Bior (Bior1.5) for fusing the CT and MRI images. Also different fusion rules including pixel averaging, maximum minimum and minimum maximum were implemented. Since haar wavelet along with maximum minimum rule produced better results in terms of PSNR and MSE so they were used for further analysis. For evaluating the results various performance metrics were used.
Input two Images
Wavelet Decomposition of both images
Specify different levels of decomposition
Perform DWT
Specify method of wavelet fusion
Fuse Wavelet coefficients
International Journal of Emerging Technology and Advanced Engineering
Website: www.ijetae.com (ISSN 2250-2459,ISO 9001:2008 Certified Journal, Volume 4, Issue 7, July 2014)
315
i) PSNR
PSNR is the ratio between the maximum possible power of a signal and the power of corrupting noise that affects the fidelity of its representation. The PSNR measure is given by:
PSNR= 10log 10 (R2 / MSE) (5)
R is the maximum fluctuation in the input image data type. For example, if the input image has a double-precision floating-point data type, then R is 1. If it has an 8-bit unsigned integer data type, R is 255.
ii) Mean Squared Error (MSE)
The mathematical equation of MSE is given by the equation below
MSE = ∑ [I1(m,n) _ I2(m,n) ]2 M,N
(6)
_________________________________
M*N
Where, I1 is the perfect image, I2 is the fused image to
be assessed, i is pixel row index, j is pixel column index; m, n are the number of rows and columns.
The figures below show the original CT and MRI images and the fused images using different rules.
(a) (b)
(c) (d)
(e)
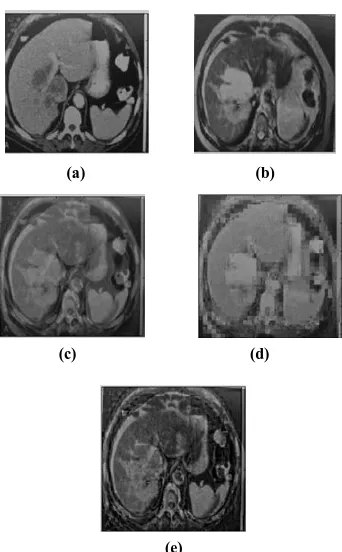
Figure 5: (a) CT image (b) MRI image (c) fused image using maximum rule (d) using pixel averaging (e) using minimum rule
[image:4.595.79.250.426.702.2]The above images can be interpreted both qualitatively and quantitatively. The images that are fused using the maximum rule have better contrast in comparison to those fused using pixel level fusion method and minimum rule because the image is not blurred which affects the contrast of image. Also this method gives the clearer images because there is no variation in the focus of the images having different gray scale intensities. Thus, the clarity of the image is maintained.
Table I:
Results for the fused image (figure 5 (c, d, e)) using maximum fusion rule
Fusion Method
PSNR MSE Elapsed
time
Pixel averaging
35.9714 16.4415 4.3057
Maximum 46.9357 1.3165 5.7508
Minimum 35.3818 18.8323 5.5071
Quantitatively the images can be interpreted in the way that the maximum rule for fusion gives the higher values of PSNR i.e.; 46.9357 and lower values of MSE i.e.; 1.3165 which implies that the quality of the fused image is better, error is less and it contains more information. Thus, it is clear that the maximum rule performs better than the other two methods since the values of PSNR are 35.9714 and 35.3818 for pixel averaging and minimum rule respectively which are lower than maximum method. Also the values of MSE 16.4415 and 18.8323 for pixel averaging and minimum rule respectively are lower than maximum method. The maximum rule is applied to other images of CT and MRI and the results are shown below in figure 6.
(a) (b)
[image:4.595.352.516.571.760.2]
International Journal of Emerging Technology and Advanced Engineering
Website: www.ijetae.com (ISSN 2250-2459,ISO 9001:2008 Certified Journal, Volume 4, Issue 7, July 2014)
316
(e)
Figure 6: (a) CT image (b) MRI image (c) fused image using maximum rule (d) pixel averaging (e) minimum rule
Table II
Results for the fused image (figure 6(c, d, e)) using maximum fusion rule.
Fusion Method
PSNR MSE Elapsed
time
Pixel averaging
37.5378 11.4632 2.8360
Maximum 44.3493 2.3886 3.6577
Minimum 38.4631 9.2635 3.6293
The value of PSNR is highest (44.3493) for maximum rule and the values for pixel averaging and minimum rule are 37.5378 and 38.4631 respectively showing that our proposed method performs better. Also the values of MSE are 2.3886, 11.4632 and 9.2635 for maximum, pixel averaging and minimum rule respectively with maximum rule having the lowest value.
The maximum rule is applied to other images of CT and MRI and the results are shown below in figure 7.
(a) (b)
(c) (d)
(e)
Figure 7: (a) CT image (b) MRI image (c) fused image using maximum rule (d) pixel averaging (e) minimum rule
Table III
Results for the fused image (figure 7(c, d, e)) using maximum fusion rule.
Fusion Method
PSNR MSE Elapsed
time
Pixel averaging
36.8417 13.4557 4.3341
Maximum 46.2188 1.5531 5.6608
Minimum 35.6617 17.6566 5.6899
The value of PSNR is highest (46.2188) for maximum rule and the values for pixel averaging and minimum rule are 36.8417 and 35.6617 respectively showing that our proposed method performs better. Also the values of MSE are 2.3886, 11.4632 and 9.2635 for maximum, pixel averaging and minimum rule respectively with maximum rule having the lowest value.
V. CONCLUSION
The experimental results show that the wavelet transform is a powerful method for image fusion. This method gives encouraging results in terms of PSNR and MSE. Also from the results it was observed that the maximum fusion rule gives better results and the values of PSNR increase and MSE decrease as the decomposition level increases.
REFERENCES
[1] H. H. Wang, “A new multiwavelet-based approach to image
fusion”,Journal of Mathematical Imaging and Vision, vol.21, pp.177-192,Sep 2004.
[2] V. Petrovic and C. Xydeas, “Evaluation of image fusion
performance with visible differences”, Lecture Notes in Computer Science, vol.3023, 2004.
[image:5.595.98.255.520.698.2]International Journal of Emerging Technology and Advanced Engineering
Website: www.ijetae.com (ISSN 2250-2459,ISO 9001:2008 Certified Journal, Volume 4, Issue 7, July 2014)
317
[4] C.Y.Wen, J.K.Chen, “Multi-resolution image fusion technique
and its application to forensic science”, Forensic Science International, vol 140, pp-217-232, 2004.
[5] H.C.Xie, G.Li.H.Ning, C. Menard, C.N. Coleman, and R.
W.Miller. “3D voxel fusion of multi- modality medical images in a clinical treatment planning system”, Proceedings of the 17th
IEEE Symposium on Computer-Based medical System
(CBMS’04) Jun.2004-Jun, 2004, IEEE Computer Society, 2004.
[6] J.G.Liu, “Evaluation of landsat-7ETM+panchromatic band for
image fusion with multispectral bands”, Natural Resources Research 9, vol 4, 2000, pp. 269-276.
[7] S.G,Morabito, “F.C.NDT image fusion using eddy current and
ultrasonic data”,COMPEL:Int J for Computation and Maths. In Electrical and Electronic Eng. 20, vol.3, 2001, pp -857-868.
[8] Fast Quantitative Correlation Analysis and Information Deviation
Analysis for Evaluating the Performances of Image Fusion Techniques, Qiang Wang, Yi Shen, Member, IEEE, Ye Zhang, and Jian Qiu Zhang, Senior Member, IEEE, IEEE Transactions On Instrumentation And Measurement, Vol. 53, No. 5, October 2004.
[9] Yong Yang , Dong Sun Park, Shuying Huang Zhijun Fang,
Zhengyou Wang, “Wavelet based Approach for Fusing Computed Tomography and Magnetic Resonance Images”, Control and Decision Conference (CCDC’09), Guilin, China, 17-19 June, 2009, pp 5770-5774.
[10] Yong Yang, Dong Sun Park, Shuying Huang, and Nini Rao,