775
A HYBRID METHOD FOR EXUDATES DETECTION USING
CHAIN PROCESSING BY WATERSHED SEGMENTATION
AND K-MEANS CLUSTERING
MOKHLED S. ALTARAWNEH
Computer Engineering Department, Faculty of Engineering, Mutah University, B.O.Box (7), Mutah 61710, Jordan
E-mail: [email protected]
ABSTRACT
The Exudates detection is an important task in diabetic retinopathy screening. Chain processing method (CPM) for exudates segmentation and detection has been designed for this purpose. CPM proposed new pre-processing approach, which perform not only enhancement task, but also detect and crop object region of interest in the image, which is the main contribution of this work. In post processing stage, a double segmentation and clustering based on chaining watershed and K-means clustering is proposed. The importance of the study lies in the use of clustering segmentation based on chain processing. The method has been validated on DIARETDB1 database; it is compared to 4 ground truths expert's of database evaluation protocols. Following the database evaluation protocol under statistical measurement factors to evaluate overall performance, it is found that the sensitivity specificity, predictive value, and accuracy of 96.12%, 99.76%, 92.64% and 99.69% respectively.
Keywords: Exudates detection, Watershed, K-means clustering, Segmentation.
1. INTRODUCTION
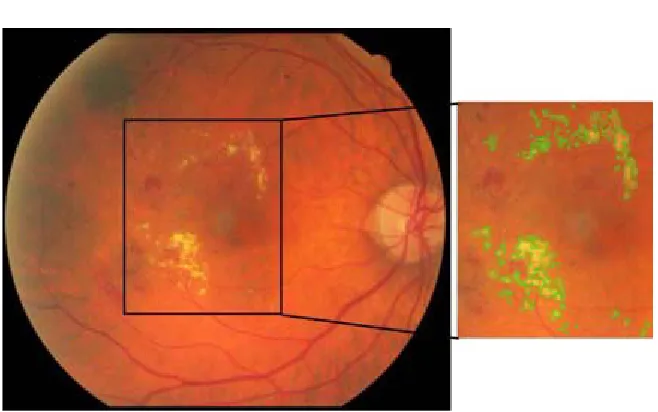
The identification of exudates in the macular region plays an important role in the yellow spot of diabetes and helps in the effective detection of the severity of the disease at a higher level of sensitivity. As a result, exudates detection plays an important role in the efficient diagnosing [1]. Exudates are major signs of diabetic retinopathy. There are two types of exudates, smooth and solid appearance. Solid exudates appear in non-proliferative diabetic retinopathy (DR), where smooth exudates appear in proliferative or reproductive disease. Exudates appear as white/yellow “soft or smooth” structures in color retinal images. Their size is variable: they can be as small as a micro aneurysm or as large as the optic disc. Moreover, they also show a large variability in shape and contrast. An example of exudates is shown in figure 1, where it appears on the retinal color image and has been identified by a manual illustration provided by an ophthalmologist [2].
Solid exudates are accumulated fatty formations leaked from weak vessels [3],[4]. Solid exudates lesions are waxy and yellow with relatively clear edges [5]. It is often appearing in clusters or rings. Smooth exudates, also known as lumbar lesions or
minor infarcts, appear when peripheral retinal vertebrae are hindered [4]. Smooth exudates are small, whitish lesions with blurry edges [5]. Figure 2 shows a magnified fundus image where a smooth exudates lesion is marked with circles. As shown in figure 2, the smooth exudates are not often visible as solid exudates. Table 1 shows the features of different types of abnormal lesion with reference to smooth and solid exudates. It is clear that exudates mean blood leakage from the blood vessels, which is the main cause of blindness in diabetics. Image processing techniques are used to detect and segment exudates in the retina images. This research will focus on the development of a precise and reliable procedure for classifying the abnormal image with sensitivity and normal with the limiting factors. All the parameters given in table 1are taken into account, in addition to having a high density and high contrast value with the background, the common feature of solid and smooth exudates is that both appear as brighter than their own neighborhood.
2. LITERATURE REVIEW
776 image processing techniques [6]. This survey will categorize these techniques in three categories: first category based on thresholding and region growing [7-9], these methods are simple but have difficulties in choosing threshold values, seed points and stop criteria in image area. The second category is based on clustering techniques [10] [11] [2], where the main difficulty with these methods is to determine the number of clusters to use. The third category is based on mathematical morphology [12] [13] [6], all of these techniques depends on image contrast. Outside of previous categories, the researchers rely on a combination approaches which use benefits of two or more categories. Most of researchers in this field unanimously agreed to use pre-processing step as primary step to prepare the region of interest for segmentation and detection the abnormal object, which is based on obtaining a suitable image for feature extraction. Ward et al. [14] proposed an algorithm which consists of shade variation reduction by several operators and exudates contrast enhancement basis of their brightness or gray level and sharpening based on a global threshold value. A good summary and review for many works for automatic exudates detection was given in [15]. Shipla and karule classified most of segmentation approaches into thresholding, morphology, clustering, classification and mixture modeling [15]. All these categories suffered from noise, low image quality, and high computation time, table 2. Our research contribution to design and implement a method to overcome all previous challenge factors, So CPM will use the benefits of good techniques in building chain processing method for segmentation and detection of accurate exudates.
3. METHODOLOGY
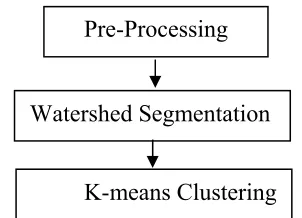
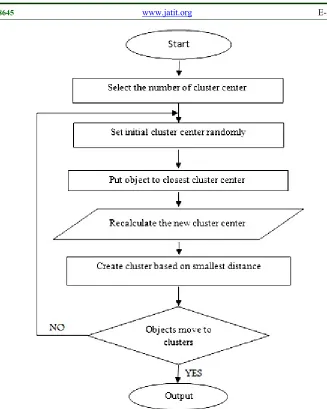
The proposed chain processing methodology is a three stages process. The first stage uses pre-processing techniques for image components extraction, prominence quality enhancement and image cropping resizing, which give in results a region work of interest, i.e. the area of exudates exploring. Second stage uses the watershed segmentation algorithm on a cropped region of interest (ROI) to pre-segment the image so as to get the initial watershed partition. Watershed transform is applied to obtain an initial segmentation of the exudates. Statistical texture features are also computed for the identified regions. While the last stage uses k-Means clustering to produce the final segmentation map to detect an exudates severities. The flow chart of proposed CPM is in figure 3
,
[image:2.612.336.487.130.239.2]while the pseudo code explains the methodology in steps.
Figure 3: Proposed methodology flow chart
Pseudo code
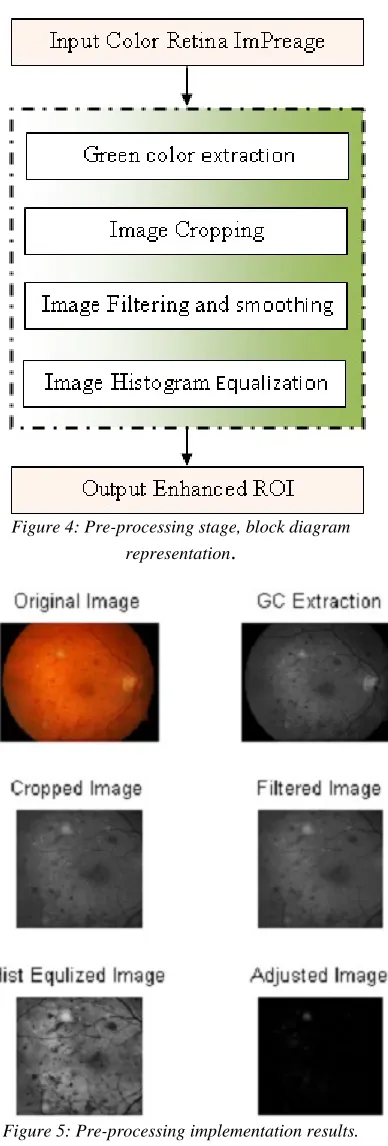
Step 1: Retina image in RGB is taken as input. Step 2: The green component is eliminated from the RGB image.
Step 3: Quality enhancement is done for prominence
3-1: Image cropping for disc isolation. 3-2: Image filtration by median on intensity channel.
3-3: Image histogram equalization. Step 4: Apply watershed segmentation algorithm for initial portioning.
Step 5: Apply K-means clustering algorithm to detect exudates
Step 6: Method performance check according to sensitivity, specificity, accuracy and predictive values
3.1 Pre-Processing Stage
Retina images contain acquisition elements that need to be removed. Many studies show that about 12% of retinal images cannot be clinically analyzed because of their inadequate quality [16, 17]. In this case, image pre-processing is necessary to improve retina image quality for easy detection of exudates. Image noise can be randomized to brightness or color information or the visible grain transfer of the image. This is highly undesirable especially in cases where the exudates characteristics are comparable to those of the artifacts produced due to the existence of noise. Hence, retinal image pre-processing is essential to improve the quality of an image for easy detection of exudates. The steps involved in pre-processing are: (i) Green color extraction from RGB images, and image cropping to isolate retinal disc, (ii) Image filtering for removing artifact due to non-uniform illumination, and Gaussian smoothing for noise removal, (iii) Histogram equalization to assign the intensity values of pixels in the input image so that the output image will contain a uniform distribution of
Pre-Processing
Watershed Segmentation
777 intensities. It improves contrast and obtains a uniform histogram; a result will be enhanced region of interest (ROI), Figure 4, while Figure 5 shows its implementation results.
Figure 4: Pre-processing stage, block diagram
[image:3.612.107.291.151.411.2]representation
.
Figure 5: Pre-processing implementation results.
Based on above, enhanced region of interest was a result of pre-processing stage and can be used as the input for processing approaches. A proposed method is based on a combination of image processing techniques; watershed as a marker of exudates and k-mean clustering to accurately detect exudates in the specific area of interest.
3.2 Watershed Segmentation as CPM Base
Watershed segmentation is a simple and effective method but it is major drawback is that it often produces over-segmented results. To reduce over segmentation of excaudate, the adaptive and marker-extraction algorithm are used to improve the watershed problem. Watershed transform is calculated for the marker modified gradient for controlling over segmentation problem [18], [19]. In this research, the watershed transform [20] was executed on the pre-processing gradient image. The gradient defined the first partial derivative of an image and contains a measurement for the change of gray levels. The gradient values (G (x, y)) of the initial segmented image will be obtained using the approximation of the gradient operator in x, y [21]. A gradient marker image determine the desired local minima to designated image, therefore watershed performs a determined collective area which leads to over segmentation, figure 6. The partition can be controlled by tags, where the variable shape is incomplete and can be solved by k-means clustering approach.
3.3 K-means Segmentation
K-means is used because of its computational simplicity [22], it is an unsupervised clustering algorithm, it clusterized an input image into segmented regions. In the chain processing method it takes a defined marker watershed segments and re-clustering them into exact exudates objects. K-means works at this stage in steps. The first step is to determine the centroid for each cluster, and then each point of the data set will be mapped to the nearest centroid based on Euclidian distance, while the second step updates each defined point to reach calculated points and centroids. The K-means stage operates according to the specified equation 1, the form of an algorithmic flowchart, figure 7. The equation below shows the K-mean function.
J(V) =
778
i
i
v
x
is the Euclidean distance betweenx
i andi
v
,c
iis the number of points in i cluster,c
is the number of cluster centers.
Applying K-mean algorithm on CPM initial stage with different number of clusters, figure 8, it had a good effect on the choice of the number of clusters required for the CPM method for statistical measurements evaluation.
4. EXPERIMENTAL EVALUATION AND RESULTS
The CPM is tested on DIARETDB1 database which contain 89 images [23, 24], using MATLAB R2018a, windows 7. In order to evaluate CPM performance, according to true positive (TP), false positive (FP), False negative (FN) and true negative (TN), the following statistical measurement were used: sensitivity (S), specificity (SP), predictive value (PPV), and accuracy (A), equations (2-5), where Sensitivity=
FN
TP
TP
(2)Specificity=
FN
TN
TN
(3) PV=FP
TP
TP
(4) Accuracy=FN
TN
FP
TP
TN
TP
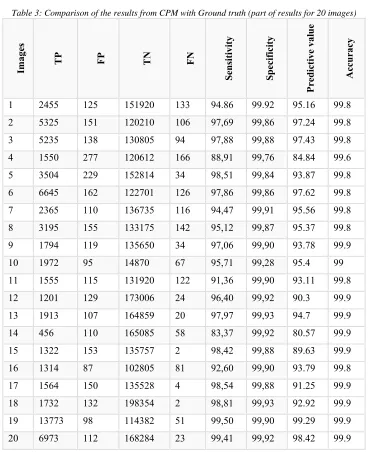
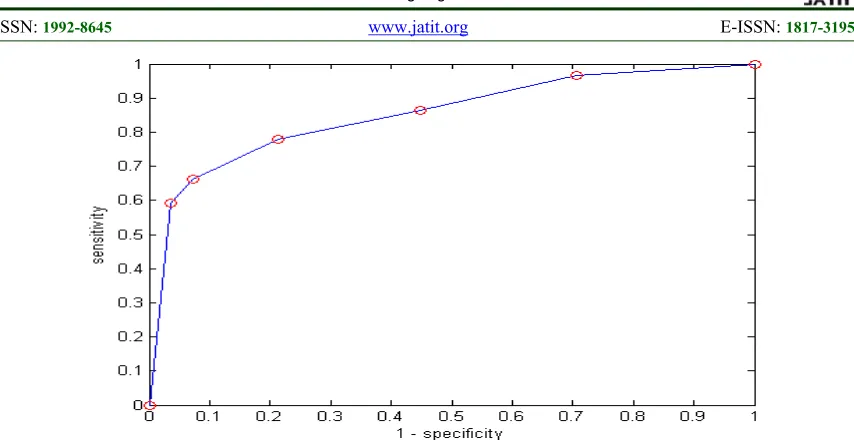
(5)The results obtained from TP, FP, FN, TN, sensitivity, specificity, predictive value, and accuracy versus ground truth database experts were shown in table 3. Sensitivity and specificity are also referred to as the true positive rate (TPR) and true negative rate (TNR), respectively these values were used to draw receiver operating characteristic (ROC) curve, figure 9. ROC was drawn with sensitivity against (1- specificity) statistical measures, it shows that the value of area under curve (AUC) is 0.90 which denoting a good diagnostic procedure, it covers the most important aspect of CPM performance evaluation.
5. CONCLUSIONS
Semi automatic method for exudates screening have been developed based on image processing techniques that utilize image quality and intensity gradients. DIARETDB1 diabetic retinopathy database was used to test the proposed method. The CPM used manual cropping technique to eliminate the optic disk, and remove the main part that makes confusion with exudates. The result of CPM is very promising and detects all the exudates in the image precisely. Future work on this method will be to develop automatic cropping for optic disc removing on the basis of the intensity value of pixel and image content.
REFRENCES:
[1] Somasundaram, K. and P.A. Rajendran,
Diagnosing and Ranking Retinopathy Disease Level Using Diabetic Fundus Image Recuperation Approach. The Scientific World
Journal, 2015. p. 1-9.
[2] Zhang, X., et al., Exudate Detection in Color Retinal Images for Mass Screening of Diabetic Retinopathy. Medical Image Analysis, 2014.
18(7): p. 1026-1043.
[3] J.Mohan, A. and M.J. Jayashree, Detection of Diabetic Retinopathy. International Research
Journal of Computer Science 2015. 2(10): p. 1-9.
[4] Bäcklund, L.B., Early Diagnosis of Diabetic Retinopathy by Mass Examinations in primary health care, in PhD thesis, Karolinska Institutet, Sweden. 2000.
[5] Kanski, J.J., Clinical Ophthalmology : A Systematic approach. 2003:
Butterworth-Heinemann Ltd.
[6] Sopharak, A., et al., Machine learning approach to automatic exudate detection in retinal images from diabetic patients. Journal of Modern
Optics, 2010. 57(2): p. 124-135.
[7] Ege, B.M., et al., Screening for diabetic retinopathy using computer based image analysis and statistical classification. Computer
Methods and Programs in Biomedicine, 2000.
62(3): p. 165-175.
[8] Liu, Z., C. Opas, and S.M. Krishnan. Automatic image analysis of fundus photograph. in Proceedings of the 19th Annual International Conference of the IEEE Engineering in Medicine and Biology Society. 1997. Chicago,
779 [9] Usher, D., et al., Automated detection of
diabetic retinopathy in digital retinal images: a tool for diabetic retinopathy screening. Diabetic
Medicine, 2004. 21(1): p. 84-90.
[10] Ram, K. and J. Sivaswamy. Multi-space clustering for segmetation of exudates in retinal color photographs. in Annual International Conference of the IEEE Enginnersing in Medicine and Biology. 2009.
[11] Osareh, A., et al. Automatic recognition of exudative maculopathy using Fuzzy C-Means clustering and neural networks. in Medical Image Understanding and Analysis. 2001:
BMVA Press.
[12] Basha, S. and K. Prasad, Automatic detection of hard exudates in diabetic retinopathy using morphological segmentation and fuzzy logic.
International Journal of Computer Science and Network Security, 2008. 18(12): p. 211-218. [13] Walter, T., et al., A contribution of image
processing to the diagnosis of diabetic retinopathy-detection of exudates in color fundus images of the human retina. IEEE
Transactions on Medical Imaging, 2002. 21(10): p. 1236-1243.
[14] Ward, N., S. Tomliivson, and C. Taylor, Image Analysis of Fundus Photographs: The Detection and Measurement of Exudates Associated with Diabetic Retinopathy. Ophthalmology, 1989.
96(1): p. 80-86.
[15] Shilpa, J. and P. Karule, A review on exudates detection methods for diabetic retinopathy.
Biomedicine & Pharmacotherapy, 2018. 97: p. 1454-1460.
[16] Leming, A.D., et al., Automated assessment of diabetic retinal image quality based on clarity and field definition. Investigative
ophthalmology & visual science, 2006. 47: p. 1120–1125.
[17] Teng, T., M. Lefley, and D. Claremont,
Progress towards automated diabetic ocular screening: A review of image analysis and intelligent systems for diabetic retinopathy.
Medical and Biological Engineering and Computing, 2002. 40: p. 2-13.
[18] Kaur, A. and P. Kaur, A Comparative Study of Various Exudate Segmentation Techniques for Diagnosis of Diabetic Retinopathy. 2016. 6(1):
p. 142-146.
[19] Eswaran, C., M. Saleh, and J. Abdullah.
Projection Based Algorithm for Detecting Exudates in Color Fundus Images. in The 19th International Conference on Digital Signal Processing. 2014. Hong Kong, China.
[20] Vincent, L. and P. Soille, Watershed in Digital Space: An Efficient Algorithm Based on Immersion Simulations. IEEE Transactions on
Pattern Analysis and Machine Intelligence, 1991. 13(6): p. 583-593.
[21] Catté, F., et al., Image Selective Smoothing and Edge Detection by Non Linear Diffusion. SIAM
Journal on Numerical Analysis, 1992. 29(3): p. 845-866.
[22] Rajput, G.G. and N.P. Preethi. Detection and Classification of Exudates Using K-Means Clustering in Color Retinal Images. in Fifth International Conference on Signal and Image Processing. 2014. South Korea.
[23] http://www.it.lut.fi/project/imageret/diaretdb1/.
780
[image:6.612.142.471.91.297.2]Figure 1: Color retinal image, zoom and manual illustration produced by an ophthalmologist
.
Figure 2: Smooth exudates abnormalities in diabetic retinopathy
Table 1: Exudates type and features
Lesion Type Size Edge Shape Color Smooth
Exudates From Small To Medium Blurry Edges Usually Oval-Shaped Whitish Solid Exudates From Small
[image:6.612.171.439.325.473.2]781
Table 2: Exudates detection approaches challenges and overcomes
Exudates segmentation category Challenge and overcome
Thresholding and region growing - Spatial illumination variation factors. - Threshold value selection.
- Exact thresholding criteria. Overcome:
- Contrast enhancement - Shade correction Morphology - Noise effect
- High computational time Overcome
- Noise reduction techniques - Mathematical morphology Clustering - Cluster number determination
- Retina optic disk confusion Overcome
- Optic disk cropping
- Region of interest pre-segmentation Classification - Low quality images
Overcome
- Image enhancement
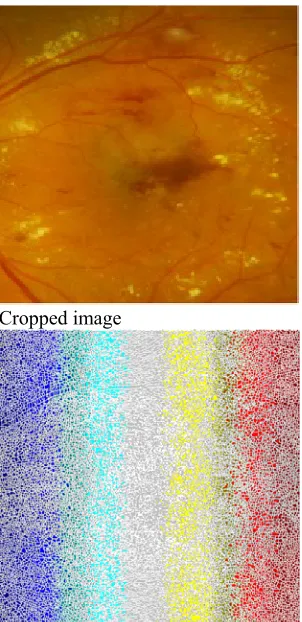
Original image Cropped image
782
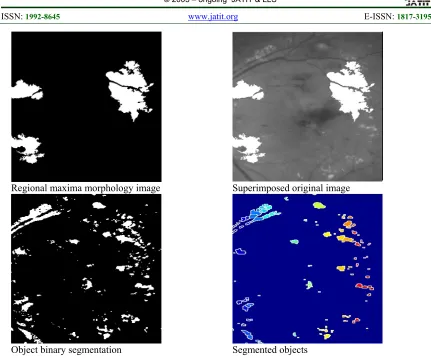
Regional maxima morphology image Superimposed original image
[image:8.612.89.520.62.420.2]Object binary segmentation Segmented objects
783
784
Watershed input Clustered image n=5
Clustered image n=4 Clustered image n=3
785
Table 3: Comparison of the results from CPM with Ground truth (part of results for 20 images)
Images TP FP TN FN
Sensitivi
ty
Specificity
Predi
cti
ve
v
al
ue
Accur
acy
786
[image:12.612.93.520.65.285.2]