5995
BALINESE PAPYRUS MANUSCRIPT IMAGE
SEGMENTATION USING DBSCAN CLUSTERING METHOD
1AYU WIRDIANI, 2SURYA SUKMA, 3OKA SUDANA, 4SUAR WIBAWA
123Departement of Information Technology, Udayana University, Bali, Indonesia
Email: 1 [email protected], [email protected], [email protected],
ABSTRACT
Papyrus Manuscript is handwritten in the form of an ancient script and written using Balinese script. Existence of Balinese Papyrus Manuscript in Balinese’s life is scarce. Today’s young generation almost left Balinese Papyrus Manuscript because of its complexity and difficult to understand. This traditional manuscript used Balinese Letters, which had some unique characteristics and patterns. This unique characteristic could identified using image processing technologies, which presented in this research. Segmentation on Balinese Papyrus Manuscript image is to get Balinese script letter object. The result of segmentation process would be used to helped recognized Balinese Letters by its features, with a computer-based application. Segmentation of the Balinese Papyrus Manuscript image used DBSCAN clustering method. This research consist of three steps. First step was image acquisition. The second step was image pre-processing. The last step was segmentation process using DBSCAN clustering method. The average success rate of segmentation process reached 78.8% with 21.2% error rate. The average of excecution time when the testing process reached 27.227 seconds.
Keywords: Balinese Papyrus Manuscript, Balinese Script, Image Segmentation, Clustering DBSCAN, Image
Acquisition.
1. INTRODUCTION
Technological advances bring some positive and negative impacts. Today’s young generation almost left some positive traditional cultures. This is one of the negative impact of technological advances. Young generation prefer to following the trend than reading a book or learning about traditional cultures. Indonesia is a state which has a variated traditional cultures, one of them is traditional literature. In Bali (a province in Indonesia) there are thousand traditional literature,
called Lontar (or Balinese Papyrus Manuscript).
In Bahasa, Manusript on a papyrus refers to
the word Lontar. The word Lontar is adopted from
phrases “ron” and “tal”, which has means a palm tree
(Borassus flabellifer or palmyra). Lontar was made
from a sheet of dried palm leaf (papyrus). The dried palm leaf then written on the surface of it. Balinese forefathers usually wrote a tale, knowledge, history, etc, on the papyrus. Balinese Papyrus Manuscript is one of important cultural inheritance from Balinese forefathers. Balinese Papyrus Manuscript contains theory and knowledge like history of civilization,
traditional-medical knowledge, macrocosmos and microcosmos knowledge, and so on. But in nowadays, exsistence of Balinese Papyrus Manuscript is scarce. Balinese Papyrus Manuscript slowly disappear, because young generation reluctant for sustaining this traditional manuscript. Balinese Papyrus Manuscript is rather difficult to created and understand.
Balinese letters have some unique characteristic and patterns. Almost all the Balinese letters have a curved patters. Some characteristic or features of Balinese leters is able to identified using image processing technique [1]. Character of Balinese script is obtained from the process of segmentation. Segmentation is a process that determines the character is obtained intact.
5996 The rest of this paper is organized as follows. Section 2 presents some previous studies about Balinese script image segmentation, capture of handwriting segmentation and clustering DBSCAN. Section 3 presents literature reviews about DBSCAN, data acqusition, pre-processing, HSV color space, thresholding, and image segmentation. Section 4 presents an overview of the Balinese Papyrus Manuscript segmentation system. Section 5 presents the result of the experiment process and some analysis about the result. Section 6 presents the conclusion and further work of this research.
2. RELATED RESEARCH
Segmentation of Balinese Scripts or another language scripts had been researched several times. In 2014, Made Sudarma and Ni Putu Sutramiani did a research with title “The Thinning Zhang-Suen Application Method in the Image of Balinese Script on the Papyrus”. They designed an application to studied the performance of Thinning Zhang-Suen method in Balinese script segmentation at Balinese Papyrus. Their research showed that segmentation using Thinning Zhang-Suen method could separate the script [2]
In 2015, I Gede Sunarya, Made Windu Antara Kesiman and Ida Ayu Putu Purnami did a research titled “Segmentation of Bali Script-Based Image Image Based on Vertical and Horizontal Projection”. This research provided a solution for recognizing balinese script from an image [3]
In 2008, Jonghyun Park, Toan Nguyen Dinh and Gueesang Lee did a research with title “Binarization of Text Region based on Fuzzy Clustering and Histogram Distribution in Signboards”. This research used Fuzzy C-Means clustering method. The object used in this research was the brand mark of some Korean and British boards. The research focused on how to detected the text area of the brand image using edge profile technique and continued with segmentation process using Fuzzy C-Means clustering technique. This research resulted that Fuzzy C-Means clustering technique was able to clusters each region that had been distinguished into text area (black) and background area (white) [4].
In 2015, Priyanka N Guttedar and Pushpalata S did a research titled “Scene Text Recognition in Mobile Application using K-Means Clustering and Support Vector Machine”. This research used K-Means Clustering method. The object used in this research was an image which was captured using a mobile-device camera. This study focused on the recognizing process of the image.
K-Means Clustering technique used for the segmentation process, to detected and recognized characters that were existed in the image [5].
In 2014, Shantala Giraddi, Jagadeesh Pujari and Shraddha Giraddi did a research with title “Exudates Detection with DBSCAN Clustering and Back Propagation Neural Network”. This research used DBSCAN (Density-Based Spatial Clustering of Application with Noise) and Back Propagation Neural Network method. This research used a Diabetic Retinopathy image. The research purposed to detected blood vessels in the retina. The DBSCAN (Density-Based Spatial Clustering of Application with Noise) and Back Propagation Neural Network techniques were combined to detect some signals of Diabetic Retinopathy disease in the patient's retina. There were two result from this research, those are wound-based accuracy and picture-based accuracy. Picture-based accuracy reached 100% in sensitivity, while the wound-based accuracy reached 92% in sensitivity [6].
In 2009, Fei Yin and Cheng-Lin Liu did a research titled “Handwritten Chinese Text Line Segmentation by Clustering with Distance Metric Learning. This research uses MST (Minimum Spanning Tree) Based Clustering Method”. The object used in this research was an image of Chinese writing scripts. The research focused on segment the line of handwritten text based on MST Clustering algorithm. This research resulted a good segmentation on every line of script, but some errors happend on some lines caused by error-spliting-line process and erroneus of combining text line into a cluster [7].
5997 The DBScan method also using in reseach with title "Segmentation of Images using Density-Based Algorithms". In this study presents a comparison between two algorithms Density Based Clustering (DBScan) and Mean Shift. The noise image is filtered using a median filter then clustered using the DBScan algorithm. Density-based Clustering algorithms are used to find the same spatial connectivity and pixel colors. This group will lead to the pixel partition and subsequently separate the noise points. Experimental results using the DBScan method show system accuracy and complexity much better than Mean Shift method [10].
Reseach from Andrea Mazzei is used DBScan method to segmentation handwritten annotations on printed documents. The proposed of their reseach is to classification automatically and to find classification accuracy. The result from this segmentation that DBSCAN effectively identify and handle the noise pixels [11]. The DBScan algorithm is also used by Jianbing Shen to segment complex object. In this paper described that DBScan can find arbitrily cluster. This method give a good result to segment object with complex and irregularity shape [12].
The DBScan method describes in the research above shown that the method has a good result in image segmentation. Therefore, in this reseach used Density-Based clustering method (DBScan) to segment the Balinese Papyrus Manuscript image.
3. LITERATURE REVIEW
Literature reviews of this research are presented as follows.
3.1 DBSCAN
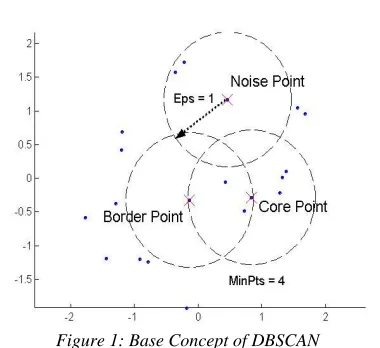
[image:3.612.322.512.90.264.2]Clustering in generally may applied in many kind of data processing such as data minning, statistic, biology and pattern recognition. Clustering is a process of dividing a large set of data into some cluster, based on their features. Epsilon refers to distance between each cluster and minimum points refers to the minimum amount of points from every clusters. The explanation of DBSCAN showed at Figure 1. There are two important cluster and noise in DBSCAN algorithm [13]. The two points in a cluster are core point and border point. Border point neighborhood should have less number of items than core point neighborhood. A few conditions explain that border point could be included into more than one clusters.
Figure 1: Base Concept of DBSCAN
3.2 DBSCAN Algorithm
Steps of DBSCAN algorithm is written as follows.
1. Select the p point randomly.
2. Get every density-reachable point to the p.
3. If the p is the core point, then cluster will be
formed.
4. When the p is a border point and is not
density-reachable, then DBSCAN will pick the next
point from the database.
5. The process is continued until every point are
processed.
6. The order of picking point will not affected the
result of DBSCAN process.
3.3 Euclidean Distance
DBSCAN calculate the radius of every point using Euclidean Distance. Euclidean distance is used for calculating squareroot between two vectors with this formula.
(1)
D is a radius between two objects, n is the amount of dimensions, xik and xjk is the k-data from the object i and j. Rules for determining the standard is needed if the scale is different. For an example, there are two vectors with features like this.
A = [0, 3, 4, 5] B = [7, 6, 3, -1]
Here is the distance calculation between vector A and vector B using euclidean distance.
𝑑
5998
√49 9 1 36 = 9.747
3.4 Data Acquisition
Data acquisition is a scanning process of an image through data modification from an analog to a digital form. Balinese Papyrus Manuscript is an analog data that need a scanner to scan it and get the image. The result of this process is a .bmp image. This image will be used as an input for pre-processing phase.
3.5 Preprocessing
Pre-processing is a process for enhancing the image quality. This enhancing process will increase the success rates of recognition. Preprocessing begins with the rotation process on Balinese Papyrus Manuscript image. In general, the scans of an object are not always symmetric between the corners. The automatic rotation function will change the angle (slope) if the image is not symmetrical. The basic principle of the automatic rotation process is to change the image projection over 360 degrees. The maximum value for the angle is 90 degrees. If the image has an angle more than 89 degrees or less than -89 degrees, then the angle value of the image will be set back 90 degrees. The Image that already processed in automatic rotation will be converted into HSV color.
3.5.1Color Map HSV
HSV color space represent Hue, Saturation and Value. Hue represent the true color of an object, like red, violet, and yellow. Hue can distinguish and determining colors from the light. Saturation is the original level of a color, and represent the amount of white color. Value is an attributes that represent the amount of lights receive by the eyes.
3.5.2Thresholding
Thresholding is the way to change a grayscale image to the binary image. Binary image will showed an explicit border between the object and the background. Thresholding is a segmentation technique using borders of an image [14]. This thresholding method use grayscale level to automatically get the threshold value. If a grayscale value less than or same with the threshold value, then it changed into 0. If a grayscale value more than the threshold, then it changed into 255.
3.5.3Image Segmentation
Segmentation is a technique to divided image into some areas. Each of areas has simillar attribute to the other. There are several segmentation
techniques like pixel-based, region-based,
boundary-based and clustering [15]. Cluster-based segmentation uses multidimentions data for groupping image pixels into some clusters. Pixels will be clustered based on their simillar radius.
4. System Overview
The main contribution of this paper are proposed DBScan algorithm can give an effective performance to segment the Balinese Papyrus Manuscript like describe in state of the art and by using DBScan algorithm can reduce time
computation.
This system had three main processes: data acquisition, pre-processing and image segmentation. Overview of the system was shown at Figure 2.
The first step was data acquisition. Data acquisition was a process which changed an analog balinese papyrus manuscript into a digital image by using a scanner. The image then saved into bmp extension. Next, the image was processed in the pre-processing process.
The second process was determining the color space using HSV method. The Value component from HSV color space is the most suitable componen for this system. The value component is capable of distinguishing object from the background.
The third process was pre-processing. If the .bmp image was not formed into binary image yet, then the image converted into the binary form, before processed in the pre-processing process.
5999
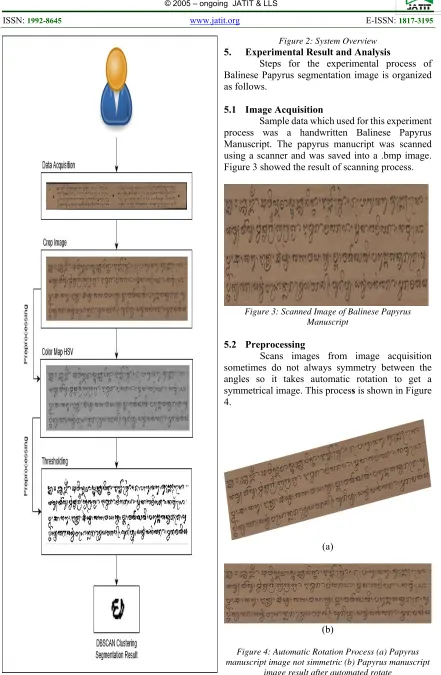
Figure 2: System Overview
5. Experimental Result and Analysis
Steps for the experimental process of Balinese Papyrus segmentation image is organized as follows.
5.1 Image Acquisition
[image:5.612.311.518.242.369.2]Sample data which used for this experiment process was a handwritten Balinese Papyrus Manuscript. The papyrus manucript was scanned using a scanner and was saved into a .bmp image. Figure 3 showed the result of scanning process.
Figure 3: Scanned Image of Balinese Papyrus Manuscript
5.2 Preprocessing
Scans images from image acquisition sometimes do not always symmetry between the angles so it takes automatic rotation to get a
symmetrical image. This process is shown in Figure
4.
(a)
(b)
Figure 4: Automatic Rotation Process (a) Papyrus manuscript image not simmetric (b) Papyrus manuscript
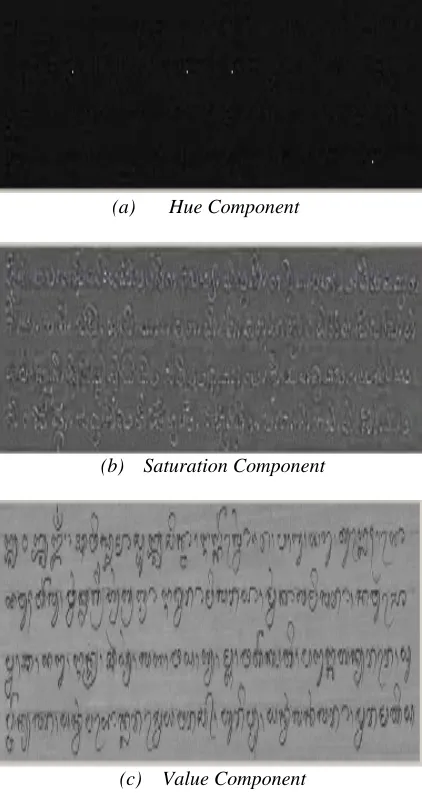
6000 The next process in preprocessing is to change RGB
color image to HSV color space.Hue, Saturation
and Value component represented colors space of
the image at Figure 5.
(a) Hue Component
(b) Saturation Component
(c) Value Component
Figure 5: HSV Color Space. (a) Hue Component, (b) Saturation Component, (c) Value Component
RGB color of the original image was changed into the HSV color. From Figure 4 shown the value component is the best result. The
thresholding process would used the Value component. The value component could helped to distinguished an object from it background.
5.3 Thresholding
[image:6.612.91.302.165.565.2]The value component of HSV color space would be used in Thresholding process. This Thresholding process produced an image which had explicit borders between the script and background, as shown at Figure 5.
Figure 5: Binary Image
The image of balinese papyrus had converted into a binary image, which was contained only black and white colors. This binary image then processed at the segmentation phase, using DBSCAN algorithm.
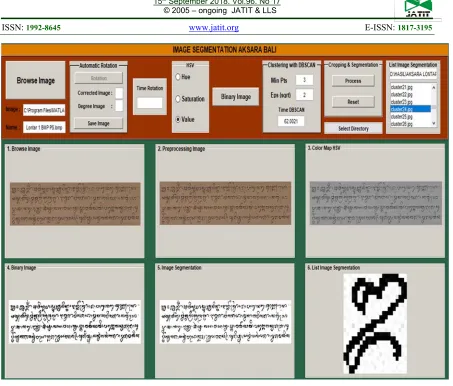
5.4 Image Segmentation and DBSCAN
Clustering
6001
Figure 6 : The Application of Balinese Papyrus Manuscript Image Segmentation
5.4.1 Result of Segmentation Process
(Lontar1.bmp)
This experiment used Lontar1.bmp file as input file. The value of minimum points (MinPts)
[image:7.612.56.558.524.745.2]and epsilon used were MinPts(3) and epsilon (sqrt 2). Table 1 showed the result of the segmentation.
Table 1 : Result of Segmentation of Lontar 1.bmp
No. Character No. Character No. Character No. Character No. Character
1 41 81 121 161
2 42 82 122 162
3 43 83 123 163
4 44 84 124 164
5 45 85 125 165
6 46 86 126 166
7 47 87 127 167
8 48 88 128 168
9 49 89 129 169
[image:7.612.56.564.525.745.2]6002
11 51 91 131 171
12 52 92 132 172
13 53 93 133 173
14 54 94 134 174
15 55 95 135 175
16 56 96 136 176
17 57 97 137 177
18 58 98 138 178
19 59 99 139 179
20 60 100 140 180
21 61 101 141 181
22 62 102 142 182
23 63 103 143 183
24 64 104 144 184
25 65 105 145 185
26 66 106 146 186
27 67 107 147 187
28 68 108 148 188
29 69 109 149 189
30 70 110 150 190
31 71 111 151 191
32 72 112 152 192
33 73 113 153 193
34 74 114 154 194
35 75 115 155 195
36 76 116 156 196
37 77 117 157 197
38 78 118 158 198
39 79 119 159 199
40 80 120 160 200
The number of segmentation result from the
6003 pixel between two characters. This experiment process used 3 image of Balinese Papyrus Manuscript. Variation of minimum points and epsilon at the experiment process were MinPts 2 and 3, and epsilon from 1 to 5. Experiment of
segmentation focused on MinPts (3) with epsilon (sqrt 2 and sqrt 3). Result of segmentation using 3 image of Balinese Papyrus Manuscript showed at Table 2.
Table 2 : Result of the Segmentation Using 3 Image
Objek Min Pts
Epsilon
Lontar1.bmp Lontar2.bmp Lontar3.bmp
2 3 2 3 2 3
Epsilon 1 288 246 395 328 323 280
Epsilon 2 214 199 236 213 203 191
Epsilon 3 214 199 236 213 203 191
Epsilon 4 185 176 202 184 173 164
Epsilon 5 161 154 170 159 152 143
Table 2 showed experiment result from the segmentation process, with combination of minPts 3 and 2, and epsilon 1 to 5. The number of segmentation resulted by those 3 image would be compared visually with the original Balinese Papyrus Manuscript. A comparison was made to found and calculated Balinese letters which is obtained between noises from segmentation results.
The number of characters in the first Balinese Papyrus Manuscript (Lontar1) was 217 characters, papyrus 2 was 217 characters and papyrus 3 was 208 characters. The number of characters found from the
[image:9.612.120.505.483.714.2]segmentation was 162 with 37 noises from first image (first Balinese Papyrus Manuscript), 173 characters with 40 noises from the second image, and 171 characters with 20 noises from the third image. The comparison between the number of characters found from the segmentation and the original Balinese Papyrus Manuscript would be calculated to find the success and error rate of DBSCAN algorithm. Comparison were performed on minimum points (3) with epsilon (sqrt 2) and epsilon (sqrt 3). Success and error rates of DBSCAN algorithm were showed in Table 3 and 4.
Table 3 : Success Rate of DBSCAN Algorithm
Object Lontar 1 = 217
Lontar 2 = 217 Lontar 3 = 208
Min Pts
Epsilon Lontar 1 Lontar 2 Lontar 3
3 3 3
Epsilon 2 162/217 x 100%
= 74,6% 173/217 x 100% = 79,7% 171/208 x 100% = 82,2%
Epsilon 3 162/217 x 100%
= 74,6%
173/217 x 100% = 79,7%
171/208 x 100% = 82,2%
Table 4: Error Rates of DBSCAN Algorithm
Object
Lontar 1 = 217 Lontar 2 = 217 Lontar 3 = 208
Min Pts
Epsilon Lontar 1 Lontar 2 Lontar 3
3 3 3
Epsilon 2 217 - 162/217 x
100% = 25,3%
217 - 173/217 x 100% = 20,2%
6004
Epsilon 3 217 - 162/217 x
100% = 25,3%
217 - 173/217 x 100% = 20,2%
208 - 171/208 x 100% = 17,7%
[image:10.612.88.530.70.123.2]Table 3 and Table 4 showed the success and error rates of the DBSCAN algorithm. All the two table above showed the clustering with MinPts 3 and
epsilon (sqrt 2) and epsilon (sqrt 3) resulted 78.8% of success rates and 21.1% of error rates.
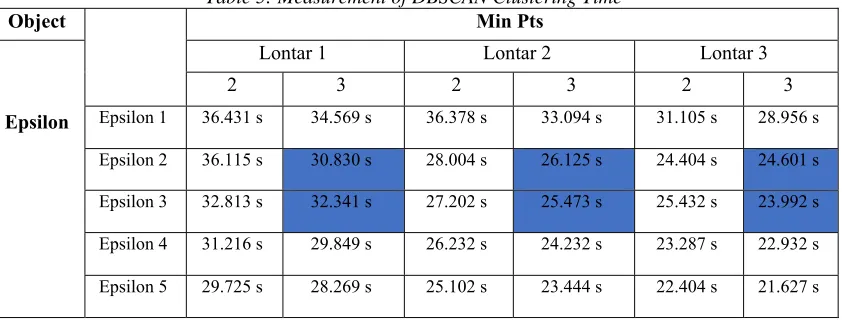
Table 5: Measurement of DBSCAN Clustering Time
Object Min Pts
Epsilon
Lontar 1 Lontar 2 Lontar 3
2 3 2 3 2 3
Epsilon 1 36.431 s 34.569 s 36.378 s 33.094 s 31.105 s 28.956 s
Epsilon 2 36.115 s 30.830 s 28.004 s 26.125 s 24.404 s 24.601 s
Epsilon 3 32.813 s 32.341 s 27.202 s 25.473 s 25.432 s 23.992 s
Epsilon 4 31.216 s 29.849 s 26.232 s 24.232 s 23.287 s 22.932 s
Epsilon 5 29.725 s 28.269 s 25.102 s 23.444 s 22.404 s 21.627 s
Table 5 was showed the time measurement of this experiment with minimum points (minPts) 2 and 3, and epsilon (eps) values from 1 to 5. This time measurement focused on the minimum points (3) with epsilon (sqrt 2) and epsilon (sqrt 3). The average execution time of testing process was 27.227 seconds.
The variation of execution time depended on the minimum points and epsilon used during the clustering process. The average success rates of the segmentation using DBSCAN was 78,8% with the error rate reached 2,1%. The average of execution time at testing process was 27,227 seconds. The success rates of the segmentation using DBSCAN was affected by usage of minimum points (3) with epsilon (sqrt 2) and epsilon (sqrt 3). Usage of epsilon (sqrt 2) and epsilon (sqrt 3) caused the DBSCAN algorithm found the closest distance between pixels in every iterations, and supported by the minimum points (3) for the cluster’s formed process, thus could resulted a better segmentation.
6. CONCLUSIONS
Balinese Papyrus Manuscript image segmentation is needed as a preliminary process to get Balinese script character that will be used in further process. This Applications consist of three steps, there were data acquisition, preprocessing and segmentation process using DBScan method. The average success rates of the segmentation using DBSCAN was 78,8% with the error rate reached 2,1%. The average of execution time at testing process was 27,227 seconds. The success rates of the segmentation using DBSCAN was affected by usage of minimum points (3) with epsilon (sqrt 2) and epsilon (sqrt 3). Usage of epsilon (sqrt 2) and epsilon (sqrt 3) caused the DBSCAN algorithm found the closest distance between pixels in every iterations, and supported by the minimum points (3) for the cluster’s formed process, thus could resulted a better segmentation. Pre-processing process really affected to the success rates of segmentation using DBSCAN algorithm. Handwriting type and the form of the script on the Balinese Papyrus manuscript were really influence the segmentation process.
REFERENCES
[image:10.612.98.519.187.349.2]6005
Aksara Bali dengan Metode Kurva,”
e-Journal Lontar Komputer, vol. 5, no. 1, pp.
382–391, 2014.
[2] M. Sudarma and N. P. Sutramiani, “The
Thinning Zhang-Suen Application Method in the Image of Balinese Scripts on the
Papyrus,” International Journal Computer
Application, vol. 91, no. 1, pp. 9–13, 2014.
[3] I. M. G. Sunarya, M. W. A. Kesiman, and I.
A. P. Purnami, “Segmentasi Citra Tulisan Tangan Aksara Bali Berbasis Proyeksi
Vertikal dan Horizontal,” Jurnal
Informatika, vol. 9, no. 1, pp. 982–992, 2015.
[4] J. Park, A. Toan Nguyen Dinh, and G. Lee,
“Binarization of Text Region based on Fuzzy Clustering and Histogram Distribution in
Signboards,” International Journal
Computer, Electrical, Automation, Control
and Information Engineering, vol. 2, no. 7,
pp. 85–90, 2008.
[5] P. N. Guttedar and P. S, “Scene Text
Recognition in Mobile Application using K-Mean Clustering and Support Vector
Machine,” International Journal Advance
Res. Comput. Eng. Technol., vol. 4, no. 5, pp.
2492–2498, 2015.
[6] S. Giraddi, Jagadeesh Pujari, and S. Giraddi,
“Exudates Detection with DBSCAN Clustering and Back Propagation Neural
Network,” International Journal Computer
Application, vol. 86, no. 19, pp. 16–20, 2014.
[7] F. Yin and C. L. Liu, “Handwritten Chinese
text line segmentation by clustering with
distance metric learning,” Pattern
Recognition, vol. 42, no. 12, pp. 3146–3157,
2009.
[8] K. R. Shah and D. Dattatray Badgujar,
“Devnagari handwritten character
recognition (DHCR) for ancient documents:
A review,” in 2013 IEEE Conference on
Information and Communication
Technologies, ICT 2013, 2013.
[9] Q. Y. Q. Ye, W. G. W. Gao, and W. Z. W.
Zeng, “Color image segmentation using
density-based clustering,” 2003 IEEE Int.
Conf. Acoust. Speech, Signal Process. 2003.
Proceedings. (ICASSP ’03)., 2003.
[10] A. Dhua, D. N. Sarma, S. Singh, and B. Roy,
“Segmentation of Images using
Density-Based Algorithms,” International Journal of
Advanced Research in Computer
Engineering & Technology (IJARCET), vol.
4, no. 5, pp. 273–277, 2015.
[11] A. Mazzei, F. ´ eric Kaplan, and P.
Dillenbourg, “Extraction and Classification
of Handwritten Annotations,” ACM, 2010.
[12] J. Shen, X. Hao, Z. Liang, Y. Liu, W. Wang,
and L. Shao, “Real-Time Superpixel Segmentation by DBSCAN Clustering
Algorithm,” IEEE Trans. IMAGE Process.,
vol. 25, no. 12, pp. 5933–5942, 2016.
[13] C.Kondal raj, “Comparison Of K Means, K
Medoids, Dbscan Algorithms Using Dna
Microarray Dataset,” International Journal
of Computational and Applied Mathematics,
vol. 12, no. 1, pp. 344–355, 2017.
[14] E. N. Kaur and E. R. Kaur, “A review on
various methods of image thresholding,”
International Journal on Computer Science
and Engineering (IJCSE), vol. 3, no. 10, pp.
3441–3443, 2011.
[15] I. K. Ariana, R. S. Hartati, I. K. Gede, D.
Putra, N. Kadek, and A. Wirdiani, “Color Image Segmentation using Kohonen
Self-Organizing Map ( SOM ),” International
Journal of Engineering and Technology
(IJET), vol. 6, no. 2, pp. 865–871, 2014.