TOWARDS AN AUTOMATIC EVALUATION OF UML
CLASS DIAGRAMS BY MEASURING GRAPH SIMILARITY
1
ANAS OUTAIR, 2MARIAM TANANA, 3ABDELOUAHID LYHYAOUI
1
National School of Applied Science, Tangier, MOROCCO
E-mail: [email protected], [email protected],[email protected]
ABSTRACT
We discuss in this article, the problem of analyzing the student's productions during the construction of a UML class diagram from textual specifications. The main objective is to propose a method for evaluating the diagrams built by students in an automatic way. To reach this goal, we have to analyze student productions, and we study the work related to processing, matching, similarity measure and comparison of several UML graphs. From this study, we adopted a method based on the comparison and matching components of several UML diagrams. This proposal is applied to assess the UML class diagrams and focuses on the structural and semantic aspects of the UML graph to match
Keywords: Learner assessment, UML class diagram, UML graphs matching, similarity measure.
1. INTRODUCTION
The learning assessments occupy a very important place in the education. The knowledge acquired by the students can be tested by the teacher in the form of a:
• Formative assessment or diagnostic testing is a
range of formal and informal assessment procedures employed by teachers during the learning process in order to modify teaching and learning activities to improve student attainment [19];
• Summative assessment is commonly used to
refer to assessment of educational faculty with the object of measuring all teachers on the same criteria to determine the level of their performance [20].
Bloom's taxonomy identifies three main learning domains: cognitive, affective and psychomotor. The cognitive domain describes the knowledge and the development of the intellectual abilities and skills (knowledge and know-how), the affective domain describes the aptitudes or self-management skills, and the psychomotor domain describes the physical and motor abilities. In what follows, we are interested in the cognitive domain since it is the most requested at the time of the establishment of learning objectives in the educational system [21].
UML is one of the most important courses in higher education, and modeling Object Oriented which aims to understand the models of design concepts in the different phases of the software
development cycle [1]. In the UML class diagram,
the implementation of case studies is necessary for a good understanding of the basic notions of the UML design and modeling. The students have to conceive these case studies. The teacher’s work will consist at evaluating the obtained results. It is a tedious task because the correction of an UML class diagram created by a student is difficult to understand, especially if there are several possible solutions. Since UML does not provide the methodology for modeling, the students have difficulties during the construction of a class diagram [2]. When students construct an UML diagram, which has several solutions, it might be presented in different ways and point of views. The main objective of this thesis is to propose a method for automatic analysis of diagrams of the learner in the modeling business environment conducted by students.
This method should be independent for educational needs, to ensure some generic so that the results can be used to produce synchronous feedback for Human Learning. To meet this goal,
we want to investigate existing learning
environments for modeling and analysis of student productions and finally the relating works on transformation, matching and similarity measure. From this study, we adopted the principle to design a tool based on the comparison and matching components of several diagrams.
containing a teacher’s class diagram and a student’s class diagram. The third section represents the difference between the diagrams. The fourth section describes the representation of UML class diagram in UML graph. The fifth part concerns related techniques of matching. The sixth section describes the proposed method for comparing and measure similarity of UML graph.
2. UML CLASS DIAGRAM EXAMPLES
In the UML courses, class diagrams are often modeled by students from text specifications. Next, the teacher has to assess these diagrams by comparing them by reference diagrams; this comparison can deduce two problems?
• The same semantics but they are
structurally different.
• The same structure but they differ
semantically.
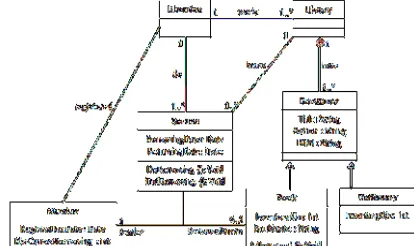
[image:2.612.98.305.397.520.2]Otherwise, we may be confronted with several possible solutions. To work around this problem, we have to compare the class diagram student’s with several references of class diagrams. Thereafter, we illustrate an example from a case study on “Library management”.
[image:2.612.68.277.562.694.2]Figure 1 class diagram reference (teacher's correction).
Figure 2 class diagram of the student.
For this paper, we will use a single reference diagram of the teacher (figure 1) that we will compare to those students (figure 2).
3. EXTRACTING DIFFERENCE
DIAGRAMS BETWEEN
The differences that we built from a manual comparison of student's diagram with a reference diagram for the exercise of our case study. The differences are grouped into eight categories:
Omission of an element: the student has omitted an element of the teacher class diagram;
Adding the element: The student added in this diagram an element that is not represented in the teacher class diagram. Transfer of an element: an element has been moved. For example an attribute of class "A" in the teacher class diagram is displaced by the student to the class "B"; Duplication of an element: an element of the teacher class diagram is shown in the class diagram of the student by several elements of the same type;
Fusion of elements: several elements of the same type are represented in the student class diagram by a single element;
Reversing the direction of a relationship: the sense of a relationship (inheritance, aggregation or composition) was reversed by the student.
The detected differences of modeling and
representation are significant (Figure1 and
Figure2). Class “Librarian” is not represented, nor its association relationships with class “library” and
class “member”. Association class is not
represented, nor do its attributes, its operations and its association relationships with class “Library” and ‘Librarian’. A composition relationship connects the classes "Library" and "Document" instead of an aggregation relationship, and its orientation is reversed. An association relationship "registered" is inserted between the classes "Member" and "Library", while it should be inserted to connect the class "Member" with the class "Librarian". The direction of the inheritance relationship between the classes "Document" and "Book" is reversed. The multiplicity of the association end "0..2" of the class "Book" is replaced by "1..*".
diagram is incomplete; he omitted to represent some elements of the diagram. These omissions are for instance the absence of a class which implies that the attributes, operations and relations that connect them to other classes in the diagram are also absents. It may be that the student has omitted to represent attribute inherited by subclasses of the super class, then these classes will also be incomplete. However, the insertion of an element or relationship in the diagram constructed by the student refers to the fact that he did not respect the case study, or that he made a mistake. Table 1 illustrates an example of general differences between the teacher’s class diagrams and the student’s class diagram.
Table 1: The differences between two class diagrams
Differences noted by the
teacher
Feedback
Omission {Librarian}
Omission of class and elements associated with this
class Omission {works
(Librarian Library)} Omission {registered (Librarian
Member)} Omission {Borrow}
Omission of association Omission {do
(Librarian
Borrow)} class and elements
associated with this association class Omission {know
(Library Borrow)} { have (Library Document) } REVERSE { have (Document
Library) }
Reversing the direction of a aggregation relationship
{ Dictionary Document} REVERSE { Document Dictionary) }
Reversing the direction of a generalization relationship
Those differences have been done
manually, if we want to do it automatically or semi-automatically, it will be difficult with the graphic form of these diagrams. Thereafter, we would like to represent it in an easier and handle able format. Indeed, the class diagrams contain several links between classes and each class has several attributes or operations. Links can be of different types (combination of inheritance, aggregation, composition and simple association) and be labeled differently (role, multiplicity, and navigability) [3].
We have shown in this section that the solution produced by the student does not automatically infer whether the student develops the correct or erroneous constructions in relation to the case study requested. The use of a valid solution or several solutions defined by a teacher's necessary for a system to be able to automatically analyze student productions. Oversights and errors that the student commits are identified from a diagram constructed. At a more general level, the problem of comparison of several different models created by students has been studied outside of a learning environment. This problem is similar to a model matching process, which is why we present the model matching problem and the classical approaches that
have been developed to treat it.
4. UML CLASS DIAGRAMS INTO AN UML
GRAPH
We have described some differences between two UML class diagrams analyzed during the design of a case study. In the discussed learning environment, the models developed by students during a modeling activity are class diagrams graphics. In this section, we examine some possible representations of the UML class diagram. We propose a graphical representation of this case study. Then we focus on how UML class diagrams can be represented as graphs in particular to be saved and analyzed by computer systems.
4.1 Definition of graph matching
We present the representation of the class diagram of the case study “library management”. Based on the extract of the meta- model, we can
transform aclass diagram to an UML graph where
all the elements and their direct links are made explicit by means of vertices and edges [4].
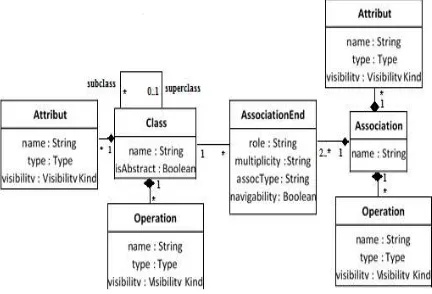
[image:3.612.318.534.567.714.2]The meta-model in Figure 3 shown the representation of the majority of elements (class,
associations, attributes, and operation for
association) is vertices of the graph. Edges are inheritances, and relationships between various elements. A class (vertex) has attributes (vertices) that can be typed by classes. Associations (vertices) have association ends (vertices) which can be typed by classes (vertices). Vertices and edges are characterized by labels representing their attributes and operations (name, visibility, type), their association ends (role, multiplicity, type of association, navigability).This representation is semantically equivalent with the class diagram, and naturally meets the requirements described in the UML meta-model [5].
4.2 Meta-model of class diagram
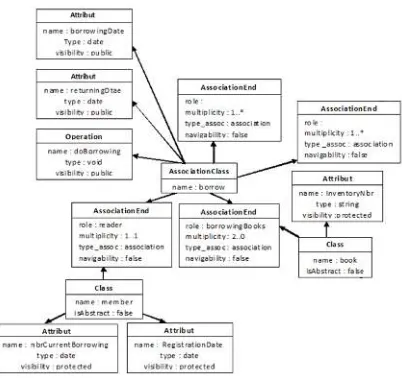
[image:4.612.93.294.440.629.2]The Figure 4 shows the UML graph of library management. The graph representation clearly expresses links of their elements and of their characteristics in the UML diagrams. Each edge connects several nodes and has a direction. Vertices and edges are characterized by labels representing their attributes and operations (name, visibility, type), their association ends (role, multiplicity, type of association, navigability). This representation is semantically equivalent with the class diagram, and naturally meets the requirements described in the UML meta-model.
Figure 4: Representation of class diagram in the form of an UML graph
The figure 4 shows a part of the class diagram modeled for the case study "Library Management". A graph is represented as XML Metadata Interchange (XMI) [4]. The nodes are elements UML classes, attributes, operations and association relations that compose it. The inheritance
relationships related to their parent classes. The association ends are connected either by association relations or related classes.
We presented an UML class diagram into a graph. In the next section, we will now interest in the methods of comparison and similarity of graphs.µ
5. MATCHING METHOD
We present in this section, the definitions of the matching method in the context of graphs. The choice of a technique or set of techniques for matching problem can share approaches and criteria
[6]. We present several dimensions and
classifications to clearly define key concepts, characteristics and criteria used in the graph matching techniques. Finally we end with some special matching approaches combining several techniques.
5.1 Definition of graph matching
Graph matching plays a central role in solving correspondence problems in computer vision. Graph matching problems that incorporate pair-wise constraints can be cast as a quadratic assignment problem [7]. Matching graph labeled is finding semantic correspondences between two graphs [8]. The matching can be considered as an operation or an operator which takes two graphs as input and produces a mapping between the elements of two graphs corresponds semantically to each other [9]. The graph matching problems consisting in mapping the vertices of two graphs, the objective being to compare the objects modeled by graphs.
5.2 Matching method and result
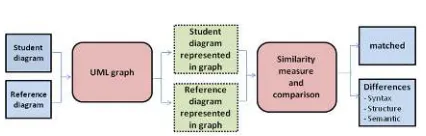
The inputs of our matching method are UML graphs; we will assess similarities and comparisons to provide as output an alignment and differences between these inputs. This matching method is adapted to the level of analysis UML graphs and their development in the context of learning of object-oriented modeling. It compares and matches the structure of several UML graphs inputted by focusing on numerous descriptive
dimensions of UML elements and their
organization in UML class diagrams. We defined in the figure 5 the matching method that takes as input UML class diagrams and returns a mapping and differences syntactic, structural and semantic between the student's diagram and teacher’s
Figure 5: Comparison and matching
The matching result may associate one or more elements of the first UML graph to one or more of the other UML graph, and vice versa. Cardinality
relationships between paired elements are
introduced to describe the matching products. Cardinality relationships correspond to four scenarios:
1: 1 (one element associated with an element) ; 1: n (an element associated with n elements); n: 1 (n elements associated with an element); m: n (m elements associated with n elements).
The comparison of several elements is based on the evaluation of their similarities and their differences. Measuring the similarity of two elements is to identify commonalities thus the distance measure between two elements is the identification of the differences. So the distance and similarity are two concepts that refer to a common goal. The calculation of the distance or similarity of two graph structures allows you to find the best of vertices of a graph, that is to say the one that preserves the most characteristic vertices and edges [10].
In the next section, we will present the similarity measure and comparison.
6. SIMILARITY MEASURE AND
COMPARISON
We studied the existing approaches of the parameterized distance measurement depending on the type of graph to match for different graph matching problems. This measure of similarity between two UML graphs is based on their common characteristics throughout all their characteristics, to calculate the similarity of each vertices and arcs [11].We recall that a graph is a data structure used in particular to model objects in terms of components (called vertices) and binary relations between components (called arcs). A multi digraph is a directed graph which is permitted to have multiple arcs, i.e., arcs with the same source
and target nodes. A multi digraph G is an ordered pair G= (V, A) with:
V is a set of vertices. A multi set of
ordered pairs of vertices called directed
edges, arcs or arrows.
A labeled multi digraph G is a multi graph with labeled vertices and arcs. A labeled graph is a directed graph such that vertices and edges are associated with labels. Without loss of generality, we shall assume that every vertex and edge is associated with at least one label: if some vertices (resp. edges) have no label, one can add an extra anonymous label that is associated with every vertex (resp. edge) [19]. More formally, given a finite set of vertex labels LV , and a finite set of
edge labels LE, a labeled graph will be defined by a
triple G =( V, RV , RE) such that:
V is a finite set of vertices. RV ⊂ V x LV is
the relation that associates vertices with labels, i.e., RV is the set of couples (vi , l) such that vertex vi
has label l. RE ⊂ V x V x LE is the relation that
associates edges with labels, i.e., RE is the set of
triples (vi , vj , l) such that edge (vi , vj) has label l.
Note that from this edge relation RE, one can define
the set E of edges [12].
The similarity of two graphs G and G 'with respect to a mapping m vertices and arc is defined by:
The function f weighted characteristics of graphs G and G '. The split function calculates the set of m bursts. The function g weights these bursts. The two functions f and g are customizable to the needs of the application. The maximum similarity sim (G, G ') of two graphs G and G' is the best pairing of vertices and m arcs.
6.1 UML graph elements
Our approach are matching and detecting differences between two UML graphs. In this case we have to detect the elements in the first UML graph that have a corresponding element in the second one [13], [14], [15].
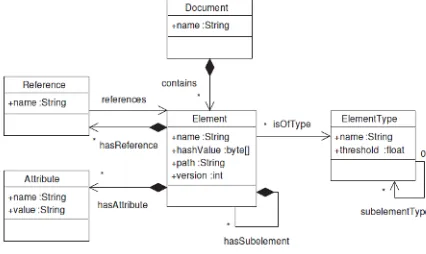
An Attribute features name and value pairs. For example a class has an Attribute ’visibility’ with values ’public’, ’private’ or ‘protected’. An Element can be composed of sub elements, for examples classes contain attributes and operations and operations contain parameters. An association features two association ends that both have a Reference referring to a class element [16].
Figure 6: UML graph elements
6.2 UML graph elements
The similarity measure of two elements of the same type is performed by a function of configurable similarity calculating a similarity score, positive and returns a value between 0 and 1, with a set of criteria including internal and external structures and types of the compared pair elements. Each value calculated on a weighted criterion. If criteria have a high weight, there will be an increase on the total measuring similarity. The total similarity value is calculated by the following formula [17]:
• and are the elements to be compared;
• C is the set of criteria;
• gives the weight of criteria c ;
• is the compare function for criteria
c.
The calculation of the similarity measure is an NP-hard problem. The combinatorial explosion makes the methods fully investigated. The algorithms of the measure we have just presented is incomplete but can be easily adapted to many calculations of similarity measure and distance. We present these two algorithms in order of increasing complexity. Greedy algorithm: non-deterministic polynomial weakly. It returns a locally optimal matching and can be run several times to return the
best match found. It starts from an empty matching and iteratively adds pairs of vertices selected from the group of candidates until the addition of any other couple cannot increase the similarity. At each stage, the couple to be added is selected randomly from all couples is increasing most similarity. An algorithm is based on a reactive Tabu local search to improve a current solution exploring its neighborhood. Starting from an initial pairing, a local research explores the search space by moving from neighbor neighbor until the optimal solution. The neighbor that maximizes the similarity is always selected first. A Tabu list is used to store the last k moves made to prohibit reverse movements in k iterations and so do not stay around a local maximum still achieving the same movements.
[image:6.612.94.307.190.317.2]Besides the similarity function the threshold defines the minimum similarity value to consider two elements as similar. Actual criteria, weights and the threshold for comparing elements of classes are shown in table 2. The complete table with the criteria for comparing class diagrams can be found in [18]. The similarity of string attributes is calculated by using the text comparing algorithm LCS. The ratio of similar or matched operations and attributes can be easily calculated by counting the sub elements that already match or summing up their similarity values. For the generalization or package criteria the matching of the referenced elements has to be considered.
Table 2: Criteria for comparing class elements
7. CONCLUSION
This paper focused of methods and techniques on UML class diagrams, namely matching graph and similarity measures. The graph matching problem is complex and can be approached from various techniques and algorithms. It is apparent that the use of a single technique is not satisfactory to meet the matching problem of graphs. The use of several techniques and several matching increases the calculations and therefore the time to produce
Element Type
threshold Criterion weight
Class 0,5
Similarity of the class names Ratio of similar or matched operations
Ratio of similar or matched attributes
0,4 0,3 0,3
Association 0,5
Similarity of the
alignment, but requires thinking about how they will be combined and configured. The main entrances of graph matching systems are directed acyclic graphs whose alignment of the components will be identified. Auxiliary data in addition to the graphs will facilitate the matching process by clarifying semantic graphs and allow in some cases to remove ambiguities and to direct or accelerate the process. Correspondence of the proposed alignment by a matched graph system focused on the similarities and usually qualified by a semantic equivalence relation or a real score between 0 and 1. The semantic relationships are more advanced in the semantic matching techniques. In the studied techniques, we note that the matching problem is difficult to treat automatically by the system. The intervention of a human operator may be required. In addition, the result produced is processed by a domain expert to check its relevance. The approaches proposed in the area are mostly semi-automatic. As future work, information Measure of similarity, such as inheritance, should be treated, and results in the future article should be studied using more case studies.
REFRENCES:
[1] OMG, OMG Unified Modeling Language
Specification, Version 1.5, Object Management
Group, Inc., Framingham, MA, , March 2003, <http://www.omg.org>.
[2] Object Management Group, Unified Modeling
Language™, 2009, UML® Resource Page,
http://www.uml.org/.
[3] P. Bottoni, M. Minas, “Workshop on Graph
Transformation and Visual Modeling
Techniques”, Springer-Verlag: Proceedings of
the First International Conference on Graph Transformation, London, UK, 2002, pp. 445– 449.
[4] A. Outair, A. Lyhyaoui, and M.Tanana, “Towards an Automatic Evaluation of UML Class Diagrams by Graph Transformation”,
International Journal of Computer
Applications, Vol. 95, No. 21, 2014.
[5] Object Management Group, Catalog of OMG
Modeling and Metadata Specifications - XML
Metadata Interchange (XMI®), 2009,
http://www.omg.org/spec/XMI/2.5.1/PDF. [6] E. Rahm and P. A. Bernstein, “A survey of
approaches to automatic schema matching”, The
international Very Large DataBases Journal (VLDB Journal) Springer Berlin / Heidelberg, Vol. 10, No 4, 2001, pp. 334-350.
[7] H.-H. Do and Rahm E., “Matching Large
Schemas: Approaches and Evaluation”, In: the
Journal on Information Systems, Vol. 32, No 6, 2007, pp. 857-885.
[8] E. M. Loiola, N. M. De Abreu, P. O. Boaventura, P. Hahn, and T. M. Querido, “A Survey for the Quadratic Assignment Problem”,
European Journal of Operational Research,
2007.
[9] S. Sorlin, C. Solnon and J.-M. Jolion, “A Generic Graph Distance Measure Based on
Multivalent Matchings”, In: Applied Graph
Theory in Computer Vision and Pattern Recognition, 2007, pp. 151–182.
[10] S. Sorlin, and C. Solnon, "Reactive tabu search for measuring graph similarity. Graph-Based
Representations in Pattern Recognition”.
Springer Berlin Heidelberg, 2005, pp. 172-182. [11] S. Sorlin, “Measure the similarity of graphs”,
Laboratory for Computer Science Thesis in
the Image and Information Systems,
University Claude Bernard Lyon 1 (France),
2006, pp. 142.
[12] Diestel and Reinhard, “Graph Theory”,
Springer; 2nd edition, ISBN 0-387-98976-5, February 18, 2000.
[13] H.-H. Do, S. Melnik and Rahm E., “Comparison of Schema Matching evaluations”,
In: Web, Web-Services, and Database Systems, NODe 2002 Web and Database-Related
Workshops, Springer Berlin / Heidelberg,
Erfurt, Germany, October 7-10 2002, Revised Papers,LNCS 2593, 2003, pp. 221-237.
[14] Dirk Ohst, Michael Welle, and Udo Kelter, “Differences between Versions of UML
Diagrams”, In ESEC/FSE’03, Helsinki, Finland,
September 1-5, 2003.
[15] Jungkyu Rho and Chisu Wu. “An Efficient
Version Model of Software Diagrams”, In Proc.
5th Asia-Pacific Software Engineering Conf, in Taipei,Taiwan, ROC. IEEE Computer Society, 2-4 December, 1998.
[16] Albert Z¨undorf, J¨org Wadsack, and Ingo
Rockel. “Merging Graph-Like Object
Structures”. In Andre van der Hoek, editor,
Tenth International Workshop on Software Configuration Management (SCM-10) New
Practices, New Challenges, and New
Boundaries, Toronto, Canada (ICSE workshop),
May 14-15, 2001, http://www.ics.uci.edu/ andre/ scm10/.
[17] Marcus Alanen and Ivan Porres. “Difference
for Computer Science, April 2003, Technical Report 527.
[18] Kelter, U., Wehren, J., & Niere, J. (2005). “A Generic Difference Algorithm for UML
Models”, Software Engineering, Vol. 64, No
105-116, 2005, pp. 4-9.
[19] Cowie, Bronwen, and B. Bell, A model of
formative assessment in science
education. Assessment in Education: Principles, Policy & Practice, vol. 6, no 1, p. 101-116, 1999.
[20] C. Hadji, L’évaluation démystifiée. ESF, 2 édition. Pages 126, 1999.
[21] Bloom, Taxonomy of educational objectives:
The classification of educational goals.