© 2016, IRJET | Impact Factor value: 4.45 | ISO 9001:2008 Certified Journal
| Page 642
FEM ANDEXPERIMENTATION ANALYSIS COMPOSITE
MATERIALOF MONO LEAF SPRING
Mr.Rathod Jairam C.
1,Prof.Gaur Abhay Singh V.
2PG Student,Mechanical Engineering,BMIT Solapur,Maharashtra,India
PG Guide Mechanical Engineering,BMIT Solapur,Maharashtra,India,
---***---
Abstract
This project describes design and experimental analysis of composite leaf spring made of glass fiber reinforced polymer. The objective is to compare the load carrying capacity, stiffness and weight savings of composite leaf spring with that of steel leaf spring. The design constraints are stresses and deflections. The dimensions of an existing conventional steel leaf spring of a light commercial vehicle are taken. Same dimensions of conventional leaf spring are used to fabricate a composite multi leaf spring using- Glass/Epoxy unidirectional laminates. Static analysis of 2-D model of conventional leaf spring is also performed using ANSYS 10 and compared with experimental results. Finite element analysis with full load on 3-D model of composite multi leaf spring is done using ANSYS 10 and the analytical results are compared with experimental results. Compared to steel spring, the composite leaf spring is found to have 67.35% lesser stress, 64.95% higher stiffness and 126.98% higher natural frequency than that of existing steel leaf spring. A weight reduction of 76.4% is achieved by using optimized composite leaf spring. The Automobile Industry has shown increase interest for replacement of steel leaf spring with that of composite leaf spring, since the composite material has high strength to weight ratio, good corrosion resistance and tailor-able properties. The paper describes static analysis of steel leaf spring and laminated composite Multi leaf spring. The objective is to compare the load carrying capacity, stiffness and weight savings of composite leaf spring with that of steel leaf spring. The dimensions of an existing conventional steel leaf spring of a Light design calculations. Static Analysis of 3-D model of conventional leaf spring is performed using ANSYS 11.0 using ANSYS 10 and compared with experimental results. Finite element analysis with full load on 3-D model of composite multi leaf spring is done using ANSYS 10 and the analytical results are compared with experimental results. Compared to steel spring, the composite leaf spring is found to have 67.35% lesser stress, 64.95% higher stiffness and 126.98% higher natural frequency than that of existing steel leaf spring. A weight reduction of 76.4% is achieved by using optimized composite leaf spring. The Automobile Industry has shown increase and hyper mesh. Same dimensions are used in composite multi leaf spring using carbon/Epoxy and Graphite/Epoxyuni directional laminates. The load carrying capacity, and weight of composite leaf spring are compared with that
of steel leaf spring
Key Words:
Composite materials, design constrains, leaf spring, material property, static ANSYS
1.FEA USING ANSYS
1.1INTRODUCTION
ANSYS is finite element analysis software which enables engineers to perform the following tasks:
Build computer models or transfer CAD models of structures, products, components, or systems.
Apply operating loads or other design performance conditions.
Study physical responses, such as stress levels, temperature distributions, or electromagnetic fields.
Optimize a design early in the development process to reduce production costs.
Do prototype testing in environments where it otherwise would be undesirable or impossible (for example,
© 2016, IRJET | Impact Factor value: 4.45 | ISO 9001:2008 Certified Journal
| Page 643
The ANSYS program has a comprehensive graphical user interface (GUI) that gives users easy, interactive access
to program functions, commands, documentation, and reference material. An intuitive menu system helps users navigate through the ANSYS program. Users can input data using a mouse, a keyboard, or a combination of both.
1.2Meshing in ANSYS:-
The default mesh controls that the ANSYS program uses may produce a mesh that is adequate for the model you are analyzing. In this case, you will not need to specify any mesh controls. However, if you do use mesh controls, you must set them before meshing your solid model
Mesh controls allow you to establish such factors as the element shape, mid side node placement, and element size to be used in meshing the solid model. This step is one of the most important of your entire analysis, for the decisions you make at this stage in your model development will profoundly affect the accuracy and economy of your analysis.
The ANSYS Mesh Tool (Main Menu> Preprocessor> Meshing> Mesh Tool) provides a convenient path to many of the most common mesh controls, as well as to the most frequently performed meshing operations.
The many functions available via the Mesh Tool include:
Controlling Smart Sizing levels
Setting element size controls
Specifying element shape
Specifying meshing type (free or mapped)
Meshing solid model entities
Clearing meshes
Refining meshe
1.3 Loading/Deflection analysis of carbon composite material specimen rod by ANSYS:
1.3.1 (At 12150 N load at the center of specimen and simply supported at ends as shown in fig)
© 2016, IRJET | Impact Factor value: 4.45 | ISO 9001:2008 Certified Journal
| Page 644
Max. Y direction (vertical)displacement Plot Max. vertical disp.= 3.89025 mm
1.3Deflection Analysis of regular steel leaf spring through ANSYS
Software analysis is done as follows to find max deflection in horizontal and vertical direction and von mises stress by giving up to 200 kg vertical load in steps of 50 kg rise, at centre of each leaf spring as recommended by manufacturer of Maruti 800 car.
Max. disp in vertical direction UY is 10.578 mm @ load of 50 Kg.
Max. disp in horizontal direction Ux is 3.469 mm @ load of 100 Kg.
Concluding remark:
Through Software analysis max deflection in horizontal and vertical direction and von mises stress are determined by giving up to 200 kg vertical load in steps of 50 kg rise, at centre of each leaf spring as recommended by manufacturer of maruti 800 car. This deflection & von misses stresses are found satisfactory
If we plot displacement V/s load or stress V/s load, it will observe linear because it is linear static analysis. From this analysis we can interpret displacements or stresses below yield pt. observed are realistic, if found crossed yield pt.
© 2016, IRJET | Impact Factor value: 4.45 | ISO 9001:2008 Certified Journal
| Page 645
Deflection Analysis of Carbon composite material leaf spring through ANSYS
Software analysis is done as follows to find max deflection in horizontal and vertical direction and von mises stress by giving up to 200 kg vertical load in steps of 50 kg rise, at centre of each leaf spring as recommended by manufacturer of Maruti 800 car.
Max. disp in vertical direction UY is 9.616 mm @ load of 50 Kg.
Max. eqv stress or von-mises stress 117.719 MPa @ load of 50 Kg.
Concluding remark:
Through Software analysis max deflection in horizontal and vertical direction and von mises stress are determined by giving up to 200 kg vertical load in steps of 50 kg rise, at centre of each leaf spring as recommended by manufacturer of maruti 800 car. This deflection & von mises stresses are found satisfactory.
2. EXPERIMENTATION.
The objective of this dissertation is to analyze experimentally and by finite element method the mechanical behavior of composite material used for leaf spring.
2.1Objectives of the work
The objective of present dissertation is to carry out finite element analysis of composite leaf spring and experimental validation of it. Following steps are followed to meet the objective of present dissertation work.
2.2Experimental Validation
Natural Frequency A specimen rod of carbon fiber material is molded& casted for UTM test as the actual leaf spring will be costlier & need to import. Density & Modulus of elasticity of that material is determined by these test to use these values in FEM analysis. FEM results are validated experimentally using UTM. Following steps are followed for experimental validation.
1. Arrangement of setup is done on UTM.
© 2016, IRJET | Impact Factor value: 4.45 | ISO 9001:2008 Certified Journal
| Page 646
3. Deflection measurement at predefined loading conditions.
4.Comparison of loading/deflection values obtained from FEM analysis and those from experimentation with UTM for sample carbon fiber rod.
5. Comparison of loading/Deflection Values obtained from FEM analysis for carbon fiber leaf & steel leaf . of carbon fiber rod is found experimentally using FFT analyzer to compare & conclude with results of ANSYS. 6. Natural Frequency of carbon fiber leaf is found using ANSYS for leaf size of Maruti 800 .
2.3. Measurement methods
Measurement methods are used to collect data from the tested structure, i.e. to obtain the various mobility properties in the form of a frequency response function. To be able to describe or simulate an existing system accurately, high quality measured data is required. Depending on the type of structure, the time available to perform the tests among others, several methods can be applied for excitation. Some aspects of the measurement process which require particular attention are:
Mechanical aspects of supporting a structure
Mechanical aspects of exciting a structure
Correct transduction of the quantities to be measured by the transducers
(force, displacement, motion, acceleration)
Appropriate signal processing
2.3.1Exciting the structure
There are several methods allowing to do so, each having its particular characteristics and applications,
depending on the type of system analyzed, the quality of the data that is required, the time that is available for
the measurements for instance.
2.3.1.1
Harmonic excitation
This frequency response function is obtained by using steady-state harmonic excitation. Sine excitation is among the most commonly applied excitation methods to obtain frequency response functions.
2.3.1.2.
Random excitation
It is used in linear structural dynamic tests because the characteristics of random signals of containing energy over a wide range of frequencies, simultaneously. This method requires never-repeating and infinite signals.
2.3.1.3. Transient excitation
To perform this kind of testing, we excite the structure by means of a hammer blow and measure the response of the structure. As a impact excitation, a widespread and convenient excitation technique. Above two methods does not require a permanently attached device to produce the force signal on the structure. To perform this kind of testing, we need a shaker attached to the structure like in the case of sine excitation.
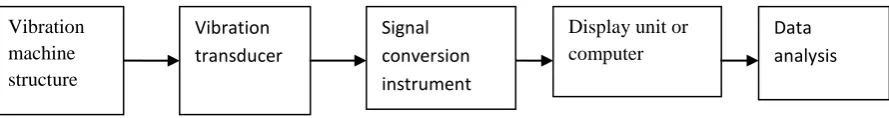
2.4Vibration measurement system
© 2016, IRJET | Impact Factor value: 4.45 | ISO 9001:2008 Certified Journal
| Page 647
Vibrometer, a velocity meter , an accelerometer, a phase meter, or a frequency meter. The following consideration often dictates the type of measuring instrument to be used in a vibration test
1. Size of machine/structure involved.
2. Expected range of frequencies and amplitude.
3. Condition of operation of the machine /equipment/structure.
[image:6.595.40.485.237.296.2]4. Type of data processing used (such as graphical display or graphical recording or storing the record in signal form for computer processing.
Fig.2.4.1 Vibration measurement system
2.5.
Instrumentation used for modal analysis
1) FFT analyzer 2) Accelerometer 3) Exciter4) Impact hammer
2.5.1 Fast Fourier Transform
A spectrum analyzer is an electronic device that is capable of taking the time waveform of a given signal and converting it into its frequency domain. Importance of spectrum analyzer by J. B. Fourier mathematician showed that it is possible to represent any time waveform (the plot of a signal whose amplitude varies with time) by a series of sins and cosines of
particular frequencies and amplitudes
.
2.5.1.1 Two channel spectrum analyzer:
A Two - channel spectrum analyzer is far more powerful than signal channel analyzer. The two-channel analyzer operates in same way as a single channel analyzer with following exception.
1) Two input attenuators.
2) Two input buffers, controlled by the same analyzer in the internal clock.
3) Half the number of lines of resolution as the same analyzer in the single – channel mode.
4) Calculation of cross channel properties such as the transfer function, coherence and coherent –output powe
Table 2.5.1 The Specifications of FFT 10
Physical Characteristics
Size:
Weight:
28 c.m.(width)×
19.7c.m.(height)×
6.1 thick
3.4kg
Vibration transducer© 2016, IRJET | Impact Factor value: 4.45 | ISO 9001:2008 Certified Journal
| Page 648
Input Characteristics
Measuring range: Impedanc e: Polarizati ons Voltage: Gain: Analog Input Filter: 10-200 db
10 G Ω
0,28,200VDC
30 to 90 db in 10 db steps
High pass 1Hz, 20Hz
Low Pass 10 KHz, 20 KHz
Digital Characterization
Digitizati on: Dynamic Range: Amplitude Stability:16-bit A: D / Channel
> 80 db
±0.1 db
FFT
Lines:
Limit:
100,200,400,800 line FFT analyzer
Upper Frequency Limit: 20 KHz
Display Characteristics
Internal L C D: External Display: Backlighting: ElectroluminescentResolution: 128 × 489,with full graphics
1,2 or 4 Display windows
© 2016, IRJET | Impact Factor value: 4.45 | ISO 9001:2008 Certified Journal
| Page 649
Battery:
D C Power:
Nicd (Nickel-Cadmium)
1.5 A@ 11v and 0.5A 216 v
Environmental
Operating Temperat ure:
-10 ˚c to 50 ˚c
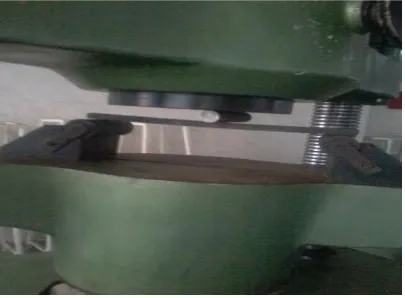
[image:8.595.188.411.325.471.2]2.6 Experimentation of loading deflection By UTM
[image:8.595.198.401.546.695.2]Fig 2.1 Measurement of weight of casting carbon rod
© 2016, IRJET | Impact Factor value: 4.45 | ISO 9001:2008 Certified Journal
| Page 650
[image:9.595.200.403.104.218.2][image:9.595.175.417.261.399.2]
Fig. 2.3 Loading on sample rod at center in line contact using steel rod
Fig 2.4 UTM control panel and display unit
OBSERVATION TABLE:2.3 Loading / deflection experimentation of carbon fiber specimen sample rod
at UTM.
SN LOAD KG DEFLECTION –
MM
1 50 10.1
2 100 19.8
[image:9.595.149.445.464.563.2]3 150 31.2
Table 2.4 showing comparison of experimental & FEM results of loading & deflection of carbon
composite material specimen rod
SN LOAD KG DEFLECTION –MM by UTM DEFLECTION in MM by ANSYS
1 50 10.1 09.616
2 100 21.5 19.235
3 150 31.2 28.849
© 2016, IRJET | Impact Factor value: 4.45 | ISO 9001:2008 Certified Journal
| Page 651
Concluding remark:
Through comparison of experimental & FEM results of loading & deflection of carbon fiber epoxy composite material specimen rod.(sample size =15 x 25 x 395 mm). which is simply supported at both ends 50 mm away from each end. It is investigated that results are matching with 9% error may be due to improper inputs provide to ANSYS. But still in acceptance range .
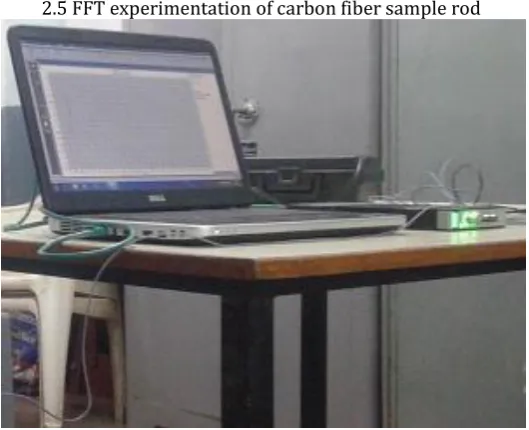
[image:10.595.166.431.196.411.2]2.5 FFT experimentation of carbon fiber sample rod
Fig 2.5 FFT analyzer with computer interface
[image:10.595.194.404.445.579.2]© 2016, IRJET | Impact Factor value: 4.45 | ISO 9001:2008 Certified Journal
| Page 652
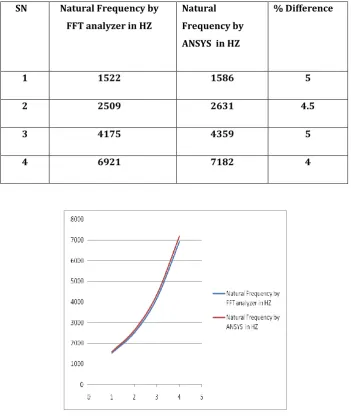
Table 2.6.1 Showing comparison of experimental & FEM results of natural frequency of carbon
composite material specimen rod
SN Natural Frequency by
FFT analyzer in HZ
Natural Frequency by ANSYS in HZ
% Difference
1 1522 1586 5
2 2509 2631 4.5
3 4175 4359 5
4 6921 7182 4
Concluding remark:
Through comparison of experimental & FEM results of natural frequency of carbon fiber epoxy composite material specimen rod.(sample size =15 x 25 x 395 mm). which is simply supported at both ends 50 mm away from each end. It is investigated that results are matching with 4.5% error may be due to improper inputs provided to ANSYS. But still in acceptance range Experimental results shows that values of natural frequencies determined experimentally are with difference than those obtained by theoretical and FEM analysis due to certain parameters discussed below as It is important to highlight the reasons contributing towards deviation
3.CONCLUSION
1
.Experimental results of loading & deflection are matching with the FEM results hence we can replace carbon fiber leaf [image:11.595.123.475.154.571.2]© 2016, IRJET | Impact Factor value: 4.45 | ISO 9001:2008 Certified Journal
| Page 653
2.Experimental natural frequency of carbon fiber specimen rod matches with the ANSYS results with 4.5% difference which is inacceptable range.
3.Stress level is same in both the springs of steel & carbon leaf as cross section area is same.
4. Due to reduction in mass of carbon fiber leaf ,suspension performance will be greater than leaf spring.
5.This carbon leaf spring will be corrosion free hence friction noise problem will be no more and no need of greasing the leaf springs as in steel leaf case.
6.Loading deflection - ANSYS results of steel leaf & carbon fiber leaf are compared and found similar with 9% of
acceptable range of difference
.
4. ACKNOWLEDGMENT
The authors would like to thanks Prof.Gaur A.V. from BMIT College of engineering Solapur, Solapur University for
providing his valuable guidance and encouragement for project work
5.
REFERENCES
:
5.1Journals.
[1].International Journal of Mathematical and Analysis, Series Publication 5.2ASME Journals.
[1].”International Journal of Innovative Research in Science, Engineering and Technology Vol.
[2].W. J. Padgett “A Multiplicative Damage Model for strength of Fibrous composite Materials” IEFE transactions on reliability, VOL. 47, No. 1, 1998 March.
[3].PHD Thesis submitted by Daniel David Samborsky,Montana state university, Bozeman. Montana. On “Fatigue of e - glass fiber reinforced composite materials and substructures
[4].Kin-tak Lau, Li-min Zhou, Xiao-ming Tao “Control of natural frequencies of a clamped–clamped composite beam with embedded shape memory alloy wires” Composite Structures 58 (2002) 39–47 Elsevier.
[5].Akirakuraishi, Stephen W. Tsai, and Julie Wang “Material Characterization of Glass, Carbon, andHybrid - Fiber SCRIMP Panels” Contractor4 Report for Sandia national Laboratories.
[6].Vinkel Arora, Gian Bhushan and M.L. Aggarwal “Eye Design Analysis of Single Leaf Spring In Automotive Vehicles Using CAE Tools”InternationaJournal of Applied Engineering and Technology Vol. 1, 2011.
[7].Ranjeet Mithari, Amar Patil, & Prof. E. N. Aitavade “Analysis of Composite Leaf Spring By Using Analytical & FEA” International Journal of Engineering Science and Technology Vol. 4 No.12 December 2012.
[8].B.Vijaya Lakshmi, I.Satyanarayana“Static and Dynamic Analysis onComposite Leaf Spring in Heavy Vehicle” International Journal of Advance
BIOGRAPHIES
jayra
Name :Er.Rathod Jairam.C PG students (ME Design appear) BMIT COE SOLAPUR
Email:[email protected]/ [email protected]
Name:Prof.Gaur Abhay Singh.V. Designation: Assistance Professor BMIT COE Solapur.Solapur University.