2018 2nd International Conference on Modeling, Simulation and Optimization Technologies and Applications (MSOTA 2018) ISBN: 978-1-60595-594-0
Index Empowerment Based on comprehensive Entropy Weight
Method—Taking Chinese Residents' Consumption
Structure as an Example
Xin-xin CHANG
1,*, Liang HU
1and Ze-qing YAO
21Graduate School, Army Engineering University of PLA, Nanjing Jiang Su 211101, China
2Department of Basic, Army Engineering University of PLA, Nanjing Jiang Su 211101, China
Keywords: Comprehensive entropy weight method, Entropy weight method, Correlation analysis, Consumption structure.
Abstract. In order to improve the scientific and comprehensive nature of the index evaluation system, this paper takes the Chinese residents' consumption structure as an example, and uses the index weighting method combined with the entropy weight method and the correlation analysis, that is, the comprehensive entropy weight method to determine the weight value of each index of the Chinese residents' consumption structure. By calculating the method of comprehensive weight, it overcomes the shortcomings of using a single weighting method, makes the calculation of weight more scientific and reasonable, and through case analysis, the evaluation result obtained by this method is more objective and reasonable, practical and feasible.
Introduction
For comprehensive assessment issues, the determination of weights is very important.Changes in weight values will directly affect the scientific rationality of the comprehensive assessment results. In the weight determination method, most of the literature adopts a single weighting method when determining the weight. In order to overcome the shortcomings of the single weighting method, This paper proposes to use the improved entropy weight method, that is, the comprehensive entropy weight method, which measures the indexes horizontally and vertically to determine the weight value of each index in the comprehensive evaluation problem more comprehensively and objectively.
In this paper, the entropy weight method is used to evaluate the degree of difference of an index in all data. The larger the index weight is, the larger the difference is in all the data. The more influence the index has on the data order, the more important the index is. Secondly, by transforming the correlation coefficient, a value is obtained, which is the weight under the method. The larger the value, the stronger the correlation between the index and other indexes, that is, the greater the influence of the index on other indexes, the more important the index is. Finally, the weights are integrated on the basis of the two weights, and then the goals are sorted.
Method Introduction
Entropy Weight Method
The entropy weight method[1] is an objective weighting method, which is used to measure the amount of information in information theory. That is, the more ordered a system, the lower the information entropy; conversely, the higher the information entropy.
Standardization of Indexes
Suppose there are m data, each datum has n evaluation indexes, and the j-th index value of the i-th data is represented toxij, and the initial matrix is X=(xij m n) . Then standard the indexes. When the j-th index is a positive index, the standardized index value is:
min( )
max( ) min( )
ij ij ij ij ij x x r x x (1) When the j-th index is a negative index, the standardized index value is:
max( )
max( ) min( )
ij ij ij ij ij x x r x x
(2)
After normalizing the matrix X, the matrix R=( )rij m n is obtained.
Calculate the Entropy of Each Index
The entropy[2] of the j-th index is:
1
1
ln ( 1, 2, , )
ln
m
j ij ij i
e f f j n
m
(3)Where
1
m
ij ij ij
i
f r r
, 1lnm is entropy coefficient, and when fij 0, fijln fij 0
Determine the Weight of the Index
The weight of the j-th index is:
1 1 j j n j j e w n e
, (0wj 1,
1 1 n j j w
) (4)Correlation Coefficient Assignment Method
The entropy weight only vertically reflects the size of each index's own information. By introducing correlation analysis, the relevant weights can be used to measure the weight of the indexes horizontally, making the index weight more comprehensive and reasonable. This method in this paper is defined the comprehensive entropy weight method.
The correlation coefficient matrix as follow:
( )
N N ij γ R × =
A matrix of correlation coefficients with elements between -1 and 1, and the weights associated with each index are:
1 1 1 1 N N ij i
j N N
N ij j i v N
. (5)
Comprehensive Entropy Method
1
j j j n
j j j
w v
u
w v
, j=1, ,n. (6)Example Analysis
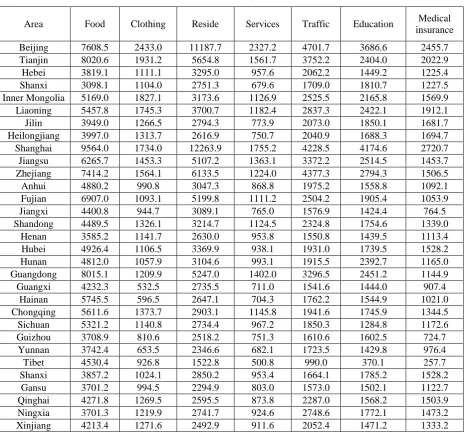
[image:3.595.67.534.241.677.2]The data on per capita consumption expenditure of residents in each region comes from the survey of household income and expenditure and living conditions organized and implemented by the National Bureau of Statistics. The consumption structure data of residents in 31 provinces (autonomous regions and municipalities) in China are shown in Table 1:
Table 1. Resident consumption structure.
Area Food Clothing Reside Services Traffic Education Medical insurance Beijing 7608.5 2433.0 11187.7 2327.2 4701.7 3686.6 2455.7 Tianjin 8020.6 1931.2 5654.8 1561.7 3752.2 2404.0 2022.9 Hebei 3819.1 1111.1 3295.0 957.6 2062.2 1449.2 1225.4 Shanxi 3098.1 1104.0 2751.3 679.6 1709.0 1810.7 1227.5 Inner Mongolia 5169.0 1827.1 3173.6 1126.9 2525.5 2165.8 1569.9 Liaoning 5457.8 1745.3 3700.7 1182.4 2837.3 2422.1 1912.1 Jilin 3949.0 1266.5 2794.3 773.9 2073.0 1850.1 1681.7 Heilongjiang 3997.0 1313.7 2616.9 750.7 2040.9 1688.3 1694.7 Shanghai 9564.0 1734.0 12263.9 1755.2 4228.5 4174.6 2720.7 Jiangsu 6265.7 1453.3 5107.2 1363.1 3372.2 2514.5 1453.7 Zhejiang 7414.2 1564.1 6133.5 1224.0 4377.3 2794.3 1506.5 Anhui 4880.2 990.8 3047.3 868.8 1975.2 1558.8 1092.1 Fujian 6907.0 1093.1 5199.8 1111.2 2504.2 1905.4 1053.9 Jiangxi 4400.8 944.7 3089.1 765.0 1576.9 1424.4 764.5 Shandong 4489.5 1326.1 3214.7 1124.5 2324.8 1754.6 1339.0
Henan 3585.2 1141.7 2630.0 953.8 1550.8 1439.5 1113.4 Hubei 4926.4 1106.5 3369.9 938.1 1931.0 1739.5 1528.2 Hunan 4812.0 1057.9 3104.6 993.1 1915.5 2392.7 1165.0 Guangdong 8015.1 1209.9 5247.0 1402.0 3296.5 2451.2 1144.9 Guangxi 4232.3 532.5 2735.5 711.0 1541.6 1444.0 907.4
Hainan 5745.5 596.5 2647.1 704.3 1762.2 1544.9 1021.0 Chongqing 5611.6 1373.7 2903.1 1145.8 1941.6 1745.9 1344.5 Sichuan 5321.2 1140.8 2734.4 967.2 1850.3 1284.8 1172.6 Guizhou 3708.9 810.6 2518.2 751.3 1610.6 1602.5 724.7
Yunnan 3742.4 653.5 2346.6 682.1 1723.5 1429.8 976.4 Tibet 4530.4 926.8 1522.8 500.8 990.0 370.1 257.7 Shanxi 3857.2 1024.1 2850.2 953.4 1664.1 1785.2 1528.2
Gansu 3701.2 994.5 2294.9 803.0 1573.0 1502.1 1122.7 Qinghai 4271.8 1269.5 2595.5 873.8 2287.0 1568.2 1503.9 Ningxia 3701.3 1219.9 2741.7 924.6 2748.6 1772.1 1473.2 Xinjiang 4213.4 1271.6 2492.9 911.6 2052.4 1471.2 1333.2
Calculating Weights Using the Entropy Weight Method
The calculated weights are (See Table 2):
Table 2. Index entropy weight.
According to the data obtained, it can be seen that the weight of the residential index is the largest, indicating that the residential consumption is an important index to evaluate the consumption structure of the residents; the weight of the medical care and education indexes is small, indicating that it has less influence on the evaluation of the consumption structure of residents.
Calculate Weights Using Correlation Analysis
[image:4.595.74.522.472.545.2]The correlation coefficients between the seven indexes are shown in Table 3:
Table 3. Correlation coefficient matrix.
Food Clothing Reside Services Traffic Education Medical insurance Food 1.000 0.581 0.831 0.791 0.818 0.760 0.550 Clothing 0.581 1.000 0.680 0.840 0.801 0.722 0.808 Reside 0.831 0.680 1.000 0.889 0.861 0.910 0.746 Services 0.791 0.840 0.889 1.000 0.886 0.866 0.766 Traffic 0.818 0.801 0.861 0.886 1.000 0.884 0.763 Education 0.760 0.722 0.910 0.866 0.884 1.000 0.832
Medical
insurance 0.550 0.808 0.746 0.766 0.763 0.832 1.000
The relevant weights obtained by formula (5) are (See Table 4):
Table 4. Index related weight.
Index Food Clothing Reside Services Traffic Education Medical insurance Related
weight vj 0.192 0.178 0.123 0.107 0.11 0.115 0.175
Comprehensive Weight
The comprehensive weight is obtained by formula (6) (See Table 5):
Table 5.Index comprehensive weight.
Index Food Clothing Reside Services Traffic Education Medical insurance Index
comprehensive weight uj
0.265 0.148 0.221 0.109 0.11 0.059 0.087
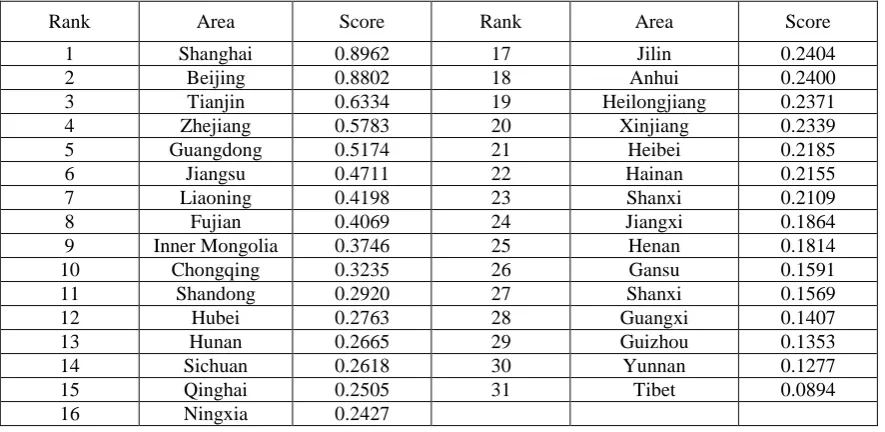
The 31 provinces are sorted according to the comprehensive weights as shown in the table 6:
Table 6.Ranking of consumption structure of 31 provinces in China.
[image:4.595.78.521.581.797.2]Using the comprehensive weights, the results of the regional rankings are consistent with the economic development of each region, indicating that the method is applicable to the analysis of such comprehensive problems.
References
[1] Li Na-na, He Zheng-you, Power Quality Comprehensive Evaluation Combining Subjective Weight with Objective Weight, Power System Technology. 2009, 6(33), 55-61.
![Malta Progress Report Template for Malta progress reports [on renewable energy resources] under Directive 2009/28/EC](data:image/gif;base64,R0lGODlhAQABAIAAAP///wAAACH5BAEAAAAALAAAAAABAAEAAAICRAEAOw==)