International Journal of Emerging Technology and Advanced Engineering
Website: www.ijetae.com (ISSN 2250-2459, Volume 2, Issue 4, April 2012)377
Modeling of Wire Electrical Discharge Machining Parameters
Using Titanium Alloy (Ti-6AL-4V)
Basil Kuriachen
1, Dr. Josephkunju Paul
2, Dr.Jose Mathew
31Research Scholar, Department of Mechanical Engineering, National Institute of Technology Calicut
Kozhikode-673601, India
2Professor and HOD, Department of mechanical Engineering, MA College of Engineering Kothamangalam, India 3Professor, Department of Mechanical Engineering, National Institute of Technology Calicut
Kozhikode-673601, India
1
Abstract—Wire electro discharge machining (WEDM) is a modification of electro discharge machining (EDM) which has been widely used for long time for cutting punches and dies, shaped pockets and other machine parts of electrically conducting work materials. Technology of the WEDM process is based on the conventional EDM sparking phenomenon, utilizing the widely accepted non contact technique of material removal with a difference that spark is generated at the wire and work piece gap. Evolution of WEDM made drastic changes in the area of precision machining with highest degree of dimensional accuracy and surface finish. In this paper, two level full factorial techniques were used for modelling and predicting the surface roughness in WEDM of titanium (Ti-6Al-4V) alloy. Surface roughness was taken as a response variable measured after machining and pulse ON time, pulse OFF time, voltage and dielectric flushing pressure were taken as input parameters. The level of importance of the WEDM cutting parameters on the surface roughness was determined by using the analysis of variance method (ANOVA). A mathematical relation between the workpiece surface roughness and WEDM cutting parameters was established. This mathematical model may be used for evaluating the surface roughness without performing any experiments. The predicted values of surface roughness by the mathematical model were compared with the experimental values. It is observed that the predicted results agree with the experimental values within an error of 7 %.
Keywords—Surface roughness, factorial design, WEDM, Titanium (Grade 5), DOE
I.
I
NTRODUCTIONWEDM is one of the non-traditional processes which is accepted globally to machine high strength to weight ratio materials mainly employed for nuclear and aerospace industries. This (WEDM) is one of the main applications of the traditional electrical discharge machining (EDM). EDM machining was first discovered by the English scientist Joseph Priestly in 1770, but its advantages were utilized completely only in the year 1943 by the Russian scientists and it was commercially developed in the year 1970. In the mid of 1980s this technique was used in machine tools to machine electrically conducting materials. WEDM utilizes a continuously travelling wire electrode made of thin copper, brass or tungsten or coated wire of diameter 0.05 – 0.3 mm [1]. A dielectric fluid is forced into the machining zone to improve the effectiveness as well as to carry away the debris so that it reduces the chances of short circuit between wire electrode and the work piece. Nowadays, in order to achieve better performance, the work piece and the tool are submerged in the dielectric fluid. Most commonly used dielectric fluids are kerosene and de ionized water [2]. The data base to select the correct parameter setting for newly developed materials is not readily available. The machine manufacturers provide the information only for the commonly used materials. So the databases provided by the manufacturers are not enough to meet the present needs of modern industries [3].
International Journal of Emerging Technology and Advanced Engineering
Website: www.ijetae.com (ISSN 2250-2459, Volume 2, Issue 4, April 2012)378
WEDM of Ti-6Al-4V. The various parameters were selected using design of experiments method.
II.
L
ITERATURER
EVIEWThere are a number of published works that reveal the influence of WEDM parameters on the surface roughness of different materials. Y.S. Liao found that surface roughness is most affected by the pulse on time [5]. The WEDM parameters are generally classified into two groups namely electrical and non electrical. [6]. S.S. Mahapatra and Amar Patnaik have investigated the effect of various parameters and found that current, pulse duration and dielectric pressure play most significant role in surface finish [7]. U.Esme et.al observed that increase in pulse duration, voltage and wire speed increase the surface roughness whereas increase in flushing pressure of dielectric fluid decrease the surface roughness [8]. The investigations made by J.T Hung et.al revealed that pulse on time is one of the significant factors that influence surface roughness [9]. The previous researchers established that pulse duration, voltage, and dielectric pressure are the desired combination to control the surface finish [1]. Ramakrishnan et al. described the multi objective optimization of the WEDM process using parametric design of Taguchi methodology [11]. Fuzhu Han et.al found that surface roughness can be improved by decreasing both pulse duration and discharge current [10]. Although lot of investigations were done on the influence of various WEDM parameters on surface roughness, till date no investigation was conducted on the influence of pulse on time, pulse off time, voltage and dielectric pressure on WEDM of Ti-6Al-4V using DOE. This experimental study reveals the influence of pulse on time, pulse off time, voltage and dielectric pressure and its interactions on the surface roughness in WEDM of Ti-6Al-4V alloy.
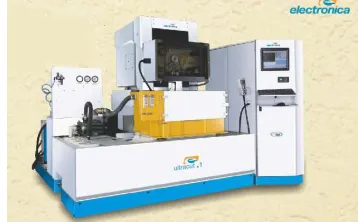
FIGURE .1 DETAILS OF WEDM SETUP.
III.
E
XPERIMENTALS
ETU
PThe experimental set up adopted for present study is given in figure 2. The WEDM experiments were conducted in Electronica ultra cut s1 machine using 0.25 mm brass wire as the tool electrode. ‗Pulse on time‘, ‗pulse off time‘, ‗voltage‘ and ‗dielectric pressure‘ are the four WEDM parameters that were selected for investigations. In this experimental study two level full factorial experiment is adopted because this gives all possible combinations of machine parameters. All other machine parameters were kept constant during the time of experiment.
IV.
E
XPERIMENTALD
ESIGNB
ASEDO
ND
OEA full factorial design with all factors at two levels provides the estimation of all the required parameter combinations. Altogether sixteen experiments and two conformation tests were conducted. For the analysis of the experiments 10% confidence level is used.
FIGURE.2 ELECTRONICA ULTRACUT S1 WEDM 5-AXES
[image:2.612.358.537.355.466.2]ANNOVA table helped to find out the significant factors and to establish the mathematical relationship between the surface roughness and machining parameters.
TABLE I
MACHINING PARAMETERS AND LEVELS
Factor Parameters Level 1 Level 2
A Pulse on time (μS) 20 25
B Pluse off time (μS) 44 50
C Voltage (V) 25 30
D
Dielectric pressure
International Journal of Emerging Technology and Advanced Engineering
Website: www.ijetae.com (ISSN 2250-2459, Volume 2, Issue 4, April 2012)379
V.
R
ESULTSA
NDD
ISCUSSIONSThis section discusses the influence of the process parameters on the surface roughness. The main objective of this discussion is to assess the variation of surface roughness with respect to the change in the process parameters. The various machining parameters in two levels and corresponding results of surface roughness (average of three readings) are tabulated in Table 2.
TABLE II
EXPERIMENTAL DESIGN AND RESULTS
No Voltage (V)
Dielectric pressure (kgf/cm2)
Pulse on time (μS)
Pulse off time (μS)
Ra
(μm)
1 25 10 20 44 3.534
2 30 10 20 44 3.544
3 25 15 20 44 3.331
4 30 15 20 44 3.348
5 25 10 25 44 4.227
6 30 10 25 44 4.285
7 25 15 25 44 3.628
8 30 15 25 44 4.009
9 25 10 20 50 3.635
10 30 10 20 50 3.447
11 25 15 20 50 3.624
12 30 15 20 50 3.364
13 25 10 25 50 3.907
14 30 10 25 50 4.023
15 25 15 25 50 3.384
16 30 15 25 50 4.283
17 28 13 23 47 3.821
18 26 11 21 45 3.388
The ANNOVA table of surface roughness (Ra) showed that two individual factors and one interaction affect the surface roughness. The probability values (Prob>F) are less than 0.05 for pulse on time, dielectric pressure(WP) and the interaction between the voltage and pulse on time. The most important factor which affects the surface roughness is pulse on time. The relation between the various parameters and surface roughness are given in the main effect plot viz. figure (3a), figure (3b) and figure (3c).
FIGURE 3A
FIGURE 3B
FIGURE 3C
International Journal of Emerging Technology and Advanced Engineering
Website: www.ijetae.com (ISSN 2250-2459, Volume 2, Issue 4, April 2012)380
It is evident from figure (3a) that the surface roughness decreases with increase in dielectric pressure, whereas figure (3b) reveals that the surface roughness increases with increase in pulse on time. Figure (3c) gives the variation of surface roughness with voltage corresponding to minimum and maximum values of pulse on time. It can be noticed from the figure that corresponding to minimum value of pulse on time the surface roughness decreases with increase in voltage, whereas the surface roughness increases with increase in voltage corresponding to maximum value of pulse on time.
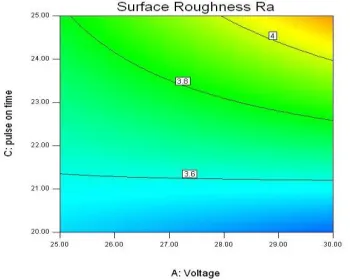
[image:4.612.331.559.405.574.2]When the pulse on time is maximum and the voltage increase from 25 v to 30 v, the surface roughness also increases. To achieve minimum surface roughness (Ra), the pulse on time, voltage and dielectric pressure should be set at 20 µs, 30 V and 15 kgf/cm2 respectively. The effect of these factors on surface roughness is evident from the ‗3 D interaction graph‘ depicted in fig. (4). A contour plot of surface roughness connecting pulse on time and voltage is given in fig. (5). On the basis of the experimental investigations, an empirical relationship for surface roughness connecting voltage, dielectric pressure and pulse on time is established, which is given below
FIGURE.4 SURFACE PLOT FOR SURFACE ROUGHNESS.
FIGURE.5 CONTOUR PLOT FOR SURFACE ROUGHNESS.
Ra = - 21.54350 + (0.79120 X Voltage) + (2.71630 X dielectric pressure) + (1.27310 X pulse on time) - (0.094980 X Voltage X dielectric pressure) – (0.039800 X Voltage X pulse on time) -(0.13526 X dielectric pressure X pulse on time) + (4.68400E-003 X Voltage X dielectric pressure X pulse on time)
VI.
C
OMPARISONO
FC
ONFORMATIONT
ESTR
ESULTSW
ITHP
REDICTEDV
ALUES.
Two conformation runs were conducted in order to measure the reliability of optimization solutions obtained from the analysis.The comparison of test results between the therotical prediction and conformation test results were the final consideration that will determine whether the optimum parameters predicted are within the allowable range. The margin of error from prediction and experimental results was obtained below 7%. Table 3 shows the comparison of the test results with the predicted values.
TABLE IIIIV
COMPARISON OF THE TEST RESULTS WITH THE THEROTICAL PREDICTION.
No. of
conformation
Runs
Predicted
values using
the
mathematical
model
Conformation
test results
% of
Error
1 3.77109 3.821 1.32
2 3.63406 3.388 6.76
VII. CONCLUSION
[image:4.612.63.227.414.517.2] [image:4.612.58.233.559.699.2]International Journal of Emerging Technology and Advanced Engineering
Website: www.ijetae.com (ISSN 2250-2459, Volume 2, Issue 4, April 2012)381
The following conclusions are drawn based on the investigations.
1. The pulse on time , dielectric pressure, the interaction of voltage and pulse on time are significant parameters which affect the surface roughness.
2. Minimum surface roughness can be obtained by adopting a low value of pulse on time (20 µs) and a high value of dielectric pressure (15 kgf/cm2).
3. Improper setting of pulse on time and pulse off time can lead to wire breakage which in turn lead to increase in machining time.
4. A mathematical model is established to predict the value of surface roughness.
5. The marginal error obtained by the comparision of the predicted results with the conformation test was less than 7%.
REFERENCES
[1] K.H. Ho, S.T. Newman, S. Rahimifard, R.D. Allen, ―State of the art in wire electrical discharge machining (WEDM)‖ International Journal of Machine Tools & Manufacture 44 (2004) 1247–1259.
[2] Manufacuring science second edition by Amitabha Ghosh and Asok Kumar Mallik, Second Edition.
[3] Scott F. Miller, Chen-C. Kao, Albert J. Shih, Jun Qu, ―Investigation of wire electrical discharge machining of thin cross-sections and compliant mechanisms‖, International Journal of Machine Tools & Manufacture 45 (2005) 1717– 1725.
[4] Fuzhu Han, Jun Jiang, Dingwen Yu, ―Influence of discharge current on machined surfaces by thermo-analysis in finish cut of WEDM‖, International Journal of Machine Tools & Manufacture 47 (2007) 1187–1196.
[5] Y.S. Liao, J.T. Huang, Y.H. Chen, ―A study to achieve a fine surface finish in wire-EDM‖, Journal of Materials Processing Technology 149 (2004) 165–171.
[6] Y.S. Liao, J.T. Huang, Y.H. Chen, ―A study to achieve a fine surface finish in Wire-EDM‖, Journal of Materials Processing Technology 149 (2004) 165–171.
[7] Yan, B. H., Wang, C. C., Liu, W. D. and Huang F. Y. (2002). ―Machining Characteristics of Al2O3 / 6061 Al Composite Using Rotary EDM with a Dislike Electrode.‖ The International Journal of Advances Manufacturing Technology, 16: pp. 322-333.
[8] S. S.Mahapatra, Amar Patnaik, ―Parametric Optimization of Wire Electrical Discharge Machining (WEDM) Process using Taguchi Method‖, / Vol. XXVIII, No. 4, October-422 December 2006.
[9] U.Ese,Sagbas,F Kahraman, ―Prediction of Surface Roughness in Wire Electrical Discharge machining using design of Experiments and Neural Networks‖, Iranian Journal of Science & Technology, Transaction B, Engineering, Vol. 33, No. B3, pp 231-240
[10] J.T. Huang, Y.S. Liao, W.J. Hsue, ―Determination of finish-cutting operation number and machining-parameters setting in wire electrical discharge machining‖, Journal of Materials Processing Technology 87 (1999) 69–81.
[11] Fuzhu Han & Jun Jiang & Dingwen Yu, ―Influence of
machining parameters on surface roughness in finish cut of WEDM‖, Int J Adv Manuf Technol (2007) 34:538–546
[12] R. Ramakrishnan · L. Karunamoorthy, ―Multi response