International Journal of Emerging Technology and Advanced Engineering
Website: www.ijetae.com (ISSN 2250-2459, Volume 2, Issue 5, May 2012)41
Surface Roughness Modeling in Precision Turning of
Aluminium by Polycrystalline Diamond Tool
Using Response Surface Methodology
S C Shah
1, Dr. P M George
21
Mechanical Engineering Department, G. H. Patel College of Engineering and Technology, Vallabh Vidyanagar, District Anand, Gujarat
2Mechanical Engineering Department, B. V. M. Engineering College,
Vallabh Vidyanagar, District Anand, Gujaraat
Abstract— Diamond, because of its high modulus of elasticity, chemical inertness and exceptionally high hardness, is ideal for obtaining fine surface finish and accuracy. Today’s requirement of high precision parts like magnetic memory device, laser equipment, electrostatic copier, printing machine, etc., made of non-ferrous materials, such as aluminum, copper and resin demands very high surface finish. The Polycrystalline Diamond (PCD) tool is suitable for such precision machining because of its low affinity to these materials and sharp cutting edges. PCD tools also can be used for machining of carbon, ceramics, glass, reinforced plastics, rubbers, plastics and resins, aluminum oxide, etc.
In this paper, Response Surface Methodology is used to make a predictive mathematical model of surface roughness for aluminum turned using PCD tool on a CNC turning center. This model can be used for selecting the values of process variables namely work piece rpm, feed and depth of cut to get the desired value of the response i.e. surface finish within the range of experimentation.
Keywords—PCD tool, Surface Roughness, Response Surface Methodology, CNC turning center.
I. INTRODUCTION
The prediction of surface roughness during metal removal operation is of considerable interest to planners of production. In many cases surface roughness is a functional requirement and hence it is necessary to control it. Although the general effects of the machining variables like work piece rpm, depth of cut, feed, etc., on surface roughness using conventional tools have been investigated thoroughly; no attempt has been made to obtain comprehensive predictive models of surface roughness while machining nonferrous metals like aluminum with PCD tool. Trends in the metal cutting industry are driven by the manufacturers‘ need to continually improve performance, reduce costs and, increasingly, comply with environmental legislation.
These trends are also influenced by work piece material development and many of these trends in machining technology practice have favored the use of PCD [1]. The advantages of using PCD tools in machining MMCs were further demonstrated by Lin et al [2]. El-Gallab and Sklab[3,4,5] studied the dry high-speed cutting of MMCs at different values of cutting parameters. The results indicate that PCD tools provide satisfactory tool life compared to aluminum oxide and coated-cemented carbide. Surface roughness measurements show that the surface roughness improves with an increase in the feed rate and cutting speed, but slightly deteriorates with an increase in the depth of cut.
In the present work, surface roughness models are developed by a statistical approach referred to as Response Surface Methodology (RSM), instead of the conventional, one variable at a time method. With this technique, the number of tests required to develop a surface roughness predicting equation can be minimized. Application of this method allows maximum use of information at a minimum cost. The Response Surface Function gives a complete summary of the results of the experiment and also enables to predict the response for the combination of the values of factors that are not tested experimentally within the range of experimentation.
International Journal of Emerging Technology and Advanced Engineering
Website: www.ijetae.com (ISSN 2250-2459, Volume 2, Issue 5, May 2012)42
Three independent variables; viz. work piece rpm, feed and depth of cut are investigated and a first order surface roughness model is fitted and the model is verified through confirmatory tests.II. DESIGN OF EXPERIMENT
Response Surface Methodology (RSM) is a collection of mathematical and statistical techniques useful for analyzing problems where several independent variables influence a dependent variable or response, and the goal is to optimize this response [9]. The independent variables are denoted by x1, x2, x3, ……, xk. It is assumed that these variables are continuous and controllable by the experimenter with negligible error and the response, ‗y‘ is a random variable. RSM is used for the design and analysis of experiments; it seeks to relate an average response to the value of quantitative variables that effect response. A response surface is a graphical representation of the relation [10]. = (x1, x2, x3, …..xk) (1)
In this case, the response surface is fitted with polynomials of first degree [9, 10].
= 0x0 + 1x1 + 2x2 +... + kxk (2) ŷ = b0x0 + b1x1 + b2x2 + ...+ bkxk (3) Where = the true value of surface roughness.
x0 = 1 (a dummy variable).
x1, x2, x3 – are normal transformations of the work piece rpm, feed and depth of cut.
0, 1, 2, 3 – are parameters to be estimated.
Functional relationship between surface roughness and the independent variables under investigation could be represented by [9, 10].
Ra = b0 + b1n + b2f + b3d (4)
Where b0, b1, b2, b3 – are the estimates of the parameters 0, 1, 2 and 3.
The linear mathematical model representing the functional relationship is,
= 0x0 + 1x1 + 2x2 + 3x3 (5) Equation (5) however, may be expressed as y – e = b0x0 + b1x1 + b2x2 + b3x3 (6)
Where, y is the measured surface roughness, e is experimental error,
Equation (6) is a polynomial of the first degree. The coefficients of this linear equation can be estimated by the method of least squares.
To develop a first order surface roughness model, a design consisting of twelve experiments is used [9, 10, 11]. Among them four experiments repeated at the same values, are used to measure the pure error. This design provides three levels for each independent variable, coded ―-1‖ as low level, ―0‖ as the center level and ―+1‖ as the high level. The least square objective function S is given by:
Ni i
y
S
1
2
)
y
(
Where yi = the measured or experimental value of the
response for ith observation
y = the predicted or calculated value of response for ith observation.
N = the total number of experimental points.
The best value of the model parameters is obtained when the objective function S is minimal. It may be noted that S represents the sum of squares of error ‗e‘.
sThe predictive first order model is,
y = b0 + b1x1 + b2x2 + ... + bkxk (7)
The parameters in equation (7) can be computed by using the following equation [10].
b0 = x0y/N bi = xiy/nc
Where N = the total number of experimental points. nc = the corner points and
i = 1, 2,………,k.
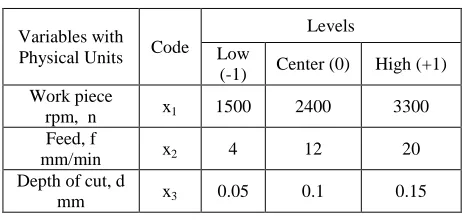
[image:2.612.322.553.587.699.2]First order model demands with 3 independent variables follows a 23 factorial design. The independent variables considered are (i) work piece rpm, (ii) feed mm/min and (iii) depth of cut in mm and the measured response is surface roughness Ra m. Experimental points considered are corners of the cube and four replicated central points for the estimation of the pure error. Independent variables are coded as shown in Table 1 [9, 10, 11].
Table I: Variables and their levels
Variables with Physical Units Code
Levels Low
(-1) Center (0) High (+1) Work piece
rpm, n x1 1500 2400 3300 Feed, f
mm/min x2 4 12 20
Depth of cut, d
International Journal of Emerging Technology and Advanced Engineering
Website: www.ijetae.com (ISSN 2250-2459, Volume 2, Issue 5, May 2012)43
Equation for normal transformation,(8)
III. EXPERIMENT
For the present investigation the machine used is CNC high performance turning center machine, Daewoo Heavy Industries & Machinery Ltd., Model – PUMA 240. The work piece material is aluminium bar of 23.8 mm diameter with a chemical composition of Si – 0.6 to 1.3 %, Mn – 0.4 to 1 %, Mg – 0.4 to 1.2 %, Cu – 0.1 % max., Fe – 0.6 % max., Zn – 0.1 % max., having ultimate tensile strength 31.6 MPa and BHN 85. PCD tool insert is DCMW 11 with a nose radius of 0.35 mm. A water-soluble coolant is used to remove the fine chips of aluminium from the zone of machining. The instrument used to measure surface roughness is Surface Roughness Tester (SJ-201), Mitutoyo Corporation, Japan with a least count of 0.01 m and sampling length of 0.8 mm.
IV. RESULT AND DISCUSSION
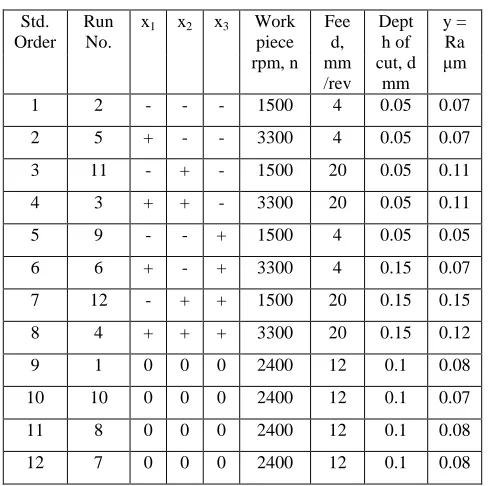
[image:3.612.317.572.286.408.2]The design matrix and the measured responses are given in Table 2.
Table II: Design matrix and response
Std. Order
Run No.
x1 x2 x3 Work piece rpm, n Fee d, mm /rev Dept h of cut, d mm y = Ra μm
1 2 - - - 1500 4 0.05 0.07
2 5 + - - 3300 4 0.05 0.07
3 11 - + - 1500 20 0.05 0.11
4 3 + + - 3300 20 0.05 0.11
5 9 - - + 1500 4 0.05 0.05
6 6 + - + 3300 4 0.15 0.07
7 12 - + + 1500 20 0.15 0.15
8 4 + + + 3300 20 0.15 0.12
9 1 0 0 0 2400 12 0.1 0.08
10 10 0 0 0 2400 12 0.1 0.07
11 8 0 0 0 2400 12 0.1 0.08
12 7 0 0 0 2400 12 0.1 0.08
Using this data the parameters of the first order equation is estimated and the model is given by,
Ra=0.0505–4.1666*10-6*n+3.906*10-3f+0.025d (9)
A. Checking the adequacy of the postulated model:
[image:3.612.46.290.453.696.2]The adequacy of the proposed model is tested by means of the analysis of variance (ANOVA). ANOVA for the model fitted is presented in Table 3. [9,10,11,12] which shows that lack of fit is very low (ftab>fcal) and first order terms are highly significant (fcal>ftab). Hence the first order model proposed is adequate.
Table III: ANOVA table
Source SS df MS = SS/df Fcal Ftab*
1st order terms 0.01 3 0.002646 105.83 9.28
Lack of fit 0 5 0.000398 15.9 9.014
Expt. Error 0 3 0.000025 - -
Grand Total 0.01 11 0.000909 - -
*Ftab values are for 95% confidence level.
B. Additional tests for checking the adequacy of the
model:
Further treatment combinations of the factors were chosen randomly within the range of experimentation and tested to get the responses, which were compared with the predicted values. Typical cases are presented in Table 4. This shows that the proposed model is very much satisfactory to predict the effect of work piece rpm, feed and depth of cut, within the experimental range, on surface roughness of aluminium turned by a PCD tool on a CNC turning center.
Table IV: Additional test
Sr. No. n rpm f mm/min d mm Surface Roughness, Ra μm
Experimental Predicted* 1. 2700 4 0.06 0.06 0.06
2. 2200 8 0.08 0.07 0.07
3. 2000 5 0.12 0.06 0.06
*The predicted values are rounded off to match with the accuracy of the measuring instrument.
) 0 ( ) ( ) 0 ( ) ( i i i i
i
x
x
x
x
x
[image:3.612.317.570.578.672.2]International Journal of Emerging Technology and Advanced Engineering
Website: www.ijetae.com (ISSN 2250-2459, Volume 2, Issue 5, May 2012)44
V. CONCLUSION1. The fitted first order model is:
Ra=0.0505–4.1666*10-6*n+3.906*10-3*f+0.025d 3D representative surfaces depicting the effect of various machining variables are plotted in Figure 1, 2 & 3 considering Table 5, 6 & 7 respectively. The model shows that the depth of cut has the greatest effect on surface roughness and that an increase in the depth of cut increases the surface roughness and vice-a-versa. It also reveals that feed has significant effect on surface roughness values and work piece rpm has the least effect on the surface roughness.
[image:4.612.312.570.162.454.2]2. This work establishes the relative importance of the selected process parameters vis-à-vis surface roughness. According to their relative influence they can be arranged in the order of depth of cut, feed and work piece rpm. It helps to select the optimum combinations of various parameters within the experimental range.
Table V: Ra values at different depth of cut and feed for n = 3300 rpm
d 0.07 0.09 0.11 0.13 0.15 f = 6 0.0619 0.0624 0.0629 0.0634 0.0639
[image:4.612.48.289.375.496.2]8 0.0697 0.0702 0.0707 0.0712 0.0717 10 0.0775 0.0780 0.0785 0.0790 0.0795 12 0.0853 0.0858 0.0863 0.0868 0.0873 14 0.0931 0.0936 0.0941 0.0946 0.0951 16 0.1009 0.1014 0.1019 0.1024 0.1029 18 0.1088 0.1093 0.1098 0.1103 0.1108 20 0.1166 0.1171 0.1176 0.1181 0.1186
Table VI: Ra values at different work piece rpm and feed for d = 0.07 mm
n 1500 1800 2100 2400 2700 3000 3300 f
=6
0.069 0.068 0.066 0.065 0.064 0.063 0.061
8 0.077 0.075 0.074 0.073 0.072 0.070 0.069 10 0.085 0.083 0.082 0.081 0.080 0.078 0.077 12 0.092 0.091 0.090 0.089 0.087 0.086 0.085 14 0.100 0.099 0.098 0.096 0.095 0.094 0.093 16 0.108 0.107 0.105 0.104 0.103 0.102 0.100 18 0.116 0.115 0.113 0.112 0.111 0.110 0.108 20 0.124 0.122 0.121 0.120 0.119 0.117 0.116
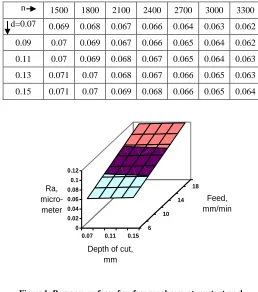
Table VII: Ra values at different work piece rpm and depth of cut for f = 6 mm/min
n 1500 1800 2100 2400 2700 3000 3300
d=0.07 0.069 0.068 0.067 0.066 0.064 0.063 0.062
0.09 0.07 0.069 0.067 0.066 0.065 0.064 0.062
0.11 0.07 0.069 0.068 0.067 0.065 0.064 0.063
0.13 0.071 0.07 0.068 0.067 0.066 0.065 0.063
0.15 0.071 0.07 0.069 0.068 0.066 0.065 0.064
0 0.02 0.04 0.06 0.08 0.1 0.12
Ra, micro-meter
0.07 0.11 0.15 6
10 14
18
Depth of cut, mm
Feed, mm/min
Figure 1: Response surface of surface roughness, at constant work piece rpm, n = 3300 rpm
0 0.02 0.04 0.06 0.08 0.1 0.12 0.14
Ra in micrometer
1500 2100 2700 3300 6
10 14
18
WORK PIECE rpm
[image:4.612.340.554.497.633.2]FEED in mm/min
[image:4.612.47.289.527.652.2]International Journal of Emerging Technology and Advanced Engineering
Website: www.ijetae.com (ISSN 2250-2459, Volume 2, Issue 5, May 2012)45
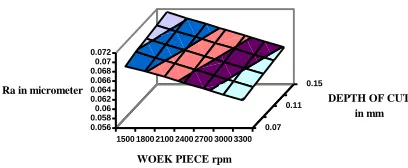
0.0560.058 0.06 0.062 0.064 0.066 0.068 0.07 0.072
Ra in micrometer
1500 1800 2100 2400 2700 3000 3300 0.07
0.11 0.15
WOEK PIECE rpm
[image:5.612.69.273.167.251.2]DEPTH OF CUT in mm
Figure 3: Response surface of surface roughness, at constant feed, f = 6 mm/min.
REFERENCES
[1] M.W. Cook, P.K. Bossom, Trends and recent developments in the material manufacture and cutting tool application of polycrystalline diamond and polycrystalline cubic boron nitride, International Journal of Refractory Metals & Hard Materials 18 (2000) 147-152, Elsevier.
[2] J.T. Lin, D. Bhattacharya, C. Lane, Machinability of silicon carbide reinforced aluminum metal matrix composite, Wear 181-183 (1995) 883-888.
[3] M. El-Gallab, M. Sklab, Machining of Al/SiC particulate metal matrix composites. Part I. Tool performance, J. Mater. Process. Technol. 83 (1998) 151-158.
[4] M. El-Gallab, M. Sklab, Machining of Al/SiC particulate metal matrix composites. Part II. Work piece surface integrity, J. Mater. Process. Technol. 83 (1998) 277-285.
[5] M. El-Gallab, M. Sklab, Machining of Al/SiC particulate metal matrix composites. Part III. Comprehensive tool wear models, J. Mater. Process. Technol. 101 (2000) 10-20.
[6] Box G. E. P., Multifactor Design of First Order, Biometrics, 39, 1952, pp. 49-57.
[7] Box G. E. P. and Wilson K. B., On the Experimental Attainment of Optimum Conditions, J1. Roy. Stat. Soc., Ser. B., Vol. 13, n.1, 1951, pp. 1-45.
[8] Box G. E. P. and Hunter J. S., Multifactor Experimental Designs for Exploring Response Surface, Ann. Math. Statist., 28, 1957, pp. 195-241.
[9] Montgomery, Douglas C., Design and Analysis of Experiments, John Wiley & Sons, Inc., New York, 1976, pp. 1-30, 180-198, 215-229, 239-263, 304-356.
[10]Cocharan William G. and Cox Gertrude M., Experimental Design, John Wiley & Sons, Inc. New York, 1957, pp. 1-43, 140-181, 244-292, 335-375.
[11]Kolarik W. J., Creating Quality Concepts, Systems, Strategies and Tools, McGraw Hill, Inc., New York, 1995, pp. 435-522, 532-564. [12]Hunter S. J., Barnett E. H. et al., Design and Analysis of