© 2017, IRJET | Impact Factor value: 5.181 | ISO 9001:2008 Certified Journal | Page 3151
Improved Performance Of Fuzzy Logic Algorithm For Lane Detection
Images
Tamanna
1, Arushi Bhardwaj
21M.Tech Scholar, Department of Electronics & Communication Engineering, Sri Sai College Of Engineering & Technology, Badhani, Pathankot, Punjab, India 2Assistant Professor, Department of Electronics & Communication Engineering, Sri Sai College Of Engineering & Technology, Badhani, Pathankot, Punjab, India
---***---Abstract
- This paper represents that lane coloration has become popular in real time vehicular adhoc system. Lane detection is normally helpful to localize path limits. Determine undesired lane variations and to enable approximation of the upcoming geometry of the road. There are different types of methods that are used for detecting lines i.e. Hough transform, clustering and curve fitting. The paper shows that Hough transform, clustering and curve fitting work efficiently, but problem is that may fail or not give efficient results when there are curved lane road images. The objective of this paper is to improve lane coloration algorithm by modifying the Hough transform i.e. fuzzy logic with different performance metrics to improve the accuracy. Extensive experiments have shown that proposed technique outperforms over the available techniques.
Key words:
Lane detection, Hough transform and Fuzzy logic.1.Introduction
Passenger's safety is probably one of the most formulated axes concerning exploration in automobile. The vast majority of the vehicle road crashes takes place because of the driver overlooking of the vehicle path so protection is the primary purpose of all of the lane detection methods. The majority of travelling deaths and injuries happen on the country’s highways. According to the fact, improper driving response, high speed as well as U-turn are the main causes behind majority of these incidents. Studies of these accident cases depict that 40% and more mishaps could have been eliminated if perhaps the vehicle had been designed with an alert system. The next generation of driver-assistant system are being developed by consumer analysis organizations, automobile manufacturers and suppliers, as well as other research institutions that will make it possible for vehicles to have more secure tendencies as well as to decrease road injuries and deaths. A computer perspective is involved as one of the primary technologies which become a powerful tool for detection of lanes [18]. Lane detection is normally helpful to localize road boundaries, determine undesired lane variations, and to enable approximation of the upcoming geometry of the road. At Present, two well defined techniques are there for performing lane recognition by making use of video i.e. feature based method and model based method [1, 9] Lane detection enables you to obtain the position as well as direction of the vehicle in addition lane information, as well as an area which includes highways is important to alert a driver associated with lane departure. The lane information is usually used for tracking down other motor vehicles as well as hurdles within the route of the vehicle and which could be placed on additional growth of the barrier avoiding system [7].
1.1 Hough Space:
There are various ways of representation of straight lines in 2D coordinate systems. In Cartesian coordinate system (CCS) straight line can be represented with the help of following equation:
y=m*x+c (1)
© 2017, IRJET | Impact Factor value: 5.181 | ISO 9001:2008 Certified Journal | Page 3152 Figure 1. Line in Cartesian coordinate system
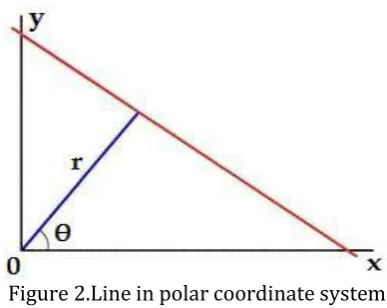
This is not a proper way of representation of straight lines, as vertical lines cannot be represented using this equation. This is because slope of line becomes infinite. So we use polar coordinate system for representation of straight lines for parameters (r,θ). Straight line using polar coordinate system can be represented with the help of following equation [4]:
y = ) *x+( (2) Where r = xcosθ+ysinθ (3)
Here r is the length of perpendicular to this line, starting from origin and θ is the orientation angle of r with respect to x axis. Figure 1.10 shows a line in polar coordinate system [4].
Figure 2.Line in polar coordinate system
1.2 Hough Transform:
© 2017, IRJET | Impact Factor value: 5.181 | ISO 9001:2008 Certified Journal | Page 3153 which lay on a direct point may be described by way of a connection, f, in a way that f((vh, e), (x, y)) = b – rhx = 0, (1).
Hough Transform Algorithm:
Require: {Binary Image}
Require: δ {Discretization step for the parameter space} 1: Votes ← 0 {Initialization of the voting matrix}
2: for each feature pixel I (x, y) do
3: for 0°≤ Ѳ ˂ 180°, using a δ Discretization step do 4: ρ ← x cos(Ѳ) + y sin(Ѳ)
5: Votes (ρ, Ѳ) ← Votes (ρ, Ѳ) + 1 6: end for
7: end for
1.3
Fuzzy Logic:
Fuzzy logic idea is usually than the man being's sensation in addition to inference process. As opposed to established management approach, that really is a point-to-point management, hairy judgement management is a range-to-point and also range-to-range control. The particular creation of any hairy controlled comes from fuzzifications associated with either inputs in addition to components making use of the connected member functions. The crisp and clean feedback might be changed to unique members of the particular connected member features predicated upon it's value. Using this point of view, the particular creation of any hairy judgement controlled can be launched upon it's memberships of various member features, that is thought of as several different inputs.To implement fuzzy logic technique to a real application requires the following three steps:
1. Fuzzifications – convert common information or perhaps highly detailed information directly into hairy information or perhaps Member Functions (MFs).
2. Fuzzy Inference Process – put together account features while using the manage procedures so that you can get the particular unclear output.
3. Defuzzification - apply several methods to estimate every associated outcome plus insert them in to the table: your research table. Grab your outcome in the research table on such basis as today's input during an application.
Fig 6: Fuzzy Controller [9] Preprocessing Fuzzification
Rule Base Inference Engine
© 2017, IRJET | Impact Factor value: 5.181 | ISO 9001:2008 Certified Journal | Page 3154
2.Related work
© 2017, IRJET | Impact Factor value: 5.181 | ISO 9001:2008 Certified Journal | Page 3155
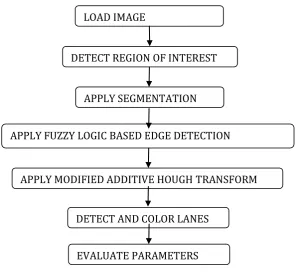
3.PROPOSED METHODOLOGY
Fig 1: Proposed Methodology
4.Experimental results
For experimentation and implementation the proposed technique is evaluated using MATLAB tool u2013a. Here we compare the lane colorization algorithm i.e. Hough transform with additive Hough transform for removing noise from the images on the basis of various image quality evaluation parameters like recall, f-measure, p_recall and bit error rate. The existing methodology give good results which locate your ln corners with virtually no previous expertise on the highway geometry, in addition to do it within cases for you might be a many chaos inside the highway photograph Thus it becomes a major issue when noise is present in the input image. The proposed approach gives efficient results in improving the existing Lane colorization algorithm. The particular tabular in addition to graphic contrast is accomplished in between established in addition to consist of method based on variables area under curve, g_accuracy,p_f measure and bit classification rate (BER) in addition to little bit oversight rate.
[image:5.595.79.519.607.715.2]
Fig 3: Input Image Fig 3 a) Existing result Fig 3 b) Proposed result LOAD IMAGE
APPLY SEGMENTATION DETECT REGION OF INTEREST
APPLY FUZZY LOGIC BASED EDGE DETECTION
APPLY MODIFIED ADDITIVE HOUGH TRANSFORM
DETECT AND COLOR LANES
© 2017, IRJET | Impact Factor value: 5.181 | ISO 9001:2008 Certified Journal | Page 3156 Fig 4: Input Image Fig 4 a) Existing result Fig 4 b) Proposed result
1.Area under curve:The area under a curve between two points can be found by doing a definite integral between
[image:6.595.74.562.47.223.2]the two points. To find the area under the curve y = f(x) between x = a and x = b, integrate y = f(x) between the limits of a and b. Areas under the x-axis will come out negative and areas above the x-axis will be positive.
Fig 5: Performance Analysis of Area Under Curve
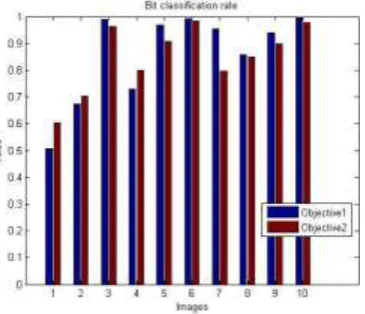
[image:6.595.209.392.521.678.2]2.Bit Classification Rate (BCR): Bit classification allows efficient selection and classification codes for each bit are generated by placing the bit style into the category that best describes it so that similar bit types are grouped within a single category.
Fig 6: Performance Analysis of Bit Classification Rate
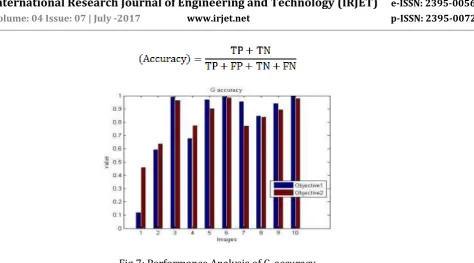
© 2017, IRJET | Impact Factor value: 5.181 | ISO 9001:2008 Certified Journal | Page 3157 Fig 7: Performance Analysis of G_accuracy
It showing that the increase in the accuracy by using lane images based on proposed additive Hough transform over the existing technique.
4 . P_F Measure: It is defined as the harmonic mean of sensitivity and specificity. Senstivity measures the proportion of positives that are correctly identified as such (i.e. the percentage of sick people who are correctly identified as having the condition). Specificity measures the proportion of negatives that are correctly identified as such (i.e., the percentage of healthy people who are correctly identified as not having the condition).
Fig 8: Performance Analysis of P F measure
5.conclusion
[image:7.595.194.405.454.615.2]© 2017, IRJET | Impact Factor value: 5.181 | ISO 9001:2008 Certified Journal | Page 3158 transform and Fuzzy Logic by using various parameters area under curve, g_accuracy,p_f measure and bit classification rate (BCR). The proposed technique has been designed and implemented in Matlab 2010a by using image processing toolbox. The performance evaluation has shown the improvement in proposed work as compared to the existing.
References
[1] Lin, Qing, Youngjoon Han, and Hernsoo Hahn. "Real-time lane departure detection based on extended edge-linking algorithm" IEEE Second International Conference onComputer Research and Development,pp. 725-730, May 2010.
[2] Kasai, Tatsuya, and Kazunori Onoguchi. "Lane Detection System for Vehicle Platooning using Multi-information Map”IEEE 13th International Conference on, Intelligent Transportation Systems (ITSC), pp. 1350-1356, Sep 2010. [3] Guo, Chunzhao, Seiichi Mita, and David McAllester. "Lane detection and tracking in challenging environments based on a weighted graph and integrated cues" IEEE/RSJ International Conference on Intelligent Robots and Systems (IROS),pp. 5543-5550, Oct2010.
[4] He, Jia, HuiRong, Jinfeng Gong, and Wei Huang. “A lane detection method for lane departure warning system" IEEE International Conference on Optoelectronics and Image Processing (ICOIP), vol. 1, pp. 28-31, Nov2010.
[5] Leng, Yu-Chi, and Chieh-Li Chen. “Vision-based lane departure detection system in urban traffic scenes" IEEE 11th International Conference on control Automation Robotics & Vision (ICARCV), pp. 1875-1880, Dec 2010. [6] Chen, Yong, Mingyi He, and Yifan Zhang. "Robust lane detection based on gradient direction" IEEE 6th Conference onIndustrial Electronics and Applications (ICIEA),pp. 1547-1552, June 2011.
[7]Saeedi Xiaoyun, Wang, Wang Yongzhong, and Wen Chenglin. "Robust lane detection based on gradient-pairs constraint" IEEE 30th Chinese Control Conference (CCC),pp. 3181-3185, July2011.
[8] Li, Jian, XiangjingAn, and Hangen He."Lane Detection Based on Visual Attention"IEEE Sixth International Conference on Image and Graphics (ICIG),pp. 570-575, Aug 2011.
[9] Keyou, Guo, Li Na, and Zhang Mo. "Lane detection based on the random sample consensus" IEEEInternational Conference on Information Technology, Computer Engineering and Management Sciences (ICM), vol. 3,pp. 38-41,Sep 2011.
[10] Li, Hao, and FawziNashashibi. "Robust real-time lane detection based on lane mark segment features and general a priori knowledge" IEEE International Conference on Robotics and Biomimetics (ROBIO), pp. 812-817, Dec2011.
[11] Kang Deusch, Hendrik, Jürgen Wiest, Stephan Reuter, Magdalena Szczot, Marcus Konrad, and Klaus Dietmayer. "A random finite set approach to multiple lane detection" IEEE15th International Conference on Intelligent Transportation Systems (ITSC),pp. 270-275, Sep2012.
[12] Singh, Rajandeep, and Prabhdeep Singh. "Integrated Lane Colorization Using Hough Transformation and Bilateral Filter."International Journal of Engineering Sciences & Research Technology,Oct 2013, pp.
[13] Cassisi, Carmelo, Alfredo Ferro, Rosalba Giugno, Giuseppe Pigola, and Alfredo Pulvirenti. "Enhancing density-based clustering: Parameter reduction and outlier detection." Information Systems 38, no. 3 (2013): 317-330. [14] Wu, Pei-Chen, Chin-Yu Chang, and Chang Hong Lin. "Lane-mark extraction for automobiles under complex conditions." Pattern Recognition 47, no. 8 (2014): 2756-2767.
[15] Niu, Jianwei, Jie Lu, Mingliang Xu, Pei Lv, and Xiaoke Zhao. "Robust Lane Detection using Two-stage Feature Extraction with Curve Fitting." Pattern Recognition 59 (2016): 225-233.
[16] Lin, Liang, Xiaolong Wang, Wei Yang, and Jian-Huang Lai. "Discriminatively trained and-or graph models for object shape detection." IEEE Transactions on pattern analysis and machine intelligence 37, no. 5 (2015): 959-972.
[17] Niu, Jianwei, Jie Lu, Mingliang Xu, Pei Lv, and Xiaoke Zhao. "Robust Lane Detection using Two-stage Feature Extraction with Curve Fitting." Pattern Recognition 59 (2016): 225-233.