Validating Biosecurity Principles for Indigenous Chicken
Scale
Fredrick Onyango Aila
1,*, Dr. Isaac Ochieng
2, Dr. David Oima
11Maseno University, Kenya 2Laikipia University, Kenya
*Corresponding Author: [email protected], [email protected]
Copyright © 2013 Horizon Research Publishing All rights reserved.
Abstract
Indigenous chicken are populous in most developing countries, supporting the livelihoods of many rural folks yet are produced under very low or no biosecurity principles, leading to low productivity. Consumers on the contrary, exhibit high preferences for indigenous chicken. The research question was: what are the consumer attitudes on biosecurity principles for indigenous chicken? The aim of the study was to validate a psychometric scale to measure consumer attitudes on biosecurity principles for indigenous chicken. The sub-aims were to reduce scale so it clearly measures the constructs and to test one hypothesis: H0: There are no significant consumer attitudes on biosecurity principles for indigenous chicken in Kisumu City, Kenya. Starting from a 74-item with 4:1 subject to item ratio biosecurity principles for indigenous chicken scale constructed using Fishbein’s Multiattribute model, the hypothesis was tested on pilot data gathered from 300 students of a large university in Kisumu County, Kenya using maximum likelihood factor analysis. Reliabilities for each biosecurity principle ranged from 𝛼𝛼 = .817 to 𝛼𝛼 = .817 respectively. Initial KMO were low ranging between .519 to .595 but improved significantly after refining the scale. Only one factor was extracted from each principle based on theory. Each extracted factor explained variances ranging from 25.099% to 34.307% respectively, though <50 percent. A total of 37 items loaded on these four factors with respect to the four biosecurity principles. The factor matrices for each extracted factor were significant at 𝑝𝑝 = .000 and 𝑝𝑝 < .05 respectively. Thus the null hypothesis was rejected. The results can further be confirmed in subsequent studies.Keywords
Maximum Likelihood, Exploratory Factor Analysis, Principal Component Analysis, Fishbein Multi-Attribute Model, Biosecurity Principles, Perceived Benefits, Perceived Concerns1. Introduction
Indigenous chicken are populous in most developing
countries and supports the livelihoods of many rural folks (Sonaiya and Swan, 2004). They are produced under very low or no biosecurity principles (Nyaga, 2007a) which is a major challenge for the sub-sector (Okeno, Kahi and Peters, 2010). Hence, their productivity is very low (Omiti, 2011). Consumers on the contrary, exhibit high preferences for indigenous chicken. They are willing to pay a premium price for it (Bett et al., 2011). This high preference, given very low levels of indigenous chicken biosecurity, is paradoxical (Aila, 2012). Little research on consumer attitudes on biosecurity principles for indigenous chicken is available. The research question was: what are the consumer attitudes on biosecurity principles for indigenous chicken? The aim of the study was to validate a psychometric scale to measure consumer attitudes on biosecurity principles for indigenous chicken. The sub-aims were to reduce scale so it clearly measures the constructs and to test one hypothesis: H0: There are no significant consumer attitudes on biosecurity principles for indigenous chicken in Kisumu City, Kenya.
Fishbein Multi-Attribute Model (Fishbein and Ajzen, 1975) can aid in constructing consumer attitudes. It is well recognized as an established framework for explaining attitude, intention and choice. It has widespread acceptance for use in consumer research and for its values in explicating attitudes (Agarwal and Malhotra, 2005; Kim, 2009). In measuring attitudes, one should locate the subject on bipolar affective or evaluative dimension on a given object (Fishbein and Ajzen, 1975).
Biosecurity is a relatively new word in common vocabulary and is not found in many dictionaries and thesauri. Its broad meaning is the literal safety of living things, or the freedom from concern of sickness or disease (Amass and Clark, 1999). It is security from transmission of infectious diseases, parasites and pests to a poultry production unit (Permin and Detmer, 2007); and the implementation of policies and procedures that prevent the introduction and spread of disease (Nyanga, 2007a).
indigenous chicken production (Nyaga, 2007b). Consumer attitudes for indigenous chicken have been proposed (Aila et al., 2012) but have not been validated so far.
Exploratory factor analysis can be used to validate new scales (Costello and Osborne, 2005). The most commonly used exploratory factor analysis technique is Principal Component Analysis (PCA) (Chukwuone et al. 2006; Akinnagbe, 2010; Hair et al., 2010). PCA has however been criticized for not being a factor analysis technique at all despite its common usage (Fabrigar et al, 1999). Maximum likelihood, principal factors, and iterative principal factors have been proposed as better alternatives to PCA in factor extraction (Costello and Osborne, 2005). Maximum Likelihood Factor Analysis has particularly been proposed to be a superior exploratory factor analysis technique as it allows for the computation of a wide range of indexes of the goodness of fit of the model (Fabrigar et al., 1999). These fit measures are intended to assess the degree to which a given model provides an approximation of observed correlations and covariances.
2.
Methodology
Starting from a 74 item biosecurity principles for indigenous chicken scale (Aila et al., 2012) constructed using Fishbein’s Multiattribute Model (Fishbein and Ajzen, 1975), a descriptive study to validate the scale was designed. The respondents were asked to express their beliefs and levels of agreement measured on a Likert scale, with scores typically anchored at the extremes 1 and 7 where 1=Strong disagree, 2=Disagree, 3=Somewhat disagree, 4=Neither agree or disagree, 5=Somewhat agree, 6=Agree, and 7=Strongly agree (Vagias, 2006; Caracciolo et al., 2011). The reconstructed instrument was administered on 300 students of a large university campus in Kisumu County,
Kenya (Brooker, 1975; Nunnaly, 1978; De Vallis, 1991; Lee et al., 1997; Sow and Grongnet, 2010). Bahia and Nantel (2000) used 300 students to validate their scale. Respondents were selected using systematic sampling technique (Saunders et al., 2003). The data were analyzed using descriptive statistics to exhibit their exploratory capacity. Factors were extracted using maximum likelihood (ML) exploratory factor analysis (Costello and Osborne, 2005). Theoretically, the set of items under each biosecurity principle represented one factor. Thus, the number of factors to be retained was determined a priori. Given the choice of ML, the oblique rotation was performed.
3. Results and Discussion
The response was impressive at 100% with females being 23% (𝑛𝑛 = 300) of respondents. The ages of the respondents were below 20 years-22%, 21-30 years 74% and the rest 4% (𝑛𝑛 = 300) respectively. The sample size was adequate for using factor analysis (Nunnaly, 1978; DeVallis, 1991; Bahia and Nantel, 2000; Labar, 2008; Kulscasr, 2010). The subject to item ratio was 4:1 within the range of acceptability (Castello and Osborne, 2005). Majority of exploratory factor analysis studies in their survey (62.9%, 𝑁𝑁 = 303) had researchers perform analyses with subject to item ratios of 10:1 or less, which is a prevalent rule of the thumb (Castello and Osborne, 2005).
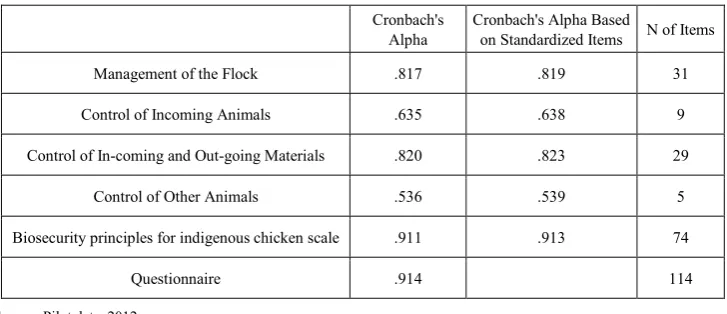
[image:2.595.123.487.529.686.2]The questionnaire had a reliability of 𝛼𝛼 = .914 for all 114 items. The biosecurity principles for indigenous chicken scale had a reliability of 𝛼𝛼 = .911 for its 74 items. Each biosecurity principle had an acceptable reliability (management of the flock, 𝛼𝛼 = .817; control of other animals, 𝛼𝛼 = .635; control of in-coming and out-going materials, 𝛼𝛼 = .820 and control of other animals, 𝛼𝛼 = .536) respectively as shown in Table 1 below.
Table 1. Reliability Statistics Cronbach's
Alpha Cronbach's Alpha Based on Standardized Items N of Items
Management of the Flock .817 .819 31
Control of Incoming Animals .635 .638 9
Control of In-coming and Out-going Materials .820 .823 29
Control of Other Animals .536 .539 5
Biosecurity principles for indigenous chicken scale .911 .913 74
Questionnaire .914 114
Source: Pilot data, 2012.
Table 2. Summary Item Statistics
Mean Minimum Maximum Range Maximum / Minimum Variance N of Items
Item Means 4.654 3.772 5.479 1.707 1.452 .161 74
Inter-Item Correlations .124 -.422 .730 1.152 -1.731 .023 74
Source: Pilot data, 2012
Table 3. Scale Statistics
Mean Variance Std. Deviation N of Items
344.36 3369.650 58.049 74
Source: Pilot data, 2012.
[image:3.595.78.531.342.460.2]Kaiser-Meyer-Olkin (KMO) measure of sampling adequacy 𝐾𝐾𝐾𝐾𝐾𝐾 = .247 and Bartlett’s test of sphericity 𝑥𝑥2= 25479.569 df = 2701 (p = .000) were performed to test the factorability of the scale. Found that the scale as a whole had low factorability. Thus, we opted to perform similar tests for each biosecurity principle. Each biosecurity principle was found to be factorable as shown in Table 4 below. For each biosecurity principle, KMO was >.5 which is interpreted as miserable (George and Mallery, 2009). The Bartlett’s test of sphericity for each principle was significant at p = .000 signifying construct validity (Roberts-Lombard, 2013) as shown in Table 4 below.
Table 4. KMO and Bartlett's Test at the Beginning
Scale Management of the Flock Control of Incoming Animals
Control of In-coming and
Out-going Materials
Control of Other Animals
Kaiser-Meyer-Olkin Measure of Sampling
Adequacy. .247 .595 .592 .583 .519
Bartlett's Test of Sphericity
Approx. Chi-Square 25479.569 4615.901 579.568 3814.877 174.844
Df 2701 496 36 406 10
Sig. .000 .000 .000 .000 .000
Source: Pilot data, 2012
[image:3.595.72.535.605.708.2]After several iterations, the following results were produced using ML extraction method and oblique rotation. The 74 item instrument was refined to produce a more parsimonious 37 item scale. Management of the flock extracted one factor represented by 13 items explaining 29.374% of total variance. Control of incoming animals extracted one factor represented by 6 items explaining 28.458% of total variance. Control of incoming and outgoing materials extracted one factor represented by 14 items. This explained 25.099% of total variance. Lastly, control of other animals extracted one factor represented by 4 items explaining 34.307% of total variance. The KMO of the refined scale for respective biosecurity principles showed marked improvements. Both management of the flock and control of incoming and outgoing materials had KMO improving from >.5 to >.7 respectively. Control of incoming animals showed KMO improve from >.5 to >.6 while control of other animals remained at KMO>.5 (see Table 5 below).
Table 5. KMO and Bartlett's Test after Factor Extractions
Management of the
Flock Incoming Animals Control of
Control of In-coming and
Out-going Materials
Control of Other Animals
Kaiser-Meyer-Olkin Measure of Sampling Adequacy. .773 .641 .735 .573
Bartlett's Test of Sphericity
Approx. Chi-Square 1564.242 354.197 1312.041 135.127
Df 91 15 406 6
Sig. .000 .000 .000 .000
Source: Pilot data, 2012
variance explained was below 50 percent. Fig. 2 and 4 below show that more than one factor should have been extracted.
Figure 1. Management of the Flock (Variance explained=29.374%
[image:4.595.152.469.421.627.2]Figure 3. Control of incoming and outgoing materials (Variance explained=25.099%)
Figure 4. Control of other animals (34.307%)
Appendix 1-4 below presents the factor matrices for each of the four biosecurity principles. In Appendix 1, the 13 item factor matrix of management of the flock is presented. All items have factor loadings >.30 and the scale is significant at 𝑥𝑥2= 624.868 df = 77 (p = .000) (Table 6 below). Factor loadings ranged from .311 to .740 respectively. “Observing
[image:5.595.147.475.405.649.2]a perceived benefit had the lowest factor loading. Both “Most farmers raise flocks using home-grown skills” (.353);
“Attendants wear domestic cloths while on duty without protective head gears and footwear” (.366) and
“Non-vaccinated flocks tend die of diseases such as Newcastle Disease (NCD)” (.588), the only biosecurity concerns extracted loaded lowly to moderately on the factor. Appendix 2 presents the factor matrix of six control of incoming animals principle. Four items had factor loadings >.30 whiles the remaining two less than it. “Use of appropriate disinfectants in the hatchery and in the brooding house minimizes disease occurrence” (.742) and
“Separately brooding indigenous chicks (chicks alone or chicks together with mother hen) for at least three weeks of their life ensures their adaptability to their new environment”
(.812) had strong loadings on the factor. These two biosecurity protocols if observed are beneficial as they ensure survivability of new flocks (Okeno, Kahi and Peters, 2010). “Day old chicks are not exposed to dirty environments” (.225) and “Clean beddings are provided for brooding hens” (.226) loaded lowly on this factor. These items were negatively scored. In theory, day old chicks are exposed to dirty environments; moreover, no clean beddings are given to brooding hens among indigenous chickens (Nyaga, 2007b). Inclusion of these two items in the final scale was justified on the basis of the overall fit of the factor model. Deleting either or both of these factors would have yielded an insignificant goodness of fit. With their inclusion, the factor was significant at 𝑥𝑥2= 96.947 df = 9 (p = .000) (Table 6 below).
Appendix 3 presents the factor matrix of 14-item control of incoming and outgoing materials. Only two items loaded highly on the factor. These are “The small proportion that does not get inspected may need to be identified and be brought into the inspection loop” (.631) reflecting a biosecurity concern and “Identifying clean and dirty processes in the farm, sales and slaughtering processes so as to avoid contaminating clean areas is logical” (.610) reflecting a biosecurity benefit. A total of 11 items loaded moderately on the factor: >.400 six and >.5 five respectively. One item loaded lowly on the factor at >.3, that is “The traders themselves act as sources of infectious agents” (.319) which represented a biosecurity concern. All these 14 items were significant at 𝑥𝑥2= 630.834 df = 77 (p = .000) (Table 6 below).
Appendix 4 presents the 4-item factor matrix for control of other animals principle. One item “As birds scavenge they interact with several disease carrying agents” (.983) loaded so highly on the factor as it was a major biosecurity concern (Nyaga, 2007b; Onim, 2002; Kagira and Kayari, 2010; Bird Life International, 2013). The rest loaded very lowly to moderate. In fact, one item, “While on transit, the birds are either exposed to the atmosphere or are in contact with humans” (.281) had a loading <.300 and should have been deleted. Deleting this item would have improved the factor loadings (see Fig. 4 above) but rendered the factor
[image:6.595.312.553.140.291.2]insignificant. Retaining it yielded a significant goodness of fit 𝑥𝑥2= 9.842 df = 2 (p = .007) (See Table 6 below). The 𝑥𝑥2was significant at p < .05 confirming that all four items significantly tapped on the factor.
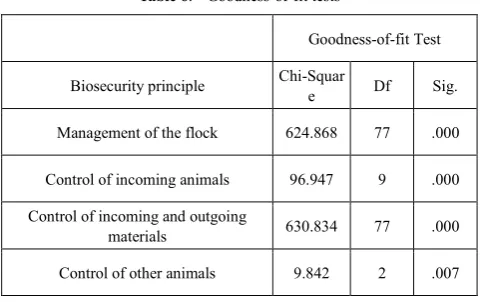
Table 6. Goodness-of-fit tests
Goodness-of-fit Test
Biosecurity principle Chi-Square Df Sig.
Management of the flock 624.868 77 .000
Control of incoming animals 96.947 9 .000
Control of incoming and outgoing
materials 630.834 77 .000
Control of other animals 9.842 2 .007
Source: Pilot data, 2012
From the analysis presented above, the goodness-of-fit test (see Table 6 above) was used to test the hypothesis:
H0: There are no significant consumer attitudes on
biosecurity principles for indigenous chicken in Kisumu City, Kenya.
Each of the biosecurity principles had significant factor matrices for each factor representing a biosecurity principle. Thus the null hypothesis was rejected and the alternate accepted.
4. Conclusion
The study set to validate a psychometric scale to measure consumer attitudes on biosecurity principles for indigenous chicken. There were twin sub-aims: to reduce scale so it clearly measures the constructs and to test one hypothesis. Using pilot data, with 4:1 subject to item ratios, the 74-item scale was reduced to a more parsimonious 37-item scale using maximum likelihood exploratory factor analysis. The variance explained by each single factor representing respective biosecurity principle was rather low <50 percent. Observing the scree plots, biosecurity principles that had large number of items >20, extracted a single factor that explained the largest variance. The principles with <10 items did not significantly extract a single factor. Further deletions could have produced stronger single factors. The null hypothesis, H0: There are no significant consumer attitudes
on biosecurity principles for indigenous chicken in Kisumu City, Kenya was rejected as the goodness-of-fit tests revealed that respective factor matrices for biosecurity principles was significant at p = .000 and p < .05 respectively. Thus, the alternative hypothesis H1: There are significant consumer
APPENDIX 1: Management of the Flock Factor Matrix
aManagement of the Flock Factor
1
Farmers grouped in farmer associations tend to vaccinate their flocks routinely. .581
Non-vaccinated flocks tend die of diseases such as Newcastle Disease (NCD). .588
A disinfectant dip placed at the door of each house can prevent entry of diseases agents into the flock house. .568 Poultry houses facilitate parasite and disease control. They promote faster growth and protect the chicken from predatory birds and animals
and adverse weather conditions and theft during the night as well as during the day time. .483 Clothes dedicated for handling chicken worn in the poultry house would reduce chances of entry disease into the flock houses. .460 Training in good husbandry practices for all poultry farmers can improve biosecurity measures markedly. .556 A program of educating farmers on the role and usefulness of isolation and other biosecurity measures can be developed and implemented .565 Observing regular personal hygiene such as washing of hands, and use of clean or dedicated clothes and shoes is a beneficial practice. .740 Clothes dedicated for handling chicken, which may not necessarily be new, should be provided for use exclusively in the flock houses. .589 There are adequate feeding troughs and watering equipment for all birds in the poultry house. .332
Attendants wear domestic cloths while on duty without protective head gears and footwear. .366
Most farmers raise flocks using home-grown skills. .353
Isolating flocks from situations that expose them to diseases is preventive in nature. .311 Extraction Method: Maximum Likelihood.
a. 1 factors extracted. 5 iterations required.
Source: Pilot data, 2012
APPENDIX 2: Control of Incoming Animals Factor Matrix
aControl of incoming animals Factor
1
Day old chicks are not exposed to dirty environments .225
Clean beddings are provided for brooding hens. .226
Laying nests are provided for layer birds. .329
Protocols and procedures in the hatcheries if monitored regularly can assure they supply clean day old chicks free from bacterial and
viral agents that may emanate from hatcheries. .535
Use of appropriate disinfectants in the hatchery and in the brooding house minimizes disease occurrence. .742
Separately brooding indigenous chicks (chicks alone or chicks together with mother hen) for at least three weeks of their life ensures
their adaptability to their new environment. .812
Extraction Method: Maximum Likelihood.
a. 1 factors extracted. 5 iterations required.
APPENDIX 3: Control of In- and Out-going Materials Factor Matrix
aControl of In- and Out-going Materials Factor
1
Feeds often get contaminated at its administration by fecal matter/chicken droppings containing disease agents. .452
Manure and slaughter wastes are disposed on the farm. These are accessible to both domestic and wild animals. .524
Risks of disease causing agents are inherent within the trade cycle. .482
For farm-, market- or restaurant-slaughtered birds, the concern is on where and how the waste water, feathers and offals, which may lead
to spreading of disease, are disposed. .423
The traders themselves act as sources of infectious agents. .319
The risks at the slaughtering process are many e.g. dry defeathering scatters feathers all over the sales areas at the local markets. .481 For wet defeathering, the disposal of waste water, the offals, the feathers and the presence of worn out cement floors, the presence of bird
cages and storage of personal effects in the cages that also held chickens poses a big risk. .523 Indigenous chicken sold in live markets, slaughtered at market-, restaurant-, home-backyard are seldom inspected. .517
There is no formal inspection carried out for eggs except grading. .517
Poultry feed that is free from disease agents should be kept in a clean, dry store free from rodents and insect pests. .580
A disinfectant dip at the entrance to the flock houses keeps at bay pathogens and prevents from escaping into or out of the poultry house. .405
Use of disinfectants to decontaminate materials and equipment that has gone to the market before it is re used at the farm is prudent. .461
Identifying clean and dirty processes in the farm, sales and slaughtering processes so as to avoid contaminating clean areas is logical. .610
The small proportion that does not get inspected may need to be identified and be brought into the inspection loop. .631
Extraction Method: Maximum Likelihood.
a. 1 factors extracted. 4 iterations required.
Source: Pilot data, 2012
APPENDIX 4: Control of Other Animals Factor Matrix
aCONTROL OF OTHER ANIMALS
Factor1
As birds scavenge they interact with several disease carrying agents. .983
Wild birds’ attractants (spilled feeds, open water spots, dead carcasses) are seldom removed from the poultry compound. .379
While on transit, the birds are either exposed to the atmosphere or are in contact with humans. .281
There is evidence of domestic birds mixing with wild birds. .427
Extraction Method: Maximum Likelihood.
a. 1 factors extracted. 22 iterations required.
Source: Pilot data, 2012
REFERENCES
Odera (2012). Construction and validation of consumer attitudes on biosecurity principles: A methodological perspective. Research on Humanities and Social Sciences, Vol.2, No.6, 2012 ISSN 2224-5766(Paper) ISSN 2225-0484(Online) pp240-250.
[3] Akinnagbe, OM. (2010). Constraints and strategies towards improving cassava production and processing in Enugu North Agricultural Zone of Enugu State, Nigeria. Bangladesh J. Agril. Res. 35(3) pp387-394.
[4] Amass, SF., & KL. Clark (1999). Biosecurity considerations for pork production units. Swine Health Prod. 7(5) pp.217-228.
[5] Bahia, K. & J. Nantel (2000). A reliable and valid measurement scale for the perceived service quality of banks, International Journal of Bank Marketing, vol 18 no. 2 pp84-91.
[6] Bett, H., Peters, K., Nwankwo, U., & W. Bokelmann (2011). Estimating consumer preferences and willingness to pay for the underutilised indigenous chicken products. Tropentag, October 5-7, 2011, Bonn accessed from http://www.tropentag.de on 2/6/12.
[7] Bird Life International (2013). East Asia/East Africa Flyway. Retrieved on 22 February 2013 from http://www.birdlife.org/datazone/userfiles/file/sowb/flyways /6_East_Asia_ East_Africa_Factsheet.pdf.
[8] Brooker, B. (1975). An Instrument to Measure Consumer Self-Actualization. in Schlinger, MJ., A. Abor, eds. Advances in Consumer Research Volume 02, Association for Consumer Research, Pages: 563-576.
[9] Caracciolo, F., Coppola, A. & F. Verneau (2011). Validation of a psychometric scale to measure consumers’ fears of modern food technologies. International European Forum on System Dynamics and Innovation in Food Networks, International European Forum, February 14-18, 2011, Innsbruck-Igls, Austria. [Accessed on 1 April 2012] http://purl. umn.edu/122005. pp160-174.
[10] Chukwuone, NA., Agwu, AF., & N. Ozor (2006). Constraints and strategies towards effective cost-sharing of agricultural technology delivery in Nigeria: Perceptions of farmers and agricultural extension personnel. Journal of International Agricultural and Extension Education, Vol. 13(1) pp29-41.
[11] Costello AB. And JW. Osborne (2005).Best practices in exploratory factor analysis: Four recommendations for getting the most from your analysis. Practical Assessment Research & Evaluation, Vol. 10, No. 7. pp1-8
[12] DeVellis, RF. (1991). Scale development: Theory and applications. Newbury Park, CA: Sage, p. 85.
[13] Fabrigar, LR., DT. Wegener, RC. MacCallum, and EJ. Strahan (1999). Evaluating the use of exploratory factor analysis in psychological research. Psychological Methods, Vol. 4. No. 3 pp 272-299.
[14] Fishbein M. & I. Ajzen (1975). Belief, attitude, inten¬tion and behavior: An introduction to theory and research. Addison-Wesley Publishing, Reading (MA).
[15] George, D. & P. Mallery (2009). SPSS for Windows step by step: A simple guide and reference 16.0 update, 9th ed. Boston: Pearson.
[16] Hair, JF. Jr., Black, WC., Babin, BJ., & RE. Anderson (2010). Multivariate data analysis: A global perspective, 7th Edn, , Upper Saddle River, New Jersey: Pearson.
[17] Kagira, JM. and Kanyari, PWN. (2010). Questionnaire survey on urban and peri-urban livestock farming practices in Kisumu municipality, Kenya. Journal of the South African Veterinary Association, 81(2): 82–86 (En.). Trypanosomiasis Research Centre, Kenya Agricultural Research Institute, PO Box 362, Kikuyu, Kenya.
[18] Kim, RB. (2009). Factors influencing Chinese consumer behavior when buying innovative food products. Agric. Econ. – Czech, 55, 2009 (9): 436–445.
[19] Kulcasr, E. (2010). Principal component analysis in tourism marketing. Management and Marketing, Vol. 5 (2). Pp151-158.
[20] Labar, AV. (2008) SPSS for education, Polirom: Iasi. [21] Lee, MS., Sandler, DM. & D. Shani (1997). Attitudinal
constructs towards sponsorship: Scale development using three global sporting events. International Marketing Review, Vol. 14 no.3 pp. 159 – 169.
[22] Meat Control Act (2012). Meat Control (Poultry Meat Inspection) Regulations, 1975, in Meat Control Act, Cap 356, Laws of Kenya, Kenya Law Reports. Retrieved on 5/6/2013 from www.kenyalaw.org
[23] Nunnally, JC. (1978). Psychometric theory. New York: McGraw-Hill Book Company.
[24] Nyaga, P. (2007a). The structure, marketing and importance of the commercial and village poultry industry: An analysis of the poultry sector in Kenya. Rome, Food and Agriculture Organization (FAO) of the United Nations.
[25] Nyaga, P. (2007b). Good biosecurity practices in small scale commercial and scavenging production systems in Kenya. Rome, Food and Agriculture Organization (FAO) of the United Nations.
[26] Okeno, T.O., Kahi, A.K. & J.K. Peters (2010). Characterization of indigenous chicken production systems in Kenya: Household flock structure, dynamics and breeding practices. Proceedings of the 12th KARI Biennial Scientific Conference, Kenya Agricultural Research Institute.
[27] Omiti, J. (2011). Poultry farming hits a wall in Kenya. Retrieved from www.poultrypro. com/africa/poultry on March 30, 2011.
[28] Onim, M. (2002). Final report of scoping study for urban and peri-urban livestock keepers in Kisumu City, Kenya. Lowland Agricultural and Technical Services Limited (Lagrotech), Kisumu, Kenya.
[29] Permin, A. & A. Detmer (2007). Improvement of management and biosecurity practices in smallholder producers. Rome: Food and Agricultural Organization of the United Nations.
[30] Roberts-Lombard Mornay, Lauren Strachan and Leon du Plessis (2013). The influence of trust, commitment and conflict-handling on customer loyalty: a parallel investigation.
Journal of Economic and Financial Sciences | JEF | 6(1), pp. 195-216.
methods for business students, 3rd ed. London: Prentice Hall-Financial Times.
[32] Sonaiya, EB. & SEJ. Swan (2004). Small-scale poultry production: Technical guide. FAO Animal Production and Health. Rome: Food and Agriculture Organization of the United Nations.
[33] Sow, TMA. & JF. Grongnet (2010). Sensory characteristics and consumer preference for chicken meat in Guinea, Poultry Science, 89:2281–2292.