Journal of Chemical and Pharmaceutical Research, 2012, 4(3):1708-1715
Research Article
ISSN : 0975-7384
CODEN(USA) : JCPRC5
Influence of additives on Fabrication and Release from
Protein loaded PLGA microparticles
Yagnesh Bhatt* and Dushyant Shah
A.P.M.C. College of Pharmaceutical Education and Research, Himmatnagar, Gujarat, India
______________________________________________________________________________
ABSTRACT
The purpose of this study was to investigate the effect of additives, poly(ethylene glycol) (PEG) 1450, poloxamer 407, polyvinyl alcohol (PVA) and Sodium chloride (NaCl) in order to improve physico-chemical characteristics, encapsulation efficiency and in vitro release of a bovine serum albumin (BSA), form poly(D,L-lactic-co-glycolic acid) microparticles prepared by the w/o/w solvent evaporation method. The addition of PEG 1450 and 0.05 M NaCl changed the surface characteristics of microparticles and also affect the encapsulation efficiency and burst release of protein. The effect of surfactants: polyvinyl alcohol and poloxamer 407 used in the outer water phase was investigated. The surfactant/PLGA mass ratio played an important role in the preparation procedure of the particles. This ratio was found to be approximately 0.5 for polyvinyl alcohol (PVA) and 5 for poloxamer 407 in order to achieve microparticles with narrow size distribution (<70 µm) and good encapsulation efficiency (>70%).
Key words: Encapsulation efficiency; Initial release; Bovine serum albumin; Poly (lactide-co-glycolide) ; Modified
Lowry Protein Assays.
______________________________________________________________________________
INTRODUCTION
Biodegradable polymeric matrix is promising for delivering proteins over a desired period of time. The use of biodegradable poly (D, L-lactic-co-glycolic acid) (PLGA) microparticles for the delivery of peptides and proteins has been widely reported. [1] However, some difficulties of using this delivery system cannot be ignored. One major problem is whether the release rate of protein follows a desired profile. The current studies indicate that the protein release from biodegradable microparticles is governed by many factors. These include the degradation rate of PLGA copolymer, which largely depends on the physical properties of polymer such as molecular weight, hydrophilicity, and the ratio of lactide to glycolide. Processing conditions employed during preparation of microparticles determine the properties of the microparticles, such as the size, morphology, encapsulation efficiency, and drug distribution [2, 3].
microparticles. Although having the same final composition, different microstructures of the particles with different release profiles can be obtained [4].
The PLGA precipitation kinetics in an in situ PLGA implant system was examined by McHugh et al. [5]. Parameters leading to a faster PLGA precipitation (e.g., PVP or water addition to the PLGA solution or a decreasing polymer concentration) resulted in more porous implants and a high initial release. In contrast, a slower precipitation resulted in denser sponge-like implant with a low initial release.
Poly (ethylene glycols) (PEGs) of higher molecular weights (4000 to 70 000) have been incorporated with poly (lactic acid) (PLA) or PLGA microparticles to study their effect on the in vitro release of proteins [6]. In this study, relatively low molecular weight PEG 1450 was incorporated into microparticles to see its effect on the in vitro release of a high molecular weight model protein, bovine serum albumin (BSA).
It must be noted that poloxamer 407, PVA or PVP are generally defined as surfactants in similar systems, although surfactants are used for the stabilization of the boundary surface of multiple oil drops and outer water. However, the listed polymers have a surfactant character but their stabilizing effect is exerted not through boundary surface adsorption but by increasing the viscosity of water. The sufficiently high viscosity prevents emulsified multiple drops from interflowing. [7].
The aim of this study was to investigate extensively the effect of experimental conditions on size, morphology, encapsulation efficiency and protein release kinetics during the preparation of microparticles.
EXPERIMENTAL SECTION
Materials
Bovine serum albumin (BSA, MW 66 430 Da) and Polyvinyl alcohol (PVA) (25 kDa, 88% mol hydrolyzed) purchased from Sigma (St. Louis, USA). PLGA (50:50) polymers, PURASORB polymers PDLG 5002, 0.20 dL/g were gifted exclusively by PURAC BIOMATERIALS, The Netherland. Poly (ethylene glycol) PEG 1450 and poloxamer 407 (BASF) from Chem industries, Sodium chloride (Nacl), mannitol, Potassium hydroxide, sodium hydroxide, sodium chloride, Tween 80 and were purchased from S. D. fine Chemicals, Mumbai. Folin - Ciocalteu reagent (FCR) or Folin's phenol reagent or Folin-Denis reagent, Dichloromethane (DCM) and copper sulphate (CuSO4) were purchased from Merck chemicals.
Preparation of BSA loaded PLGA/PEG microparticles
BSA loaded PLGA microparticles were prepared by a double emulsion solvent evaporation technique and conveniently modified. Briefly, 200 - 600 mg PLGA was dissolved in 2 - 6 ml dichloromethane (DCM) and emulsified with 20 - 60 mg BSA in 0.5 ml aqueous solution (PBS) using a homogenizer at a speed of 6000 rpm for 1 min to form a primary emulsion (w/o). This primary emulsion was rapidly transferred into 20 - 60 ml of aqueous solution containing of PVA(0.2 – 2.5% w/v) or poloxamer 407 (0.2 - 5 % w/v) and Nacl (0.05 – 0.5 M) and homogenized for 0.5 min at the half speed of the primary emulsion to produce a double (w/o/w) emulsion in the ratio of 1:10:100 by volumes. The resultant double emulsion was magnetically stirred for 4 h at ambient room temperature at 250 rpm to evaporate dichloromethane. The hardened microparticles were isolated by centrifugation at 3000 rpm for 3 min and washed thrice using distilled water. Mannitol (10% w/w) was added before lyophilization to prevent aggregation of microparticles. The microparticles were stored at 4ºC until the time of evaluation. The sizes collected were 20-70 µm. The microparticles containing additive (PEG 1450) were prepared in the same manner by dissolving the additive and PLGA into DCM with different PLGA/PEG ratios (1:1, 1:2, 2:1).
Determination of Entrapment efficiency
Entrapment efficiency (%) = (Weight of BSA in microparticles /Weight of BSA fed initially) × 100
In vitro release studies:
In vitro release studies were carried out by suspending 200 mg of microparticles in 60 ml of phosphate buffered
saline (PBS, pH 7.4) containing 0.02% sodium azide as bacteriostatic agent and 0.01% Tween 80 to prevent the microparticles from aggregation in the dissolution medium in stoppered flasks. The flasks were placed in a reciprocal shaking water bath maintained at 37±0.5º at a speed of 60 cycles/min. At predetermined time intervals, samples were collected and centrifuged at for 5 min. The supernatant was assayed for the protein release using Hartree-Lowry and Modified Lowry Protein Assays by UV-Visible Spectrophotometer at 650 nm. The collected amount of supernatant was replaced with fresh PBS to maintain sink conditions. The percentage of protein release at different intervals was calculated by using a freshly prepared calibration curve using the standard samples which were run along with test samples. Release experiments were done independently in triplicate for each batch of microparticles.
Particle size distribution
Size of prepared microparticles were determined by laser scattering technique, using a Master-sizer 2000 (Malvern Instruments, Malvern, UK) at 20 ◦C. The average particle size was expressed in volume mean diameter.
Scanning Electron Microscopy
Surface images of microparticles were taken after a brief gold or paladium coating (60s) using a Hitachi S3200N Scanning Electron Microscope at voltages ranging from 5 to 20 kV.
Kinetic modeling
To understand the drug permeation kinetics from microparticle formulations, the data was fitted into zero-order (cumulative percentage drug permeated vs. time), first order (log cumulative percentage drug remaining to be permeated vs. time), Kors -meyer- peppas [10] and Higuchi’s model equations [11] and analyzed by linear regression.
RESULTS
As mentioned in the material and method variety of expedients were investigated for their ability to improve loading, morphology and release characteristics in PLGA microparticles. Additives like poly (ethylene glycol) (PEG) 1450, poloxamer 407, polyvinyl alcohol (PVA) and Sodium chloride (NaCl) were selected in their different concentrations in order to prepare microparticles. Table 1 shows the formulations prepared with different ratio of PLGA/PEG ratios 1:1, 1:2 and 2:1 respectively. The porosity of microparticles increased with an increasing amount of PEG shown by Figure 1. Results derived from the Figure 2 show that the release of BSA from the control microparticles is much lower. Less than 25% of the protein was released after 7 days. The incorporation of PEG 1450 significantly increased BSA release in the first 3 days as compare to control. Zero-order kinetics, Higuchi equation and Korsmeyer-Peppas models were used to determine the drug release kinetics as shown in Table 2. The effect of concentration of surfactants on encapsulation efficiency has been clearly shown by Figure 3, 4, 5, and 6. Use of an osmogen like sodium chloride in two different morality have shown its effect on burst release, encapsulation efficiency and morphology which is clearly indicated by Figure 7, 8 and 9.
DISCUSSION
Effect of PEG 1450 on encapsulation efficiency and particle size
PEG during microsparticles manufacturing from the polymer blends would form pores and channels through which BSA could also pass from internal aqueous phase to external aqueous phase.
Effect of PEG 1450 on protein release
Typical biphasic release pattern was observed for most formulations: an initial burst phase (days 0-2) and an intermediate phase (days 3-21). The protein released during the burst release phase was mainly due to protein desorption and diffusion from the surface and small pores on the surface of microparticles. The intermediate phase is typical for high molecular weight polymer because it requires a relatively long degradation time before sufficient erosion of polymer matrix is achieved for protein release. In this phase, interconnected pores are emptied of protein. Only after depletion of protein from the surface pores, protein trapped in polymer matrix is begins to deplete. This depletion of protein is largely restricted because of the very low diffusivity. Figure 2 show that the release of BSA from the control microparticles is much lower. Less than 25% of the protein was released after 7 days. The incorporation of PEG 1450 significantly increased BSA release in the first 3 days as compare to control. The early-stage release was increased with an increasing PEG 1450 content in the microparticles. However, the release rate during the intermediate and later stages did not increase to a large extent. The greater content of PEG in microparticles released the BSA present on surface or near-surface because of PEG's solubility in the release medium. However, the later release of BSA from inside the microparticles matrix mostly depended on the degradation of polymer. The difference in release rate of the protein was explained on the basis of different dissolution rates of PEGs after hydration in the microenvironment in the matrices.
Kinetic assessment of dissolution data
Zero-order kinetics, Higuchi equation and Korsmeyer-Peppas models were used to determine the drug release kinetics. Kinetic assessments of the dissolution data are shown in Table 2. In all formulations containing PLGA in the release layer, the Higuchi equation was found to be efficient in describing the kinetics of drug release, with drug release proportional to the square root of time. Higher r2 values of all the formulations indicate that the release mechanism was diffusion controlled. It has been suggested that the erosion mechanism, in addition to diffusion, was influential on the release of protein. To explore the release pattern, results of the in vitro release data of the formulations were also fitted to the Korsmeyer-Peppas equation, which characterizes the transport mechanism based on the values of the exponent n. For the microparticles, when n takes the value of 0.45 ≤ n corresponds to a Fickian diffusion mechanism, 0.45 < n < 0.89 to non-Fickian transport, n = 0.89 to Case II (relaxational) transport, and n > 0.89 to super case II transport[12]. All formulations exhibited values between 0.527 to 0.594, indicating that the drug release was governed by non Fickian diffusion.
Effect of BSA, PVA and poloxamer 407 concentration on encapsulation efficiency
The amount and distribution of protein associated with PLGA microparticles prepared by the w/o/w method had been shown to depend critically on formulation conditions such as the concentration of protein, polymer and external aqueous phase surfactant.
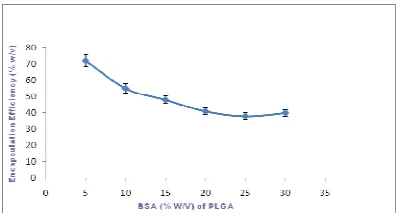
In this study microparticles were formulated as well, in order to investigate the change of entrapment efficiency as a function of initial BSA loading. As Fig. 3 depicts the loading of the BSA in the PLGA microparticles and its effect on encapsulation efficiency varies and from that result it was found that 10 % w/w of PLGA was optimum in order to achieve more than 70 % encapsulation efficiency.
ratio was 5 with poloxamer 407 when the encapsulation efficiency exceeded 70%, while with PVA this ratio was only 0.5.
Table 1. Effect of PEG 1450 on encapsulation efficiency and particle size of BSA loaded microparticles
± SD, N=3.
Formulation PLGA
(mg) BSA (mg)
PLGA/PEG ratio
Encapsulation Efficiency (%)
Particle size (µm)
F1 600 30 - 56 ± 0.23 46 ± 0.63
F2 600 30 1:1 43 ± 0.63 49 ± 0.58
F3 600 30 1:2 36 ± 0.85 41 ± 0.16
Table 2. Kinetic assessment of release data obtained from BSA loaded PLGA microparticles
Mathematical Model Fitting Control 1:2 Formulation 1:1 2:1
Peppas Model n 0.594826 0.527376 0.583859 0.55761
r2 0.983263 0.98222 0.994961 0.990507
Higuchi Model r2 n 0.048966 0.993608 0.187541 0.989116 0.184497 0.972325 0.224796 0.976536
First Order n 0.03728 0.024308 0.026251 0.032229
r2 0.966969 0.866147 0.862872 0.9215
Zero Order n 2.255292 2.661304 2.584674 2.687976
r2 0.994446 0.945376 0.940174 0.972467
(A) (B)
Figure 1. Scanning electron micrographs of BSA loaded PLGA microparticles with (A) orWithout (B), PEG 1450.
Figure 2. In vitro release profiles of BSA-loaded microparticles prepared with different PLGA/PEG ratios.
Figure 3. Influence of initial BSA (%, w/w of PLGA) on the encapsulation efficiency of BSA.
± SD, N=3. (PVA used as surfactant)
[image:6.595.196.408.438.550.2]
Figure 4. Influence of initial BSA (%, w/w of PLGA) on the encapsulation efficiency of BSA.
± SD, N=3. (Poloxamer 407 used as surfactant)
[image:6.595.198.405.583.697.2]Figure 5. Influence of PVA concentration (%, w/w) on the encapsulation efficiency of BSA. ± SD, N=3.
Figure 6. Influence of Poloxamer 407 concentration (%, w/w) on the encapsulation efficiency of BSA.
Figure 7. Influence of NaCl concentration to the external phase on the encapsulation efficiency and initial release of BSA loaded microparticles.
[image:7.595.174.425.271.371.2]± SD, N=3.
Figure 8. Influence of the actual loading on the encapsulation efficiency and initial release of BSA loaded microparticles.
± SD, N=3.
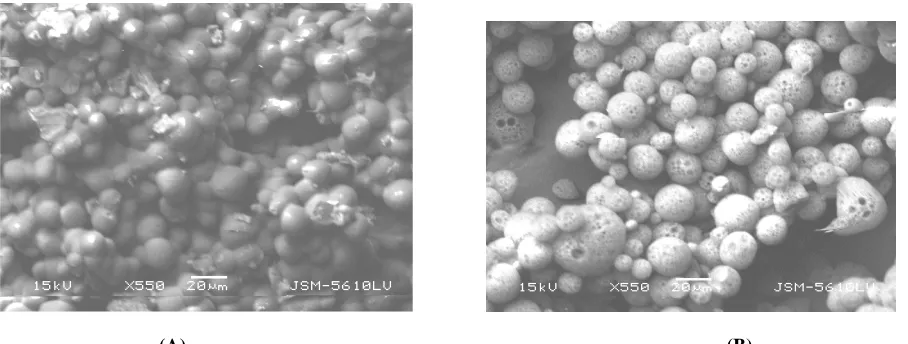
(A) (B)
Figure 9. Scanning electron micrographs of microparticles prepared without or with NaCl addition to the external phase. (A) 0.5 M NaCl. (B) Without NaCl
Effect of Sodium chloride on encapsulation efficiency and initial release
The objective of this study was to identify key variables affecting the initial release (burst) and the encapsulation of BSA containing poly (lactide-co-glycolide) (PLGA) microparticles prepared by the solvent evaporation method. By adjusting some parameters there was a change in the PLGA precipitation kinetics, provided efficient ways to increase the encapsulation efficiency and to control the burst release.
[image:7.595.70.524.414.586.2]osmotic pressure of the external phase by addition of salts. This resulted denser microparticles and a reduced the protein loss from the formulation. The addition of NaCl showed a concentration dependent effect on the initial release with an increase at low NaCl and a decrease at higher NaCl concentrations. A low salt concentration (0.05M NaCl) in the external phase increased the initial release from 14.4 to 23.4 %; however, a further increase in NaCl concentration to 0.25M and 0.5M resulted in a decreased initial release to 14.3 and 8.6%, respectively (Fig. 7). The higher drug loading might be responsible for the higher the initial release. That means the release increases with increasing loading for water-soluble drugs. To verify this, microparticles with different BSA loading were prepared. As expected, the initial release increased with increased actual BSA loading. As the initial BSA loading was increased, there was a slight decrease in the encapsulation efficiency. It suggested that only 10-14% w/w BSA was sufficient in order to achieve higher encapsulation efficiency (Fig. 8). The initial release jumped from 13.4 to 22.3% when the actual BSA loading increased over a fairly narrow range from 14.8 to 18.4%. Thus, the increase in the initial release caused by the addition of the low concentration of NaCl (0.05 M) to the external phase could be attributed to the increased actual drug loading.
The decrease in the initial release at higher NaCl concentrations could be explained with a denser structure of the resulting microparticles. This might be due to the the presence of NaCl which reduced the solubility of methylene chloride in the external aqueous phase. It leads to delay the polymer precipitation and formation of less porous microparticles. The porosity of the microparticles decreased by increasing concentration of NaCl (Fig. 9). Microparticles prepared without NaCl addition showed a porous surface and inner structure, while microparticles prepared with 0.5M NaCl in the external phase led to the formation of particles with a smooth surface and a dense inner structure. The decrease in porosity reduced the drug accessibility to the release medium and thus correlated with a lower initial release.
CONCLUSION
The aim of our research was to overcome some of the critical issues (encapsulation efficiency and burst release of protein) by using various additives in order to prepare protein loaded microparticles. These studies have shown that the incorporation of additives PEG 1450 significantly increased the early-stage release of BSA from PLGA microparticles in comparison to the control. There was no improvement in encapsulation efficiency. This suggest that the combination of different molecular weight PEGs would be a better way to modify the release of protein from microparticles. In the case of surfactants, PVA was found to be the most efficient surfactant in very less concentration (0.25 – 0.5 % w/v) considering both the encapsulation efficiency and the size reducing effect in comparison of polaxomer 407. As a consequence of these results, it can be also concluded that from the studied two surfactants only PVA could be suitable to prepare microparticles. Use of an osmogen like NaCl (0.05 M) has shown its effect on quick polymer precipitation which leads to higher encapsulation efficiency; in contrast, NaCl at high concentration (0.5M) delayed polymer precipitation and resulted in non-porous microparticles with a low initial release.
Acknowledgments: Authors are thankful to Purac Biomaterials, Netherland for providing the free samples of PLGA
and express our sincere gratitude to GUJCOST (Gujarat council on Science and Technology) for their financial assistance and DFS (Directorate of Forensic Science) for their generous help to carry out this research work.
REFERENCES
[1]HB Ravivarapu; K Burton; PP DeLuca. Eur J Pharm Biopharm., 2000, 50, 263-270. [2]KL Smith ; AE Schimpf ; KE Thompson. Adv Drug Del Rev., 1990, 4, 343-357. [3]YY Yang ; TS Chung. Biomater., 2001, 22,231-241.
[4]J Rajiv. Biomater., 2000, 21, 2475-2490.
[5]KJ Brubeck; JR Desnoyer ;AJ McHugh. J. Control. Rel., 1999, 62, 333–344. [6]RL Cleek; KC Ting; SG Eskin ; AG Mikos. J Control Rel., 1997, 48, 259-268. [7] Z Su; F Sun; Y Shi. Chem Pharm Bull (Tokyo), 2009, 57(11), 1251-6. [8]M Igartua ; Hernandez ;A Esquisabel. Int J Pharm., 1998, 169, 45–54. [9]OH Lowry; NJ Rosebrough ;RJ Randall. J. Biol. Chem., 1951, 193, 265–75. [10]RW Korsmeyer ; R Gurny ;NA Peppas. Int. J. Pharm., 1983, 15, 25–35. [11]T Higuchi. J. Pharm. Sci., 1963, 52 (12), 1145 – 1149.