Pay-risk Sensitivity and Bank Performance
Pei-I Chou
1,*, Chia-Hao Lee
21Department of Business, National Open University, Taiwan
2Department of Finance, National Taichung University of Science and Technology, Taiwan
Copyright©2016 by authors, all rights reserved. Authors agree that this article remains permanently open access under the terms of the Crative Commons Attribution License 4.0 international License.
Abstract This study investigates the mediation effect of
the pay-risk sensitivity of CEOs on the relation between risky investment and bank performance over the sample period of 2000 to 2007. The empirical results of the study show that CEOs of BHCs engage in more private MBSs will increase their pay-risk sensitivity incentives, and then induces the relation between risky investment and bank performance to become negative. These results imply that the pay-risk sensitivity incentives indirectly induce manager to increase his own benefits at the expense of shareholders. Furthermore, we classify CEOs of BHCs as three levels of overconfidence, and find that the pay-risk sensitivity incentive has a mediation effect on the relation between private MBSs and firm performance in excessively overconfident CEOs group, implying that the levels of CEOs confidence should be considered while compensation committee designs a flawless contract for encouraging managers put shareholders’ best interests in front of theirs.Keywords
Pay-risk Sensitivity, Private Mortgage-backedSecurity, Bank Holding Companies, CEOs Overconfidence, Performance
1. Introduction
The risky investment and the risk sensitivity of CEO are important issues in recent bank’s financial management. The passage of the Financial Services Modernization Act in 1999 and effectively abolishing the Glass-Steagall in 1933 allowed banks to engage in a range of new fee earnings activities such as underwriting of commercial paper, mortgage backed and asset backed securities or other investment activities. However, these new fee earnings activities induce a decline in interest margins induced by higher competition, and the traditional function of banks as financial intermediaries has been in decline (Allen and Santomero [1]). For maximizing profits, bank’s managers are shifting toward non-interest activities and more risky investments. However, the relation between bank’s performance and risky investment activities still debated. To
clarify the relation between bank’s performance and risky investment, this study uses the CEOs pay-risk sensitivity to analyze the effect of risk sensitivity of CEO on the relation between bank’s performance and risky investment.
Recent years, many banks have not only offered an increasing number of agencies and private label mortgage-backed securities (hereafter, MBS), but also purchased these private MBSs for increasing bank’s performance. One kind of mortgage-backed security is private MBS which is issued by private entities but not guaranteed by Fannie Mae, Freddie Mac, or Ginnie Mae, and then these MBSs generally carry a greater credit risk than those MBSs with agency guarantee. Based on the basic risk-return relation, managers are willing to take more risks, namely private MBS, for increasing firm performance. However, the private MBS collateralized by a pool of mortgages, which was an assortment of mortgages of varying quality, and rating agencies tended to overstate the value of the MBS and were fundamentally arbitrary. Therefore, a sharp boom and bust in the housing markets had impacts on the MBS as falling house prices lead to delinquencies and foreclosures, and then these MBSs with excessive risks dramatically drop bank performances (Taylor [25]). This implies that the private MBS investment behavior of manager probably brings excessive risk and decreases shareholders’ interests due to overvaluation.
pay-risk sensitivity (vega) implements riskier investment policy. Along this line, prior studies that use vega as the dependent variable find there is a positive associations between vega and risky investment and R&D intensity (Guay [10]; Hagendorff and Vallascas [12]). This implies that increases in the risk sensitivity of executive compensation are designed to encourage bank managers to exploit the new activities that many of the fee-based and more risky than traditional banking activities. Accordingly, the relation between CEOs pay-risk sensitivity and risky investments should be positive.
Morck et al. [23] and McConnell and Servaes [20] indicated that a suitable compensation incentive induces decisions by managers that are good for shareholders, and implied a positive relation between the structure of the compensation scheme and firm performance. However, these parallel but relatively independent segments of the literature neglect an open question that is how pay-risk sensitivity of CEO affects the relation between risky investment activities and firm performance. It is worthy to note that the intermediary role of pay-risk sensitivity on the relation between risky investment activities and bank performance gives shareholders an opportunity to choose a vega to CEOs for encouraging them to implement value-maximizing investment activities. Naturally, investment policies determine the probability distribution of a firm’s cash flows and stock returns. In terms of selecting optimal vega, managers should account for how the end result, the implemented activities and implied risk profile of the firm, feedback through the managerial compensation scheme to affect managerial utility. However, taking more risky investment by managers with pay-risk sensitivity may decrease future firm performance. Thus, in order to avoid spurious inferences and to isolate causation, this study design the empirical model to clarify how CEO compensation incentives affect risky investment and bank performance and the shareholders’ benefit intermediary affected by the CEO compensation incentives.
In summary, the purpose of this study is to explore that CEOs pay-risk sensitivity has a mediation effect on the relation between risky investment and performance. Difference with prior researches, we apply simultaneous equation regression and suitable control variables to clarify the mediation effect of CEOs pay-risk sensitivity on the investment policies and firm performance. Furthermore, we use the method of Core and Guay [5] to estimate the sensitivity of CEO wealth to stock return volatility for obtaining a more precisely measure of the incentives faced by managers rather than rely on potentially noisy proxies such as the number or value of options or stock held or granted. Finally, most prior studies do not give deeply concerned on the banking industry which plays an important role in economic system. However, deregulation not only makes performance contracts to become more equity-based for encouraging bank CEOs to take advantage of the growing investment opportunity set (Chen et al. [3]; DeYoung et al. [6]; Hubbard and Palia [16]; Mehran and
Rosenberg [22]), but also expands managerial discretion over the scale and scope of banking activities. It is clear that many banks engaged in MBS with excessive risks in the mid-2000s and then the bank performances dramatically drop and the CEO compensations of the banks are at the forefront of many policy debates on the root causes of the financial crisis. Consequently, our empirical results can provide new insight into several respects for compensation committee, shareholders, and regulators. In terms of compensation committee, they should design a suitable CEOs pay-risk sensitivity to encourage managers put shareholders’ best interest in front of theirs. With regard to shareholders and regulators, they should consider the impact of risky investment activities on firm performance through pay-risk sensitivity, resulting in the ability to prevent managers from increasing personal wealth at shareholders’ expense.
The remainders of this paper are organized as follows: The next section will detail the research design and methodology used to conduct this study. Section 3 will provide our empirical results, and section 4 will conclude our findings.
2. Data and Methodology
This section describes the data, the construction of our main variables, and the empirical models designed to examine the mediation effect of CEOs pay-risk sensitivity on the relation between risky investment and bank performance.
2.1. Data
Our data comes from four sources. In terms of managerial incentives, we obtain data on the relative variables of managerial incentives from Standard and Poor’s ExecuComp which provides data on salary, bonus, and total compensation for the top five executives of bank holding companies (BHCs) from 1993 to 2007. In our present analysis, we are interested in the executives who are identified as CEOs by ExecuComp. Furthermore, the mortgage-backed security data are obtained from Federal Reserve Y-9C database which provides a wealth of detailed bank data including bank holdings of MBS. Finally, we require that the stock return data and the accounting data of BHCs be available from Datastream and Compustat, respectively. Considering that the ExecuComp data can be obtained from 1992 due to the availability of consistent disclosure of option portfolios beginning that year and the passage of Gramm-Leach-Bliley Act in 1999, our sample period is 2000-2007. The final sample consists of 413 firm-year observations after we merge the four databases; lag some of the variables by one year, estimated Vega and the levels of CEOs overconfidence.
Following the related research, we define CEOs pay-risk sensitivity as the sensitivity of the CEO’s portfolio of options and stocks to small changes in stock price volatility. In order to obtain the CEOs pay-risk sensitivity, we firstly use the Core-Guay [5] approach to estimate the sensitivity of CEO options to small changes in stock return volatility, and then follow Rajgopal and Shevlin [24] and Coles et al. [4] method to measure the sensitivity of the value of CEO shareholdings to small changes in stock return volatility. Finally, we sum the individual option and share sensitivities to return volatility for constructing the key independent variable in this study. In order to estimate the sensitivity of CEO options to small changes in stock return volatility, we classify option data into option grants made in the current year and previously granted options. For the option grants in current year, ExecuComp provides the number of options granted, option exercise price, the time to maturity, the firm’s expected dividend yield, the firm’s expected stock return volatility and the risk-free interest rate for that year. However, ExecuComp does not provide complete data on previously granted options, and thus we rely on the one-year approximation method developed by Core-Guay [5].
To estimate average exercise prices of previous option grants, we divide the excess of stock price over exercise price (realizable values) of the options by the number of options to obtain the average difference between stock price and exercise price. Then, we subtract the difference from the stock price to get the exercise price. Furthermore, we also follow Core and Guay [5] in estimating the remaining time to maturity of outstanding options. In theory, exercisable options likely have shorter times to maturity than un-exercisable options. Therefore, if a firm grants options in the current year, the time to maturity of previously granted un-exercisable (exercisable) options is set to the time to maturity of the current option grant minus one (three) years. If there are no option grants are made in the current year, we set the time to maturity of previously granted un-exercisable (exercisable) options to nine (six) years, as options typically are granted with ten years to maturity. The estimated model is defined as follows.
( )
'0.01 dT 0.01
value
Vega e N Z S T
σ
−
∂
= × = ×
∂ (1)
where Vega is the dollar change in option value associated with a 1% change in the standard deviation of the bank’s stock return; ln
(
)
(
0.5 2)
f
Z= S X + r − +d σ T σ T ; S is the closing stock price at the fiscal year end, X is the exercise price of the option;
σ
is the annualized standard deviation of daily stock returns;r
f is the continuously compounded risk-free rate for a maturity value equal to that of the option contract;d
is the continuously compounded divided yield andT
is the time to maturity of the option grant. Following related research, the stock return volatilities of current year option grants, previously granted un-exercisable options, and previously granted exercisableoptions are multiplied by the number of shares of each type of grant, and then summed.
Guay [10] demonstrates that the vega of stock holdings is zero, and Fahlenbrach and Stulz [7] argue that the zero-vega assumption for stock grants could be applied to banks. Therefore, we do not include stock grants in the calculation of vega. Furthermore, prior studies suggest that the components of compensation package impact on the bank risk. Guo et al. [11] find that bank risk increases with both the percentages of short-term and long-term incentive compensation, while Fortin et al. [8] document that base salary increases likely induce managerial risk aversion because that compensation component establishes a steady stream of cash flows. The evidence implies that different components of compensation package have different impacts on firm value due to their inherent risks. Therefore, we define CEOs pay-risk sensitivity as the ratio of natural logarithm CEOs vega to natural logarithm CEOs cash compensation, and use this proxy to examine the mediation effect of CEOs pay-risk sensitivity exists in the relation between bank’s risky investment and performance.
2.3. The Proxy of Risky Investment
Considering that managers in banks are shifting toward non-interest activities with more risk for maximizing profits in recent years, this study use the private MBSs as the proxy of risky investment to investigate the relations among CEOs pay-risk sensitivity, risky investment and bank performance. In general, private MBSs are issued by private entities and are not guaranteed by Fannie Mae, Freddie Mac, or Ginnie Mae, and these MBSs are backed by pools of sub-prime, Alt-A, jumbo, or other non-conforming mortgages, and as such they were known at least somewhat riskier investments than agency MBSs that are backed by conforming mortgages (Federal Deposit Insurance Corporation). With respect to the proxy of risky investment, we sum the market value of all available-for-sale collateralized mortgage obligations (CMOs), real estate mortgage investment conduits (REMICs), CMO/REMIC residuals, and stripped mortgage-backed securities issued by non-U.S. Government issuers (e.g., other depository institutions, insurance companies, state and local housing authorities in the U.S.) for which the collateral does not consist of Ginnie Mae pass-throughs, Fannie Mae pass-throughs, Freddie Mac participation certificates, or other mortgage-backed securities. For avoiding the effect of bank size, we divide private MBSs by bank total assets.
2.4. The Levels of Ceos Overconfidence
in-the-money option value as the threshold to whether CEOs in BHCs are overconfidence, which is proposed by Malmendier and Tate [19], and follow the criterion of Campbell et al. [2] to classify CEOs into three categories as follows: excessively overconfident CEOs, excessively diffident CEOs and moderately overconfident CEOs.
According to the approach of Malmendier and Tate [19], 67% of in-the-money option value is obtained from the dataset used in Hall and Liebman [13]. However, considering that the exercise prices of option-grant-specific do not provided by ExecuComp. To overcome this restriction, we estimate the average exercise price to determine the percentage moneyness of the aggregated options by using Core and Guay’s [5] method. The total realizable value of the options is divided by the number of options to compute the average realizable value per option. Therefore, we use the per-option realizable value, together with the contemporaneous stock price, to estimate the average exercise price of the options. Moreover, we calculate the average percentage of moneyness of the options by using the estimated average exercise price and the contemporaneous stock price.
Following the definition of Campbell et al. [2], we identify a CEO as excessively overconfident when he holds stock options that are more than 100% in the money. To the extent that the 67% cutoff identifies overconfident managers who overestimate the returns to their projects, the 100% cutoff should identify the set of CEOs who have even greater overestimation errors. Furthermore, we define a CEO is excessively diffident when he/she exercises stock options that are less than 30% in the money. The meaning of excessively diffident implies that CEOs hold options too short. The remainder of CEOs is viewed as moderately overconfidence if they hold and/or exercise options with moneyness between 30% and 100%.
According to the methodology of Malmendier and Tate [19], we require that a CEO holds the option at least twice during the sample period, and classify the CEO into the excessive overconfidence group when he/she exhibits the behavior in the first time. However, if a CEO has no option held in a given year because he/she exercised all of them in previous years, then they retain their classification from the year in which they were classifiable.
2.5. Empirical Models
The purpose of this study is to explore the mediation effect of the CEOs pay-risk sensitivity on the relation between risky investment and bank performance. Fahlenbrach and Stulz [7] and Guo et al. [11] reported that higher pay-risk sensitivity is associated with more risky investment, and affect firm performance. Therefore, the mediation effect of CEOs pay-risk sensitivity implies that risky investment activities directly and indirectly affect bank performance. To examine this mediation effect, we construct the simultaneous regression model as follows:
, 0 1 , 2 ,
, 1
_
i t i t i t
n i t n
BHAR MBS Vega Cash
Controls
a a a
a − e
= + ∆ +
+
∑
+ (2), 4 5 ,
_
i t i tVega Cash
=
a a
+ ∆
MBS
+
e
(3)where
BHAR
i t, represents the buy-and-hold abnormal return of BHC i at t year end; Vega Cash_ i t, represents CEOs pay-risk sensitivity in year t; ∆MBSi t, represents the dollar change in natural logarithm private mortgage-backed securities of BHCs i andControls
i t, 1− represents controlvariables of BHCs i in year t-1, including firm size, return on asset and leverage. This study also consider these control variables in Equation (2) to avoid our results being driven by the more volatile operating environments of firms. Equation (2) interprets the effect of CEOs pay-risk sensitivity on the one year buy and hold abnormal return (BHAR), and controls for the effect of firm size, return on asset and leverage. Equation (3) expresses the relation between the changes in risky investment and CEOs pay-risk sensitivity. By estimating equations (2) and (3) simultaneously, we can conveniently examine the mediation effect of CEOs pay-risk sensitivity on the relation between risky investment and bank’s performance. If
a
1 is significant, the private MBS activities has a direct effect on the firm performance. If botha
2 anda
5 are significant, [image:4.595.315.551.507.747.2]it implies that mediation effect of CEOs pay-risk sensitivity exists between private MBS activities and firm performance. Specifically, we also use Equation (3) to separately investigate whether mediation effects are different in three levels of CEOs overconfidence. Table 1 summarizes the definitions of the dependent and independent variables selected in this study.
Table 1. Variable Definitions Excessively
overconfident = CEOs hold and/or exercise options with moneyness more than 100% Excessively
diffident = CEOs hold and/or exercise options with moneyness less than 30% Moderately
overconfident = CEOs hold and/or exercise options with moneyness between 30% and 100%.
Vega = the dollar change in option value associated with a 1% change in the standard deviation of the bank’s stock return;
Cash
compensation = the sum of salary and bonus of CEOs in thousands of dollars;
Vega_Cash = natural logarithm CEOs cash compensation; the ratio of natural logarithm CEOs vega to
BHAR = the difference between the buy and hold return of BHC and the buy and hold return of the S&P 500 market index;
MBS
∆
=the sum of market value of all available-for-sale CMOs, REMICs, CMO and REMIC residuals, and stripped mortgage-backed securities issued by
non-U.S. government issuers, and then scaled by assets;
LEVER = long-term debt scaled by assets;
SIZE = the log of total assets;
3. Empirical Results and Discussion
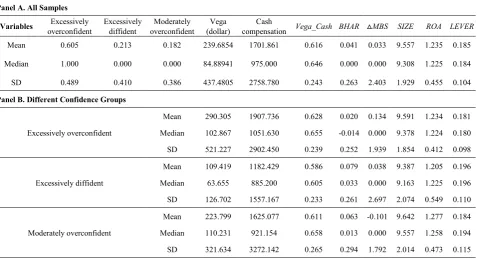
3.1. Descriptive Statistics and Pearson Correlation Table 2 provides the descriptive statistics of all variables used in our empirical analysis. With respect to the levels of CEOs overconfidence, the results show that half of CEOs are excessively overconfident during the period 2000 to 2007, while about 21% CEOs are excessively diffident. This implies that in banking industry, CEOs trend to overvalue their abilities and postpone exercising their holding options. To clearly observe the characteristics of different levels of CEOs overconfidence, we classify all samples into three groups: excessively overconfident, excessively diffident and moderately overconfident. Panel B in Table 2 shows that banks with excessively overconfident CEOs have lowest one year buy-and-hold abnormal return. On average, the excessively overconfident group has highest vega (290.305) and cash compensation (1907.736). This implies that the change in the standard deviation of the bank’s stock return has the most impact on the dollar change in option value of excessively overconfident CEOs, and these CEOs, on average, obtain more salary and bonus than the two other groups. Furthermore, excessively overconfident CEOs have highest pay-risk sensitivity
(Vega_Cash), which implying that changes in stock price
volatility have more impact on the change in these CEOs compensation than the others when we consider the impact of bank risk on cash compensations. With respect to bank’s performance, we find that the BHAR of excessively
overconfident CEOs group is the lowest. Finally, the results of Table 2 exhibit that the changes in MBS which held by excessively overconfident CEOs is, on average, more than MBS held by excessively diffident CEOs and moderately overconfident CEOs, and the changes in MBS of moderately overconfident CEOs is negative. The results of pay-risk sensitivity and the changes in MBS imply that an overconfident manager more likely accept a compensation scheme which is more positively sensitive to performance and risk, because they expect to take more risky investment for making performance better (Hirshleifer et al. [15]).
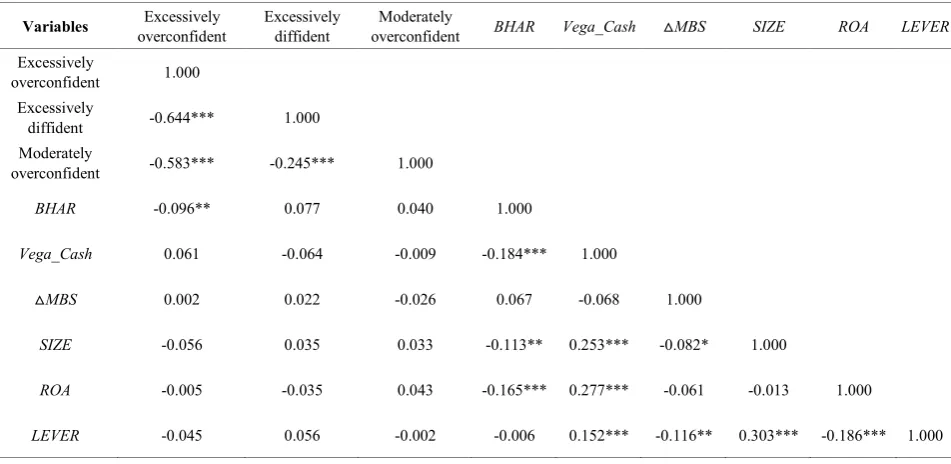
[image:5.595.69.547.482.741.2]Table 3 represents Pearson correlation matrix for related variables. The table shows that a significant negative correlation between BHAR and excessively overconfident, and this implies that excessively overconfident CEOs overestimate the precision of their information and underinvest in information acquisition, leading them to overinvest in projects and reduce firm value. However, there are no significantly relations between moderately overconfidence and bank’s performance and between excessively diffident CEOs and bank’s performance. Table 3 also shows that a significant negative correlation exists between BHAR and pay-risk sensitivity, and implies that the bank’s performance decreases as compensation contract with more vega. The results of Table 3 also show that banks with larger size, higher return on assets and higher leverage have higher CEOs pay-risk sensitivity. Meanwhile, banks with smaller size and lower leverage have more private MBSs.
Table 2. Summary Statistics
This table summarizes our dependent and independent variables. The sample period covers 2000 to 2007. All dependent and independent variables are explained in Table 1.
Panel A. All Samples
Variables overconfidentExcessively Excessively diffident overconfidentModerately (dollar)Vega compensationCash Vega_Cash BHAR △MBS SIZE ROA LEVER
Mean 0.605 0.213 0.182 239.6854 1701.861 0.616 0.041 0.033 9.557 1.235 0.185
Median 1.000 0.000 0.000 84.88941 975.000 0.646 0.000 0.000 9.308 1.225 0.184
SD 0.489 0.410 0.386 437.4805 2758.780 0.243 0.263 2.403 1.929 0.455 0.104
Panel B. Different Confidence Groups
Excessively overconfident
Mean 290.305 1907.736 0.628 0.020 0.134 9.591 1.234 0.181 Median 102.867 1051.630 0.655 -0.014 0.000 9.378 1.224 0.180 SD 521.227 2902.450 0.239 0.252 1.939 1.854 0.412 0.098
Excessively diffident
Mean 109.419 1182.429 0.586 0.079 0.038 9.387 1.205 0.196 Median 63.655 885.200 0.605 0.033 0.000 9.163 1.225 0.196 SD 126.702 1557.167 0.233 0.261 2.697 2.074 0.549 0.110
Moderately overconfident
Table 3. Correlation Matrices
This table summarizes correlations between dependent and independent variables. The sample period covers 2000 to 2007. All dependent and independent variables are explained in Table 1.*, **, *** indicate correlations at significance levels of 10%, 5%, and 1%, respectively.
Variables overconfident Excessively Excessively diffident overconfident Moderately BHAR Vega_Cash △MBS SIZE ROA LEVER
Excessively
overconfident 1.000 Excessively
diffident -0.644*** 1.000 Moderately
overconfident -0.583*** -0.245*** 1.000
BHAR -0.096** 0.077 0.040 1.000
Vega_Cash 0.061 -0.064 -0.009 -0.184*** 1.000
△MBS 0.002 0.022 -0.026 0.067 -0.068 1.000
SIZE -0.056 0.035 0.033 -0.113** 0.253*** -0.082* 1.000
ROA -0.005 -0.035 0.043 -0.165*** 0.277*** -0.061 -0.013 1.000
LEVER -0.045 0.056 -0.002 -0.006 0.152*** -0.116** 0.303*** -0.186*** 1.000
3.2. Main Empirical Results
To explore the mediation effect of CEOs pay-risk sensitivity on the relation between bank’s risky investment and performance, this study use the simulation regression model to examine the mediation effect of CEOs pay-risk sensitivity. Furthermore, we investigate whether the levels of CEOs overconfidence affect the effect of CEOs pay-risk sensitivity on the relation between bank’s risky investment and performance. The estimated results for the simultaneous regression model are presented in Table 4.
In terms of mediation effect of CEOs pay-risk sensitivity, we find that
a
2 is significantly negative in all samples, excessively overconfident CEOs group and moderately overconfident CEOs group, implying that the CEO pay-risk sensitivity directly and negatively affects the bank’s performance. Furthermore, this table shows that coefficients ofa
2 anda
5 are significantly in all samples and excessively overconfident CEOs group, supporting that the mediation effect of CEO pay-risk sensitivity exists in all sample and excessively overconfident CEOs group but not appears in excessively diffident CEOs group and moderately overconfident CEOs group.With respect to the effect of the changes in private MBS on the bank performance, we find that in all samples
a
1 isTable 4. Simultaneous Equation Regressions
This table presents the coefficient estimates and robust standard errors (in parentheses) from simultaneous equation regressions of the CEOs pay-risk sensitivity, risky investment and bank performance in different levels of CEOs overconfidence. All dependent and independent variables are explained in Table 1. The regression model is as follows:
, 0 1 , 2
_
, , 1i t i t i t n i t
n
BHAR
=
a a
+ ∆
MBS
+
a
Vega Cash
+
∑
a
Controls
−+
e
, 4 5 ,
_
i t i tVega Cash
=
a a
+ ∆
MBS
+
e
The sample period covers 2000 to 2007. *, **, *** indicate significance at the 10%, 5%, and 1% levels, respectively. Dependant
Variable Intercept
∆
MBS
tVega Cas
_
ROA
t−1LEVER
t−1Size
t−1 Adj.R
2All
BHAR
t0.434***
(0.083) -0.007** (0.003) -0.162*** (0.055) -0.072** (0.030) (0.128) -0.037 -0.021*** (0.007) 0.061
_ t
Vega Cash 0.615***
(0.012) (0.005) 0.010* 0.007
Excessively overconfident
t
BHAR
0.405***(0.110) -0.005* (0.003) -0.147** (0.070) -0.072* (0.040) (0.169) -0.010 -0.021** (0.009) 0.047
_ t
Vega Cash 0.627*** (0.015) 0.014** (0.006) 0.019
Excessively diffident
t
BHAR
0.374**(0.157) -0.024* (0.014) (0.270) 0.138 -0.114* (0.061) (0.260) -0.263 -0.020*** (0.013) 0.053
_ t
Vega Cash 0.585*** (0.025) (0.013) 0.012 0.001
Moderately overconfident
t
BHAR
0.507**(0.222) (0.019) -0.012 -0.463*** (0.130) (0.077) 0.029 (0.229) 0.100 (0.016) -0.023 0.114
_ t
Vega Cash 0.609*** (0.031) (0.018) 0.025 0.013
4. Conclusions
This study explores the mediation effect of the pay-risk sensitivity of CEOs on the relation between risky investment and bank performance. Stock-based compensation can encourage managers to take more risky investment activities to increase bank performance. However, this compensation incentive may reduce the shareholder’s interest due to over-invest in risky projects. Therefore, the effect of pay-risk sensitivity of CEOs on the relation between risky investment and bank performance is doubtful. To clarify the mediation effect of CEOs pay-risk sensitivity, we use the simultaneous equation regressions to explore the relation between risky investment and performance in U.S. bank holding company over the sample period from 2000 to 2007.
The empirical results of the study show that CEOs of BHCs engaging in more private MBS will increase their pay-risk sensitivity incentives, and then induce the relation between risky investment and bank performance to become negative. These results imply that the pay-risk sensitivity incentives indirectly induce manager to increase his own benefits at the expense of shareholders. Furthermore, we classify CEOs of BHCs as three levels of overconfidence, and find that the sensitivity has a mediation effect on the relation between private MBS and firm performance in excessively overconfident CEOs group. The evidence
implies that the levels of CEOs confidence should be considered while compensation committee designs a flawless contract for encouraging managers put shareholders’ best interests in front of theirs. Overall, the empirical results of this study bring new insight into the relations among CEOs pay-risk sensitivity, risk investment and bank performance, and it is important for investors and policy marker, helping them to make better decisions with regard to investment decision and investors protection.
REFERENCES
[1] Allen, F. and Santomero, A. M., 2001. What do financial intermediaries do? Journal of Banking and Finance, 25: 271-94.
[2] Campbell, T. C., Gallmeyer, M. S., Johnson, A., Rutherford, J. and Stanley, B. W., 2011. CEO optimism and forced turnover. Journal of Financial Economics, 101: 695-712. [3] Chen, R. C., Steiner, T. L., and Whyte, A. M., 2006. Does
stock option-based executive compensation induce risk taking? An analysis of the banking industry. Journal of Banking and Financial, 30: 915-945.
[5] Core, John, and Wayne Guay, 2002. Estimating the value of employee stock option portfolios and their sensitivities to price and volatility. Journal of Accounting Research, 40: 613-630.
[6] DeYoung, R. and Roland, K., 2001. Product mix and earnings volatility of commercial banks: evidence from a degree of total leverage model. Journal of Financial Intermediation, 10: 54-84.
[7] Fahlenbrach, R. and Stulz, R. M., 2010. Bank CEO incentives and the credit crisis. Journal of Financial Economics, Forthcoming
[8] Fortin, R., Goldberg, G. M., and Roth, G., 2010. Bank risk taking at the onset of the current banking crisis. The Financial Review, 45: 891-913.
[9] Gervais, S., Heaton, J. B., and Odean, T., 2011. Overconfidence, compensation contracts, and capital budgeting. The Journal of Finance, 66: 1735-1777.
[10] Guay, W. R., 1999. The sensitivity of CEO wealth to equity risk: An analysis of the magnitude and determinants. Journal of Financial Economics, 53: 43-71.
[11] Guo, L., Jalal, A., and Khaksari, S., 2010. Did bank executive compensation lead to excessive risk taking and the current financial crisis? Working paper (SSRN).
[12] Hagendorff, J. and Vallascas, F., 2011. CEO pay incentives and risk-taking: Evidence from bank acquisitions. Journal of Corporate Finance, 17(4): 1078-1095.
[13] Hall, B. J. and Liebman, J. B., 1998. Are CEOs really paid like bureaucrats? The quarterly journal of economics, 113 (3): 653-691.
[14] Hanlon, M., Rajgopal, S. and Shevlin, T., 2003. Are executive stock options associated with future earnings? Journal of Accounting and Economics, 36: 3-43.
[15] Hirshleifer, D., Low, A. and Hong, T. S., 2010. Are Overconfident CEOs Better Innovators? Unpublished. [16] Hubbard, R. G., and Palia, D., 1995. Executive pay and
performance: Evidence from the U.S. banking industry. Journal of Financial Economics, 39: 105-130.
[17] Ittner, C.D., Lambert, R. A. and Larcker, D.F., 2003. The structure and performance consequences of equity grants to employees of new economy firms. Journal of Accounting and Economics, 34: 89-127.
[18] Jensen, M. and Meckling, W., 1976. Theory of the firm: Managerial behavior, agency costs and ownership structure. Journal of Financial Economics, 3: 305-360.
[19] Malmendier U. and Tate, G., 2005. CEO overconfidence and corporate investment. Journal of Finance, 60: 2661-2700. [20] McConnell, J. J. and Servase, H., 1990. Additional evidence
on equity ownership and corporate value. Journal of Financial Economics, 27: 595-612.
[21] Mehran, H., 1995. Executive compensation structure, ownership, and firm performance. Journal of Financial Economics, 38: 163-184.
[22] Mehran, H. and Rosenberg, J., 2007. The effect of employee stock options on bank investment choice, borrowing, and capital. Staff Reports 305, Federal Reserve Bank of New York.
[23] Morck, R., Shleifer, A. and Vishny, R. W., 1988. Management ownership and market valuation: An empirical analysis. Journal of Finance Economics, 20: 293-315. [24] Rajgopal, S. and Shevlin, T., 2002.Empirical evidence on the
relation between stock option compensation and risk taking. Journal of Accounting and Economics, 33(2): 145-171. [25] Taylor, J. B., 2008. The financial crisis and the policy