Public Health Theses School of Public Health
10-8-2007
Urban Versus Rural Patterns of Mammography
Use: An Analysis of Two Southeastern States
Valerie Miranda Bycott
Follow this and additional works at:https://scholarworks.gsu.edu/iph_theses
Part of thePublic Health Commons
This Thesis is brought to you for free and open access by the School of Public Health at ScholarWorks @ Georgia State University. It has been accepted for inclusion in Public Health Theses by an authorized administrator of ScholarWorks @ Georgia State University. For more information, please contact
Recommended Citation
Bycott, Valerie Miranda, "Urban Versus Rural Patterns of Mammography Use: An Analysis of Two Southeastern States." Thesis, Georgia State University, 2007.
By
VALERIE M. BYCOTT
B.A., UNIVERSITY OF COLORADO AT BOULDER
A Thesis Submitted to the Graduate Faculty of Georgia State University in Partial Fulfillment
of the
Requirements for the Degree
MASTER IN PUBLIC HEALTH
ii
URBAN VERSUS RURAL PATTERNS IN MAMMOGRAPHY USE: AN ANALYSIS OF TWO SOUTHEASTERN STATES
by
VALERIE M. BYCOTT
Approved:
Russ Toal, MPH___________________________________________ Committee Chair
Ike Okosun, MS, MPH, PhD, FRIPH, FRSH_______________ ______ Committee Member
Rebecca Cowens-Alvarado, MPH______________ _______________ Committee Member
iii ABSTRACT
Valerie M. Bycott
Urban versus Rural Patterns in Mammography Use: An Analysis of two Southeastern States
Mammography is widely recognized as the best method to detect breast cancer.
This study examined the screening rate differences among women who live in urban and
rural counties in Georgia and North Carolina. Data on the mammography screening rates
was obtained from the Behavior Risk Factor Surveillance System (BRFSS) for 2002 and
2004. To assess the availability of mammography facilities, data was obtained from the
Mammography Facility Database provided by the FDA. Multivariate logistic regression
showed that having a usual source of care in urban counties was a positive predictor of
women 40-59 years of age getting screened in both states; having a personal doctor and
health care coverage was significantly associated with women ages 60 and above getting
screened. Getting screened was negatively predicted for women 60 years of age and
older who had only a high school education. Data pertaining to mammography screening
rates at the state level needs to be made publicly available to compare differences that
exist among states. To better address an individual’s access to mammography facilities, a
survey should be developed by the American Cancer Society which addresses the
facility’s hours of operation, populations served from neighboring counties, translation
services available and number of mobile versus permanent facilities in each county.
iv
Author’s Statement Page
In presenting this thesis as partial fulfillment of the requirements for an advanced degree from Georgia State University, I agree that the Library of the University shall make it available for inspection and circulation in accordance with its regulations governing materials of this type. I agree that permission to quote from, to copy from, or to publish this thesis may be granted by the author or, in her absence, by the professor under whose direction it was written, or in his absence, by the Associate Dean, College of Health and Human Sciences. Such quoting, copying or publishing must be solely for scholarly purposes and will not involve potential financial gain. It is understood that any copying from or publication of this dissertation which involves potential financial gain will not be allowed without written permission of the author.
v
Notice to Borrower’s Page
All theses deposited in the Georgia State University Library must be used in accordance with the stipulations prescribed by the author in the preceding statement.
The author of this thesis is:
Student’s Name: Valerie Miranda Bycott_____________________________
Street Address: 1485 Marbut Avenue____________________________
City, State and Zip Code: Atlanta, GA 30316_________________________
The Chair of the committee for this thesis is:
Professor’s Name: Russ Toal_______________________________________
Department: Institute of Public Health________________________________
College: Health and Human Sciences_________________________________
Georgia State University P. O. Box 4018
Atlanta, Georgia 30302-4018
Users of this thesis who are not regularly enrolled as students at Georgia State University are required to attest acceptance of the preceding stipulation by signing below. Libraries borrowing this thesis for the use of their patrons are required to see that each user records here the information requested.
NAME OF USER ADDRESS DATE TYPE OF USE
(EXAMINATION ONLY OR
COPYING)
vi VITA
VALERIE MIRANDA BYCOTT 1485 Marbut Avenue·Atlanta, GA 30316
Phone (404) 849-9189·E-mail [email protected]
EDUCATION
University of Colorado at Boulder, Boulder, CO BA in English and Communication, 2002
Certified Health Communication Specialist (CHES), 2006
PROFESSIONAL EXPERIENCE
AEON Corporation, Narita, Japan
English Teacher 2003-2004
Global Health Action, Atlanta, GA
Marketing and Communications Intern 2004
Turner Broadcasting, Atlanta, GA 2004-2005
CNN Studio Tour Guide
Georgia State University, Institute of Public Health, Atlanta, GA 2005
Graduate Research Assistant
American Cancer Society, National Head Office, Atlanta, GA 2006
Comprehensive Cancer Control Planning Intern
Danya International, Atlanta, GA 2007
vii
TABLE OF CONTENTS
Page
LIST OF TABLES……….……….. viii
LIST OF FIGURES……….. x
ACKNOWLEDGEMENTS………..………… xi
CHAPTER 1. INTRODUCTION……… 1
2. REVIEW OF LITERATURE………... 6
3. METHODS AND PROCEDURES………... 26
IRB and Data Management………...……… 26
Research Design……..……….. 26
Research Variables………..……….. 29
Statistical Analysis……… 31
4. FINDINGS…….……… 33
5. DISCUSSION AND CONCLUSION……….. 68
REFERENCES………... 79
APPENDICES APPENDIX A: FIPS STATE CODES FOR GEORGIA……….. 86
viii
LIST OF TABLES
Page
Table 1. Changes in Numbers of Mammography Facilities, Machines, Radiologic, 20 Technologists and Interpreting Physicians from October 1, 2002 to
October 1 2004.
Table 2. Descriptive Statistics Associated with Mammography Use in Urban 39
Counties Georgia (GA) and North Carolina (NC), 2002.
Table 3. Descriptive Statistics Associated with Mammography Use in Urban 40
Counties in Georgia (GA) and North Carolina (NC), 2004.
Table 4. Descriptive Statistics Associated with Mammography Use in Rural 41
Counties in Georgia (GA) and North Carolina (NC), 2004.
Table 5. Association Between Selected Independent Variables and Mammography 42 Stratified by Residence in Georgia, 2002.
Table 6. Association between Selected Independent Variables and Mammography 44 Stratified by Residence in North Carolina, 2002.
Table 7. Association between Selected Independent Variables and Mammography 45 Stratified by Residence in Georgia, 2004.
Table 8. Association between Selected Independent Variables and Mammography 47 Stratified by Residence in North Carolina, 2004.
Table 9. Association between Selected Independent Variables Stratified by 48 Residence in Georgia and North Carolina, 2002.
Table 10. Association Between and Selected Independent Variables and 49 Mammography in Georgia and North Carolina Stratified by Residence,
ix
LIST OF TABLES CONT.
Page
Table 11. Association between selected independent variables and 50
Mammography in women ages 40-59 Stratified by Residence in Georgia and North Carolina in 2002.
Table 12. Association between Mammography and Selected Independent 52
Variable in women ages 40-59 in Georgia and North Carolina Stratified by Residence, 2004.
Table 13. Association between Mammography and Selected Independent 53
Variables in Women Ages 60+ in Georgia and North Carolina Stratified by Residence, 2002.
Table 14. Association between Mammography and Selected Variables 55
in Women Ages 60+ Living in Georgia and North Carolina Stratified by Residence, 2004.
Table 15. Association between Mammography and Selected Variables 56
in Women Ages 60+ Living in Georgia and North Carolina Stratified
by Residence, 2004.
x
LIST OF FIGURES
Page
Figure 1. Participants who answered county of residence question on the GA 34
and NC BRFSS in 2002 and 2004.
Figure 2. Number of women who had a mammogram according to GA and NC 36 BRFSS in 2002 and 2004.
Figure 3. Race distribution of women who took the BRFSS in GA and NC 37
in 2002 and 2004.
Figure 4. Calculated number of facilities needed per 10,000 women according 59
to mammography GAO standard compared to actual number of facilities in either urban or rural counties in Georgia and North Carolina
Figure 5. Georgia’s mammography facilities superimposed on Georgia’s urban 60 counties (indicated in orange).
Figure 6. North Carolina’s mammography facilities superimposed on the urban 61 counties in the state.
Figure 7. Georgia’s mammography facilities superimposed on Georgia’s urban 63 counties (indicated in orange).
Figure 8. North Carolina’s mammography facilities superimposed on the urban 64 counties of the state (indicated in orange).
xi
ACKNOWLEDGMENTS
I would like to give special thanks and appreciation to the following people for their help, support, patience and contribution to my education and especially to this thesis.
Russ Toal for his guidance, encouragement and suggestions as well as his endless patience and time, it may have taken a year, but we made it! Thank-you.
Rebecca Cowens-Alvarado for her friendship as well as trusting me with challenging projects at the American Cancer Society, and for inspiring me to take on this thesis. Dr. Okosun and Dr. Eriksen for being excellent mentors during my schooling at Georgia State’s Institute of Public Health and always making me do my best work.
A huge thank-you to Elaine Halliey, Director of GIS Team and Jeff McMichael, GIS Analyst at the Georgia Division of Public Health for creating the beautiful map of Georgia’s mammography facilities and to Dianne Enright, Health and Spatial Analyst Unit Manager for creating an equally stunning map of North Carolina’s mammography facilities.
My mother, Dr. Linda Tillman and my sisters, Sarah McCormack and Rebecca Ramspott, for their love and faith in me when I didn’t have faith in myself, and for lending a
supportive ear with all of my trials in getting this thesis done.
My grandparents Dr. Clifford Tillman and Sarah Tillman for their loving support and economic support through graduate school, thank-you, I couldn’t have done it without you.
My boyfriend, Jeff Daniel for listening to me type at all hours of the night and being there through all the tears of frustration pushing me to finish.
CHAPTER I INTRODUCTION
Breast cancer is the second leading cause of cancer death and the second most
common form of cancer in the United States (Lemon, Zapka, Clemow, Estabrook, &
Fletcher, 2006). More than 182,000 women were diagnosed with breast cancer in 2002,
and 41,000 women died from the disease in that same year. Currently 63.7% of breast
cancer is diagnosed at the localized stage (before the tumor has metastasized and spread
to other parts of the body) with a survival rate of 97.9% (American Cancer Society,
2006a). Early detection of breast cancer can be attributed to utilization of mammography
screening and the high awareness of breast cancer symptoms in the population.
In the United States, more than seven billion dollars per year has been estimated
to have been spent on the treatment of breast cancer (Centers for Disease Control and
Prevention, 2006/2007). The reason for the high amount of money spent on researching
breast cancer is that earlier detection saves lives and medical expenses. Yet, despite the
overwhelming endorsement of mammography screening as an effective means of
combating breast cancer, universal adherence to routine screening is still a distant goal.
Mammography screening has been universally recognized as the best method
effectively to detect breast cancer (Anderson, Smith, Meishchke, Bowen, & Urban,
2003). Mammography is defined as “an x-ray of the breast taken by a machine that
presses against the breast while the picture is taken” (O'Malley et al., 2001). According
to a study by Anderson et al. (2003), “Screening refers to the testing of asymptomatic
individuals for the detection of occult disease.” Mammography is performed for two
primary purposes: screening and diagnosis. Screening mammography is used to detect a
breast abnormality before it can be detected by physical examination in a woman without
breast cancer symptoms. Diagnostic mammography is a procedure a woman undergoes if
she has exhibited a symptom such as a lump, which may indicate the presence of breast
cancer or whose screening mammogram indicated a possible cancerous growth.
The latest American Cancer Society Guidelines recommend that women at
average risk should begin annual mammography at age 40 and should continue for as
long as a woman is in good health (American Cancer Society, 2006a). Concordantly, the
National Cancer Institute recommends that women should begin mammography
screening at age 40 and be screened every one or two years, unless they are at higher than
average risk. The higher risk may be due to a personal history of breast cancer, family
history, genetics, long term use of hormone therapy, body weight, physical activity level,
breast density and alcohol use (National Cancer Institute, 2006). Despite these
recommendations, many women neglect to adhere to the recommendation of annual
screenings.
Ethnicity plays an important role in breast cancer. White women are more likely
to be diagnosed with breast cancer than are women of any other race or ethnicity in the
United States (Ries et al., 2005; U.S. Department of Health and Human Services, 2005).
However, African American women are more likely than other women in the country to
die from the disease. According to recent trends, new cases of breast cancer diagnosed
each year (incidence) have remained stable or decreased significantly during the past ten
years for white, African American, Hispanic and Native American Women (Centers for
prevalence of mammography in the past two years are women who lack health insurance
(40.2%) and immigrant women who have lived in the U.S. for less than ten years (52.3%)
(American Cancer Society, 2006a). Lower participation in mammography screening
among poorer women is very disconcerting, for these women are more likely to have
their breast cancers initially detected at an advanced stage when treatment is less
effective.
Past studies have examined factors which influence mammography screening
rates. These factors include physician recommendation (O'Malley et al., 2001), a
woman’s specific cancer worry and its impact on mammography adherence (Diefenbach,
Miller, & Daly, 1999), perceived barriers to screening among different demographic
groups (Austin, Ahmad, McNally, & Stewart, 2002; O'Malley et al., 2001), the influence
of a first degree family relative breast cancer diagnosis on other family members (Lemon
et al., 2006), and the associated risks and costs of screening (Humphrey, Helfand, Chan,
& Woolf, 2002). Menck and Mills (2001) identified elderly (65 years of age and older),
Hispanic, and African American females; as well as those women residing in non-urban
areas as high-risk groups who do not elect to use mammography screening (Menck &
Mills, 2001). There has been little research that compares the pattern of mammography
screening rates in female populations living in either urban or rural counties.
The purpose of this study is threefold. The first is to provide a comprehensive
literature review of mammography which includes the following information: history of
its use as a breast cancer prevention strategy; how specific populations are targeted for its
use; and the factors that impact a woman using mammography screening. The second
mammography facilities in Georgia and North Carolina. The final purpose is to assess
whether there are differential mammography screening rates in either urban or rural
counties located in Georgia and North Carolina and, if so, how state cancer plans address
this finding.
The objectives of this project are:
• To review the literature on mammography screening rates and the factors which
impact the use and success of mammography screening interventions;
• To analyze data on mammography screening and determine rates of use in both
urban and rural counties in the states of Georgia and North Carolina;
• To compare the mammography use rates in both urban and rural counties in
Georgia and North Carolina. This study will use the chi square test to determine
if any differences are statistically significant where a value of .05 or less is
significant;
• To determine the number of certified mammography facilities in both urban and
rural counties of Georgia and North Carolina; and
• To review the state cancer plans of the eight states included in Health and Human
Services Region IV (Alabama, Florida, Georgia, Kentucky, Mississippi, North
Carolina, South Carolina, and Tennessee) to see if they identify living in a rural
county as a risk for not getting screened.
The aim of this study is to test the null hypothesis: There is no significant
difference between mammography screening rates of women in either urban or rural
significant difference between the mammography screening rates of women living in
either urban or rural counties of Georgia and North Carolina.
Successfully determining mammography use rates will assist different health
organizations strategically target at-risk groups and develop more effective
interventions. The prospective data and information gathered will allow modifications in
program design and function so that positive contributions can be maximized and
negative effects minimized or avoided entirely. The implications of this study could be
applied to other cancers in which the success of treatment depends on early detection
from screening. The reduction of late-stage cancer diagnosis and prevention of breast
CHAPTER II
REVIEW OF LITERATURE
The discussion and examination of mammography screening use rates in either
urban or rural counties, as well as the subsequent development of an intervention to target
at-risk groups, would be incomplete without full exploration of all major content areas
included in a comprehensive literature review. Topics include: 1) A brief historical
overview of the development and use of mammography screening as a preventative
health tool 2) An exploration of factors which impact mammography screening use 3) a
detailed look at studies examining the effect of rural location on mammography use 4)
Studies examining the availability or accessibility of certified mammography facilities
and implications for future use of mammography screening.
History of Mammograms
The current use of mammography as a screening tool for breast cancer would not
have been possible without the following milestones. The first individual to contribute to
the development of mammography as a screening device was Albert Salomon, a surgeon
who used radiography to detect the spread of a breast tumor to auxiliary lymph nodes in
1913 (Gold, Bassett, & Widoff, 1990). Mammography was later pioneered by Stafford
L. Warren, a radiologist at Rochester Memorial Hospital, New York, who used it with
119 patients in combination with a “new” fine grain double-emulsion Kodak film which
helped clarify the presence of tumors or abnormal cell growth in breast tissue in 1930
(Bassett, 1991; Gold et al., 1990). As a result of using the new film in the mammography
process, Warren only made interpretative errors in eight of the 119 cases he examined.
At a conference in May of 1963, sponsored by the Cancer Control Program of the U.S.
Health Service at M.D. Anderson Hospital, a report was released on the usefulness
and reproducibility of mammography. Robert L. Egan, working at the M.D. Anderson
Hospital developed a direct film mammography technique (Bassett, 1991) which was
presented at this conference. His new technique was used in a nationwide mammography
study in which 24 institutions participated. The results of the study confirmed that 1) The
technique of mammography, as developed and taught by Egan, could be learned by other
radiologists 2) X-rays of acceptable quality could be produced 3) Using mammography
one would be able to discriminate between benign and malignant lesions and finally,
4) Mammography could be used to screen for cancer in asymptomatic women (Clark,
Copeland, & Egan, 1965). The ability to screen for breast cancer in asymptomatic
women, or those that appear to have no breast problems (American Cancer Society,
2006b), is crucial for catching breast cancer at an early stage. When breast cancer is
detected at an early stage, the five year survival rate is 98% (American Cancer Society,
2006c).
The first mammography machine was developed in 1966. Prior to this time,
mammographic images were produced by simply using a standard x-ray machine (GE
Healthcare, 2006). During this same time period, 1963-1966, Philip Strax, Louis Venet,
and Sam Shapiro conducted the first randomized controlled study of breast cancer
screening under the auspices of the Health Insurance Plan (HIP) of New York (Bassett,
1991; Gold et al., 1990). Of the 60,000 women who participated, half of them underwent
annual screening with mammography and physical examination for a period of four
decreased by 30% seven years after the study began. The long term benefits of screening
were also made apparent for participants who received annual screens and experienced a
24% reduction in breast cancer mortality after 14 years (Bassett, 1991; Gold et al., 1990).
Soon afterwards in 1967, the first commercial model of the “Senographe” (French
for picture of the breast) became available (GE Healthcare, 2006). It was the first
“dedicated” mammography unit, or the first unit manufactured strictly for mammography
(Gold et al., 1990). An improved model was introduced in the late seventies which
resulted from the marriage of both patient and doctor generated ideas as well as advances
in technology.
Another worthy contributor to mammography was a surgeon named Edward A.
Sickles, who revolutionized mammography screening by lowering the cost and creating
efficient ways in which to be screened. He lowered mammography costs by streamlining
radiologic and office operations to maximize patient throughput and reducing cost.
(Sickles, Webber, & Galvin, 1986). Sickles also championed the idea of using mobile
vans as sites for mammography screening situating them near large downtown office
buildings or at supermarkets so that working and nonworking women could undergo
screening rapidly and conveniently incorporate it into their day.
Not only was screening improving in cost and ease, but also in standards
guaranteeing its quality. In 1999, the Mammography Quality Standards Act (MQSA)
was passed. MQSA regulates the quality of mammography equipment. In order to
legally operate in the U.S.; all operational systems must pass MQSA requirements,
Mammography has evolved from simple radiography of mastectomy specimens to
the foremost method of breast cancer screening due to the endeavors of leaders in the
field who researched, wrote and lectured about it constantly. Because of their efforts,
many individuals after undergoing mammography screening are able to detect breast
cancer at an early stage and fully recover.
Barriers to Mammography Screening
Mammograms are not something that many women routinely receive, for it is
estimated that only 70% of women aged 40 and older have had a mammogram within the
past two years (Breen, Wagener, Brown, Davis, & Ballard-Barbash, 2001).
Mammography is underused by certain groups of women, in particular poor and minority
women. These two groups are particularly at-risk due to barriers they face. However,
some of the barriers that poor and minority women face are common barriers with which
many women struggle. Studies have examined many of these barriers which include fear
of pain, cost, transportation, perceived susceptibility, older age and, education level.
These barriers overshadow the many positive benefits that mammography screening
affords such as reducing breast cancer morbidity and mortality, by detecting cancer at an
earlier stage, and the positive reassurance a negative mammogram provides.
To identify those individuals who are at-risk for a poor screening profile, it is
essential to study non-modifiable structural and demographic factors such as age, income,
marital status, and ethnicity. Breast cancer incidence is increasing in white women age
50 years and older, stabilizing for African American women age 50 years and older and
decreasing for African American women under age 50 years (Smigal et al., 2006).
are less likely to receive mammograms than other populations. From 1992 through 2002
other racial and ethnic groups have experienced varying trends in mammography
screening. Mammography rates have increased among Asian Americans/ Pacific
Islanders (by 1.5% per year) and decreased among American Indians/Alaska Natives (by
3.5% per year) and have not changed significantly among Hispanics/Latinas (Smigal et
al., 2006). It is important to acknowledge that trends vary by age, race, and
socioeconomic status.
In order to structure an intervention that will be successful and effective in
convincing more women to seek mammography screening, it is important to identify
these perceived barriers. One of the most common barriers to scheduling a mammogram
is fear. However in some cases fear may act as a motivator for screening. The fear of the
mammogram is associated with fear of the medical establishment, and of the potential
pain associated with mammography. Fear of mammography may even be evoked by
horror stories told by friends and family (Engleman, Cizik, & Ellerbeck, 2005). One
suggestion for helping women cope with this type of fear comes from Engleman, Cizik &
Ellerbeck (2005) who recommend that a television be included in the waiting room and
that it should play an instructional video about the procedures involved with a
mammography so patients would know what to expect. This would help alleviate the
fear that a woman experiences waiting for the mammogram, particularly a woman who
has never had one.
Other fears women may have concerning mammography include the fear of
radiation, the fear that the procedure may prove embarrassing, and the fear that the
2004). The fear of receiving a diagnosis of breast cancer can be exacerbated by the time
spent waiting for results. In order to minimize or alleviate this fear, new ways of
obtaining mammography results quicker and with greater certainty must be devised.
While fear may deter some women from getting mammograms, it can also
motivate others to engage in regular screenings. Women who are more aware of their
health problems and risks for disease are more likely to adhere to screening guidelines.
For example, if cancer runs in an individual’s family, the individual is more likely to
have negative attitudes towards cancer and think their risk of getting cancer is greater
(Hailey, Carter, & Burnett, 2000). Even though studies suggest that women with a family
history of breast cancer are more likely to comply with breast screening guidelines
compared to those without a family history, screening in this group is still underutilized
(Anderson, Smith, Meishchke, Bowen, & Urban, 2003; Hailey et al., 2000; Rahman,
Dignan, & Shelton, 2003; Spyckerelle, Kuntz, Giordanella, & Ancelle-Park, 2002). This
may be because women with a relative or family member with cancer fear being
diagnosed with cancer themselves and neglect to get screened.
Differential access to mammography screening is an additional barrier that is
essential to address. Women who live in rural areas may have a more advanced stage of
disease when diagnosis finally occurs. The group most at risk for late stage diagnosis due
to ineffective screening is older women age 70 years and up. Transportation issues,
psychosocial barriers, low literacy levels and institutional barriers are all contributing
factors to low screening rates. The mortality rate among women age 70 years and older
is twice that for women of 55 years of age (Peek, 2003). Screening among the elderly is
women, elderly women are also more likely to have competing mortality risks from
cardiovascular disease and other illnesses. Many early studies, even after adjusting for
comorbidity, age, race and quality of life, found that it was still more cost effective to
screen all women with mammography (Eddy, 1987; Mandelbalatt et al., 1992). These
studies contributed to the passage of the 1991 Congressional decision to fund biennial
mammograms for women without setting an upper age limit (Peek, 2003). Another
benefit to screening women age 70 years and older is that the sensitivity of
mammography increases with age and ranges between 70% and 95% accuracy (Shen &
Zelen, 2001).
One way to assure adequate medical access to women age 70 years and older is
using in-reach activities, which are defined as interventions held within the primary care
setting, to increase screening mammography (Champion & Skinner, 2003). Some
examples of in-reach activities include displaying posters, or playing videotapes in
patient waiting rooms, having a reminder system for mammography appointments in
place for patients and physicians, and using targeted incentives such as gas and food
coupons to encourage screening. One other way to solve the issue of limited access of
mammography screening among the elderly is to use patient navigators, who help
patients make appointments, arrange transportation, locate facilities and even accompany
patients to their mammogram screening.
Another barrier to mammography use is encouraging physicians to make the
recommendation to receive a mammogram. Due to the nature of the physician/client
relationship, physicians have the ability to pass along vital health information and
However, many women do not get such a recommendation from their physician. To
determine the level of impact physician recommendations have had on mammography
screening, past studies have examined what influences physician recommendations for
mammography (Nutting et al., 2001). Factors which may affect the willingness of a
patient to follow through with a physician recommendation include the physician’s area
of expertise (Chamot & Perneger, 2003), the physician’s communication skills with their
patients (Lane, Messina, & Grimson, 2001), the sex of the physician (Lurie et al., 1993),
the use of physician recommendation in addition with reminder methods (Taplin,
Anderman, Grothaus, Curry, & Montano, 1994), the patient’s insurance type (Gorin et
al., 2006), and the physicians’ impact on underserved communities (Gorin et al., 2006).
Having a physician make a recommendation is still better than not having a
recommendation at all which can be common depending on the type of health insurance
an individual possesses. Whether or not a patient has fee for service versus a managed
care organization can have consequences on the type of preventative care an individual
receives. A managed care organization (MCO) is defined as being the type of health care
plan an individual purchases through a health maintenance organization (HMO), in which
the plan requires that the individual receive care from specified HMO physicians or
physicians referred by that HMO physician. There is also a stipulation that the policy
holder designate a primary care doctor, group of doctors, or a specific clinic that the
policyholder must go to for all routine, non-emergent care (Miller & Luft, 1994). In
contrast, an individual is classified as being enrolled in a fee for service (FFS) plan if he
or she is privately insured and does not meet the criteria for enrollment in a MCO plan
that persons belonging to MCOs had access to more preventative services (which
included physical examination, blood pressure measurement, cholesterol testing, Pap
testing, clinical breast examination, mammography and prostate examination) than those
in FFS (DeLaet, Shea, & Carrasquillo, 2002). Also, among Hispanics the difference
between MCO and FFS enrollees and use of preventative services was greatest among
those of the lowest income and education level. African Americans in MCOs received
more preventative services than those in FFS (DeLaet et al., 2002). The delivery of
preventative health services in MCOs can be attributed to the emphasis that MCOs place
on preventative services. In fact, it was found that Hispanic women in FFS plan were
less likely than non-Hispanic whites to report having Pap smears, mammograms and
breast examinations. This is reflective of the fact that MCOs have undertaken initiatives
to improve the care of patients from different ethnic backgrounds through culturally
appropriate community outreach activities.
The Effect of Urban or Rural Residency on Mammography Use
A newer barrier that has been studied recently is the whether the location in which
a woman lives affects her frequency of mammography screening. The location in which
a woman lives can be tied to other barriers such as transportation. Traveling a long
distance may produce an additional burden and mammography screening may be less
accessible in certain geographical areas. In a study conducted by Engelmann et al. (2002)
it was found that mammography screening rates were lower in counties that only had
mobile facilities and that mammography screening rates were higher in counties that had
permanent facilities. The distance one has to travel to go to a permanent mammography
This trend was determined by a study conducted in Georgia where it was found that rural
patients who had breast cancer were more likely to have an advanced form of the disease
at diagnosis as compared to urban patients (Liff, Chow, & Greenberg, 1991). Rural areas
may also be disadvantaged when it comes to mammography screening because of their
smaller populations. A study by Marchick & Henderson (2005) found a strong
association between population size and the total number of mammography facilities.
Determining geographical disparities in health services, specifically
mammography, can be an important tool for policymakers trying to decide where to focus
limited resources and can be helpful when developing purposeful research regarding
interventions. A study conducted by Leger et al. (2002) found that health behaviors may
be related to particular locales. They hypothesized this may be due to the fact that
hard-to-reach populations “may remain outside the focus of intervention research” (Legler,
Breen, Meissner, Malec, & Coyne, 2002). In fact they found that of the southeastern
states, no intervention research targeting African Americans mammography use had
occurred in Tennessee, Mississippi, Louisiana, Alabama, South Carolina, or Florida
(Legler, Breen, Meissner, Malec, & Coyne, 2002). They concluded that states without
studies were largely rural and had relatively little research infrastructure. Legler et al.
also found that a common predictor of mammography screening use was education and
income and that, “Counties with large percentages of white-collar workers were
associated with higher mammography use and counties with higher proportions of
persons with less formal education (ninth grade or less) correspond to lower use” (Legler
In conjunction with urban or rural residence, ethnicity has been found to have an
impact on mammography screening use. Coughlin et al. (2001) found that women in
metropolitan areas were more likely than women in rural areas to have had a recent
mammogram and the association with either rural or nonrural residence was even
stronger with African American and Hispanic women as compared to White women
(Coughlin, Thompson, Hall, Logan, & Uhler, 2002). Urban residents may use
preventative services more often because they may have a greater availability of medical
services in urban areas. Another contributing factor could be that women living in rural
areas have limited access to health care practitioners and to fewer preventative health
care services (Coughlin et al., 2002).
Georgia and North Carolina’s current mammography programs
In 1990, to improve women’s access to screening for breast and cervical cancers,
Congress passed the Breast and Cervical Cancer Mortality Prevention Act. This act
guided the CDC’s creation of the National Breast and Cervical Cancer Early Detection
Program (NBCCEDP) which provides support in all 50 states, the District of Columbia,
four U.S. territories, and thirteen American Indian/Alaska Native tribes or tribal
organizations. The purpose of the program is to help low-income, uninsured, or
underinsured women gain access to breast and cervical cancer screening and diagnostic
services (Centers for Disease Control and Prevention, 2006/2007).
Since 1991, more than 2.7 million women have been served by NBCCEDP,
which provided more than 6.5 million screening examinations, and diagnosed more than
26,000 women as having breast cancer. NBCCEDP was responsible for screening
Control and Prevention, 2006/2007). The CDC estimates that only 20% of eligible
women aged 50 to 64 years are currently taking advantage of the NBCCEDP program
(American Cancer Society, 2006a). To achieve a greater impact on populations who are
neglecting to get mammography screenings, in 2000 Congress passed the Breast and
Cervical Cancer Prevention and Treatment Act which gives states the option to offer
women in NBCCEDP access to treatment through Medicaid. Currently all fifty states
and the District of Columbia have approved this Medicaid option. American
Indians/Native Alaskans are also eligible for health services provided by the Indian
Health Service or by a tribal organization with the passage of the Native American Breast
and Cervical Cancer Treatment Technical Amendment Act of 2001 (Centers for Disease
Control and Prevention, 2006/2007).
NBCCEDP provides an array of strategies to reach underserved women including
program management, screening and diagnostic services, data management, quality
assurance and quality improvement, evaluation, partnerships, professional development
and recruitment (Centers for Disease Control and Prevention, 2006/2007). To be eligible
for the NBCCEDP program a family’s income must be below 250% of the federal
poverty level. In 2003, the annual income levels for a family of four at 200% and 250%
of poverty were approximately $37,000 and $46,000, respectively (United States
Department of Health and Human Services, 2007; US Census Bureau).
A study conducted by Tangka et al. (2006) examined the NBCCEDP to determine
whether it served the screening needs of underserved women. They found that in
2002-2003, of all U.S. women aged 40-64 years (who are eligible for free mammography
below 250% of the federal poverty level and of those women, only 528, 622 (13.2%)
received a Program funded mammogram. The ethnic group that constituted the largest
number of women eligible for the Program was white women, of which there were two
million in total. The ethnic groups who had the greatest number of women screened were
American Indians and Alaska Natives. States varied in percentages of eligible women
screened from 2% to 79% and the amount of women eligible were greater in heavily
populated states such as California, Texas, New York, and Florida than in other states.
The state with the greatest number of eligible women for the NBCCEDP Program was
New Mexico. In Georgia, only 6.8% of 95,000 eligible women got screened. The
poverty criterion for Georgia was 200%, or earning an income for a family of four
equaling $37,000 per year. In North Carolina only 10.3% of 137,000 eligible women got
screened, the poverty criterion was also 200% (Tangka et al., 2006).
A new law to try to increase eligible women to participate in the NBCCEDP
program is called the Patient Navigator, Outreach and Chronic Disease Prevention Act of
2005 (HR 1812/S898) which was signed by President George W. Bush on June 29, 2005.
To help alleviate the barriers to quality health care that medically underserved individuals
face, the bill provides grants to help set up navigator programs, which in turn help
improve access to prevention screenings and other services. The navigator systems will
also encourage increased screening participation of women who lack a consistent source
of care, and help alleviate the difficulty of navigating the health care system, so that more
women will participate in breast and cervical cancer screening, diagnosis, and treatment.
A program specific to North Carolina was the FoCaS Project, a breast and
demonstration project designed to test interventions to increase rates of screening in
low-income women. It was conducted in two North Carolina counties, Forsyth and Guildford,
one of which served as a control group among residents of low-income housing
communities. The intervention city encouraged screening by chart reminders, exam
room prompts, as well as staff and patient education. The community outreach
component included educational sessions and literature distribution at community events
and church activities. As a result of the intervention, the proportion of women who
received mammography within the last two years increased from 31% to 56% (American
Cancer Society, 2004).
There remains a need for services among low income underserved populations.
In 2003, there were more than 2.3 million uninsured, low income women aged 40-64
years who did not receive recommended mammograms from either the Program or other
sources. It is important to figure out how to increase efficiencies of the NBCCEDP
Programs and how to serve more women with existing resources. A study found that the
average cost of screening a woman through the Program was lower for greater numbers
of women because as average cost decreased, the number of women screened increased
(Mansley, Dunet, May, Chattopadhyay, & McKenna, 2002). One suggestion to increase
the number of eligible women screened through NBCCEDP Programs includes
improving collaboration and coordination with other providers that serve a similar client
population (Tangka et al., 2006). Besides examining the numbers of women getting
screened, an additional key component to examine is whether or not mammography
Assessment of Availability of Mammography Services
Additional barriers that have been a focus in the failure of women to obtain a
mammogram include the closure of mammography facilities and service curtailments,
which contribute to making it more difficult for women to schedule and to obtain the
procedure, within a reasonable amount of time. The primary concern is that women are
not receiving mammograms due to limitations in access. The Food and Drug
Administrations (FDA’s) database of mammography facilities show 9,512 certified
domestic operations as of June 2001. In other years, there were 9,558 certified facilities
(46 more) in January of 2000 and 9,314 facilities (198 fewer) on January 1, 1999. In
[image:32.612.101.548.388.479.2]comparison to 1994, there were 10,119 facilities were open and 9,956 in 1997.
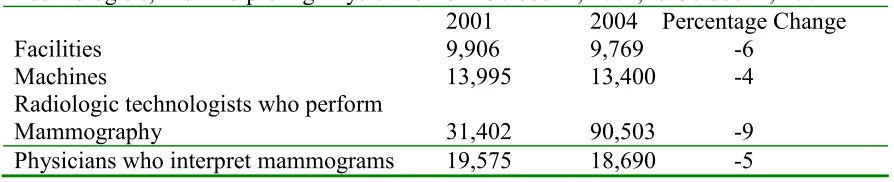
Table 1: Changes in Numbers of Mammography Facilities, Machines, Radiologic Technologists, and Interpreting Physicians from October 1, 2001, to October 1, 2004
2001 2004 Percentage Change
Facilities 9,906 9,769 -6
Machines 13,995 13,400 -4
Radiologic technologists who perform
Mammography 31,402 90,503 -9
Physicians who interpret mammograms 19,575 18,690 -5
Source:Government Accountability Office analysis of Food and Drug Administration’s (FDA)
Mammography Program Reporting and Information System database on mammography capacity
elements.
Nationally, the number of mammography facilities has declined by 4.5% since 1997 and
6.0% by 1994 (Eastern Research Group Inc., 2001). However recent FDA analysis of the
mammography facility database found that the 1994 estimates of mammography facilities
were inflated due to duplicate listings of facilities that had received more than one
accreditation (Eastern Research Group Inc., 2001).
Besides the reduction in mammography facilities in states, the number of facilities
of females who are referred for a mammogram or seek screening or diagnostic
mammograms determine the actual demand for mammography services. The FDA
statistics of demand are based on submittals of data by facilities at the time of their
accreditation and due to that fact, may underestimate the current level of services if
demand is increasing over time. The report conducted by the Eastern Research Group
(2001) found that the number of mammography facilities in Georgia decreased from 289
in 1994 to 268 in 2001 and that the number of mammography facilities in North Carolina
increased from 242 in 1994 to 253 in 2001 (Eastern Research Group Inc., 2001). This
may reflect the study’s findings which concluded that any problems with mammography
access were localized rather than widespread.
Another study conducted in 2006 by the United States Government
Accountability Office examined mammography facilities and whether the nationwide
capacity was adequate. The key elements as defined by the Government Accountability
Office (GAO) that make up mammography capacity are the total numbers of
mammography facilities, machines, and radiologic technologists (United States
Government Accountability Office, 2006). To determine the nation’s current
mammography capacity GAO asked mammography experts for estimates of the amount
of time it takes to perform both a screening mammogram and to perform a diagnostic
mammogram. Then, GAO used those estimates, combined with the FDA data on the
number of machines available in 2003, to calculate the number of mammograms that
could have potentially been performed in 2003. From 2001 to 2004 the number of
mammography facilities nationwide decreased from 9,306 to 8,768. There was a net loss
providing services (United States Government Accountability Office, 2006). Most
facilities closed due to financial considerations. Adding to the financial difficulty of
mammography facilities were retaining and recruiting radiologic technologists to perform
mammography and other specialty physicians to interpret mammograms.
It was observed that access problems may have resulted from the loss of facilities,
particularly for women who were medically underserved such as those who have a low
income, or lack health insurance. Contributing to the access problems were the lengthy
weight times and the increased distances individuals had to travel when a facility in their
county closed. Those women who were medically underserved inherited a significant
burden by having to take extra time away from work or family responsibilities. In
addition, these women were of particular concern because those who lack health
insurance or have low incomes are the same women with lower than average screening
mammography rates.
Interestingly, a study conducted in 2002 by GAO found that most availability
problems occurred in certain metropolitan areas like Houston and Los Angeles, but the
greatest loss in capacity occurred in rural counties of Baltimore including the counties of
Anne Arundel, Baltimore, Baltimore City, and Prince George’s. The loss of
mammography machines was calculated as a 25% decrease and 121 counties, most of
them rural, were most affected (Government Accountability Office, 2002). Another
surprising find by the same study was that during their follow up at 55 rural and
metropolitan counties where reductions occurred in facilities or machines, lengthy
appointment waiting times were primarily found in metropolitan locations. The study
neighboring county with the result being that the longest waiting time was one month or
less, which was considered to be reasonable. The travel distance a woman had to travel
from one county with decreased resources to a neighboring one was less than 40 miles,
which officials considered common in rural areas. Another option rural county's had for
women was offering mobile mammogram facilities that traveled to their area.
The study conducted by GAO (2006) did find that the number of mammograms
performed by U.S. machines was substantially lower than the maximal numbers that
could be performed. They estimated that one machine and one radiologic technologist
could perform three mammograms per hour or 24 mammograms in an eight hour day.
Therefore, there was a potential maximal capacity of 6,000 mammograms per machine
per year and that there is unused capacity nationwide. Of most concern was the
dwindling numbers of radiologists and radiologic technologists entering the field every
year which may not be adequate to serve the increasing population of women 40 and
older. This may lead to future access problems. Findings from a 2004 survey of
community-based mammography facilities in three states indicated that 44% of facilities
reported experiencing a shortage of radiologists and 46% reporting had some level of
difficulty in maintaining adequate numbers of qualified technologists (D'Orsi & et al,
2005).
Since the main access issues that exist in certain geographical areas pertain to
long wait times and traveling great distances to get mammography screenings, most
experts in the study conducted by GAO (2006) recommended that it was best if the wait
time for screening mammography did not exceed 30 days and if the wait time for
and capacity relevant to mammography screening, another important way to encourage
women to get screened is to promote the importance of breast cancer screening in state
cancer plans and take steps to eliminate the factors which may prevent a woman from
getting screened.
Comprehensive Cancer Control-State Cancer Plans
Comprehensive Cancer Control (CCC) is a collaboration among key national
organizations including: the Centers for Disease Control and Prevention, the National
Cancer Institute, the American Cancer Society, C-Change, the Chronic Disease Directors,
the Intercultural Cancer Council, North American Association of Central Cancer
Registries and the American College of Surgeons, the Lance Armstrong Foundation, and
the National Association of County and City Health Officials (Centers for Disease
Control and Prevention, 2006). Working together, they integrate and coordinate
anti-cancer efforts, pool resources to promote anti-cancer prevention, improve anti-cancer detection,
increase access to health and social services, and reduce the burden of cancer. The main
way this is done is through the formation and implementation of state CCC plans. In
2000, only twelve states had plans, but that has increased to 34 in 2004 due to state
cancer coalitions which create enthusiasm and momentum by developing, implementing
and evaluating CCC plans (Black, Alvarado-Cowens, Gershman, & Weir, 2005).
Currently there are 49 states that have cancer plans as well as four tribes and eight
territories (American Cancer Society, 2007).
One of the reasons CCC was started was to help states overcome barriers to
reduce the burden of cancer incidence and mortality. One such barrier is that of
It is the tendency in the United States to direct money to programs for specific forms of
cancer, like lung or colorectal, or to risk-factor programs like smoking or sun exposure.
Through CCC, states and private organizations, as well as non-profit partners, collaborate
on an ongoing basis to maximize the impact of limited resources and in turn do a better
job of preventing cancer and saving lives. Other barriers that states encounter when
developing and implementing state plans are; ineffective use of data (Black et al., 2005),
lack of community ownership, programmatic change (Kerner et al., 2005), sustainability,
limited resources, competition (True, Kean, Nolan, Haviland, & Hohman, 2005), lack of
coordination, disparities in knowledge, and insufficient information due to a lack of
evaluation (Given, Bruce, Lowry, Huang, & Kerner, 2005).
The state cancer plans are specific to the health needs of the particular state, but
generally have a section on each of the following cancers; breast, cervical, colorectal,
prostate, skin, and testicular. They examine particular health behaviors and living and
working conditions which may put an individual more at increased risk for particular
cancers.
This study examined the eight states in HHS Region IV (United States
Department of Health and Human Services, 2004). These states include Alabama,
Florida, Georgia, Kentucky, Mississippi, North Carolina, South Carolina and Tennessee.
The Comprehensive Cancer Control Plans of these eight states were examined to
determine if the plans listed whether living in a rural county can be a risk factor for
CHAPTER III
METHODS AND PROCEDURES
IRB and Data Management
The protocol for this study was reviewed and approved by the Georgia State
University Institutional Review Board (IRB) on March 23, 2007 under the exempt review
process. Data that are used for this research came from the Behavior Risk Factor
Surveillance System (BRFSS). BRFSS is a state-based telephone survey administered by
the Centers for Disease Control and Prevention (CDC). The data is published with the
removal of personal identifiers in electronic format and is publicly accessible via the
CDC website. There was no sensitive context data used in the original data collection.
Research Design
This study was designed to: (1) determine whether there is a statistically
significant difference in urban or rural mammography screening rates, (2) assess the
availability of mammography screening facilities and (3) examine whether eight state
cancer plans in Health and Human Services (HHS) Region IV address differential
mammography screening rates in rural counties.
Data from the years 2002 and 2004 BRFSS were used to calculate mammography
screening rates in Georgia and North Carolina for both urban and rural areas. The
population of the respective states’ urban and rural counties was obtained from the 2005
American Community Survey (ACS) provided by the U.S. Census, which is a nationwide
survey of approximately three million households and which is designed to provide data
on how communities are changing. The estimated population counts used
are the most recent estimates from the Census Bureau’s Population Estimates Program.
The U.S Census breaks down population estimates for the 2005 ACS into metropolitan or
micropolitan statistical areas. A metropolitan statistical area contains at least one
population nucleus with a population of 50,000 or more. Rural counties fall under the
classification of micropolitan statistical areas, meaning they have at least one population
nucleus with 10,000 to 49,999 people. Population estimates for women 18 to 65 years of
age in each county were used (U.S. Census Bureau, 2006).
The BRFSS data was crucial in determining if a difference exists among urban or
rural mammography screening rates. The BRFSS contains information on
mammography screening rates for Georgia and North Carolina for years 2002 and 2004.
The BRFSS is a cross-sectional, state-based telephone survey of adults aged 18 years or
older to track health conditions and risk behaviors. The BRFSS has been administered by
the Centers for Disease Control and Prevention annually since 1984 (Centers for Disease
Control and Prevention, 2006).
The Centers for Disease Control and Prevention conduct at least 4,000 interviews
per state yearly. Telephone numbers are randomly selected by region within each state.
Bias is removed from the sample by using standard weighting which affects both the
point estimate (bias) and confidence intervals (precision). The CDC developed a
standard core questionnaire that allows comparison data across states. Georgia and
North Carolina were chosen for this study based on proximity and comparability in size
and population. The BRFSS mammography screening data for the years 2002 and 2004
Each state employs a BRFSS state coordinator, who provided the raw state level
data for Georgia and North Carolina for this study. The North Carolina BRFSS state
coordinator provided the data for years 2002 and 2004 on a CD-ROM. The Georgia
BRFSS state coordinator sent the data for Georgia’s 2002 and 2004 BRFSS via e-mail.
The 2002 and 2004 data for Georgia and North Carolina were checked for
accuracy and matching variables. The data then were merged together for ease of
analysis. The mammography screening rates for women who lived in urban counties by
state were calculated and recorded, and the same was done for rural counties by state.
To determine the availability of mammography screening facilities in Georgia and
North Carolina, data from the U.S. Food and Drug Administration’s (FDA) was utilized
to obtain the address of the facilities. The FDA 2005 data was used because that is the
most recent year the U.S. Census population estimates were available at the county level.
In addition, FDA 2005 data was used to best measure availability of mammography
facilities at the time of the BRFSS survey. Zip code information was used to determine
the county location of each certified mammography facility. As described previously,
each county in Georgia and North Carolina was designated as either urban or rural
utilizing the USDA Rural/Urban Continuum Codes. Each facility’s name, address, city,
state, zip code, county and its urban or rural designation was entered into an excel
spreadsheet. At the study author’s request, the Georgia Division of Public Health and the
North Carolina Division of Public Health utilized the facility spreadsheet to map the
Georgia and North Carolina mammography facilities. Using the data provided by the
2007 data also was used to measure whether there had been a change in availability of
mammography facilities and was mapped using the same process as the 2005 data.
The State Comprehensive Cancer Plans for the eight states in Health and Human
Services (HHS) Region IV (Alabama, Florida, Georgia, Kentucky, Mississippi, North
Carolina, South Carolina, and Tennessee) were reviewed to determine if the plans address
differential screening rates among women who live in rural counties. A search of the
documents for the terms “urban, rural, metropolitan, non-metropolitan, county and
residence” was made and the frequency of the terms used in the plans and how they were
used were recorded into tables.
Research Variables
Variables for the specific state STATE (1=Georgia, 2=North Carolina) were created
and variables for the data year YEAR (1=2002, 2=2004) were created to ensure that data
could be analyzed individually by state and year. The variable for either urban or rural
county was created by looking up the state Federal Information Processing Standards
(FIPS) codes (Georgia=13, North Carolina=37), county FIPS codes by state (see
Appendices A, B). Each county in each state is given a three digit FIPS code. Urban or
rural classification was determined using Rural-Urban Continuum Codes compiled by the
United States Department of Agriculture (USDA) in 2003. A “rural” county was defined
as a county located in a “non metropolitan” area and an “urban” county was defined as a
county located in a “metropolitan” area. The variable for urban or rural county
classification was CTYCODE (county code) recoded as (1=urban, 2=rural). There was
also a variable for SEX (1=male, 2=female) which was filtered for females only to be
NUMWOMEN (1=0, 2=1, 3=2 or more);, whether the participant had health coverage
HLTPLAN (1=yes, 2=no); if the participant had a personal physician PERSDOC (1=yes,
2=no); the age of the participant AGE (1=18-39, 2=40-59, 3=60+); level of education
EDUCA (1=less than high school, 2=high school, 3=more than high school); employment
status EMPLOY (1=employed, 2=unemployed); income level INCOME2 (1=above the
poverty level, 2=below the poverty level); if the participant ever had a mammogram
HADMAM (1=yes, 2=no); how long since the participant’s last mammogram
HOWLONG (1=within the past year, 2=within the past 2-3 years, 3=five years or more);
and the participants race RACE2 (1=white, 2=African American, 3=other, 4=Hispanic).
Ages 40 years and above were the only examined age groups covered by screening
standards, so ages 18-39 were excluded in the analysis.
The BRFSS questions that were used in this study included:
1. What is the number of adult women in the household?
2. Do you have any kind of health care coverage, including health insurance, prepaid
plans such as HMO’s, or government plans such as Medicare?
3. Do you have one person you think of as your personal doctor or health care
provider? (If no, ask “Is there more than one or no person that you can think of?)
4. What is your age?
5. Are you currently…? Employed for wages, self-employed, out of work for more
than 1 year, out of work for less than 1 year, a homemaker, a student, retired, or
6. Is your annual income from all sources- less than $10,000, less than $15,000, less
than $20,000, less than $25,000, less than $35,000, less than $50,000, less than
$75,000, $75,000 or more?
7. A mammogram is an x-ray of the breast to look for breast cancer. Have you ever
had a mammogram?
8. How long has it been since your last mammogram?
9. Which one of these groups would you say best represents your race? White,
black or African American, Asian, Native Hawaiian or Other Pacific Islander,
American Indian, Alaskan Native, Other, do not know/not sure, multiracial?
Statistical Analysis
Statistical programs that are available in SPSS® 15.0 were used in this study.
Initially, descriptive statistics were calculated to establish prevalence of independent
health variables (i.e., income level, education level, employment, having had a
mammogram, etc.) in urban or rural counties. Subsequently, statistical significance was
established by using chi-square tests and calculating 95% confidence intervals and P
values. The chi-square tests examined the relationship between the dependent variable
(mammography screening) and the independent variables (income, employment,
education, number of females in the household, etc.). The larger the chi-square, the less
likely it is that difference is due to chance. A P value less than five percent means that
the probability is not due to chance.
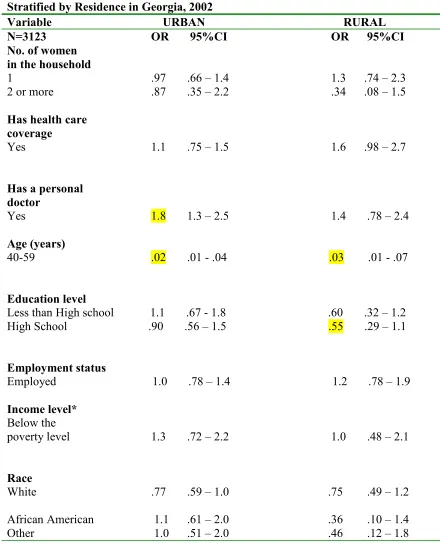
The data retrieved from 2002 and 2004 were compared using logistic regression
analysis. “Logistic regression allows you to test models and predict categorical outcomes
with the dependent variable being the question, “Have you had a mammogram?” after
controlling for the state, year and county code (urban or rural). The last statistical test
performed was the multivariate logistic analysis. This statistical test was conducted to
determine if all confounding variables were equally accounted for, which independent
variables had a significant association with mammography.
Multivariate logistic regression also was used to determine at what age women obtain
mammography screenings in Georgia or North Carolina in 2002 and 2004, and
differences that might exist at the county level. This statistical test was used after
controlling for state, year, county code and age. Using this regression model a series of
independent variables were tested in order to determine if mammography screening is
CHAPTER IV FINDINGS
An examination of all relevant data (as described in Chapter III) indicated that
residence in an urban or rural county did not significantly impact mammography use.
However, age, education level, employment status, income level and race were
significantly associated with mammography use as indicated by the chi square statistical
test and calculated P values of .05 or less. There were a number of variables tested using
the 2002 Georgia and North Carolina data that were not statistically significant for
mammography screening rates when comparing residence in an urban versus a rural
county. These variables were the number of women in the household, the time period
since the woman’s previous mammogram and the time period from previously having
had a mammogram. Health care coverage was found to be significantly associated with
mammography use only for North Carolina in both rural and urban counties for 2002.
Although there was not a predominate pattern of difference in mammography
usage in the urban and rural counties of Georgia and North Carolina, the statistical tests
and relationships established between mammography usage and associated variables
echoed the findings of the literature review. Mainly, these findings demonstrated that
women who obtain regular medical care and have health insurance are more likely to get
screened than women who are less educated (i.e., have a high school diploma or less
schooling).
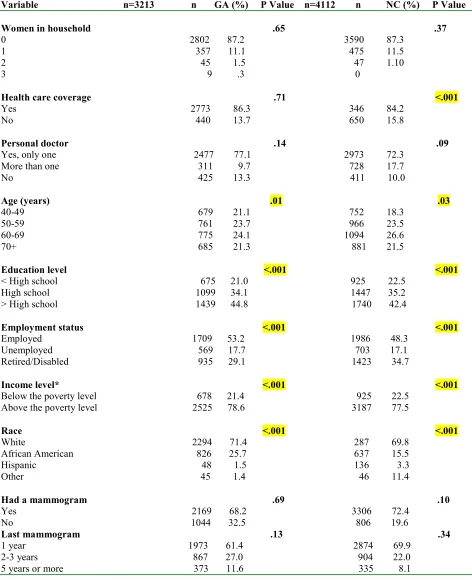
Of the 5,065 subjects who participated in the Georgia Behavior Risk Factor
Surveillance System (BRFSS) in 2002, 3,213 (63.4%) were female. Out of the 6,712
participants of the North Carolina BRFSS survey in 2002, 4,112 (61.3%) were female.
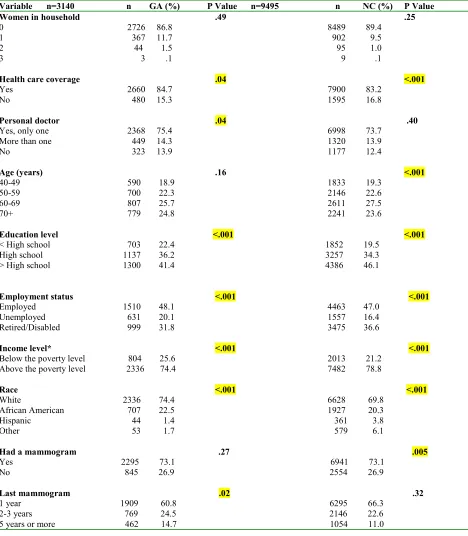
For the BRFSS in 2004, there were 5,044 total participants in Georgia of which 3,140
(62.3%) were female. In North Carolina, 15,053 participants engaged in the 2004
BRFSS study, of which 9,495 (63.1%) were female.
As shown in Figure 1, the women who lived in Georgia and participated in the
2002 BRFSS survey, 2,200 (68.5%) women lived in urban counties and 1,013 (31.5%)
lived in rural counties. In the 2004 Georgia BRFSS survey, 1,913 (61%) of women
surveyed lived in urban counties and 1,227 (39%) of women surveyed lived in rural
counties. For the 2002 BRFSS in North Carolina, 3,046 (71.4%) women lived in urban
counties and 1,066 (25.9%) lived in rural counties. The data from the 2004 North
Carolina BRFSS reported 6,043 (63.6%) women living in urban counties and 3,452
[image:46.612.137.484.461.685.2](36.4%) women living in rural counties.
Figure 1. Participants who answered the BRFSS, county of residence in GA and NC in 2002 and 2004
Number of Participants for the BRFSS for Georgia and North Carolina for Women Living in Urban
Versus Rural Counties
0 1,000 2,000 3,000 4,000 5,000 6,000 7,000
2002 2004 2002 2004
Georgia North Carolina
N
u
m
b
e
r
o
f
P
a
rt
ic
p
a
n
ts