Adapting k-means for Clustering in Big Data
Mugdha Jain
Gurukul Institute of Technology Kota, Rajasthan
India
Chakradhar Verma
Gurukul Institute of TechnologyKota, Rajasthan India
ABSTRACT
Big data if used properly can bring huge benefits to the business, science and humanity. The various properties of big data like volume, velocity, variety, variation and veracity render the existing techniques of data analysis ineffective. Big data analysis needs fusion of techniques for data mining with those of machine learning. The k-means algorithm is one such algorithm which has presence in both the fields. This paper describes an approximate algorithm based on k-means. It is a novel method for big data analysis which is very fast, scalable and has high accuracy. It overcomes the drawback of k-means of uncertain number of iterations by fixing the number of iterations, without losing the precision.
General Terms
Clustering.
Keywords
Big data mining, big data analysis, approximate k-means, clustering.
1.
INTRODUCTION
The rate of data creation at present has increased so much that 90% of the data in the world today has been created in the last two years alone.[1] This huge amount of data is being viewed by business organizations and researchers as a great potential resource of knowledge that needs to be discovered. Traditional methods of data analysis and management do not suffice. New technologies to deal with this data called Big Data are required. The term Big Data refers to large-scale information management and analysis technologies that exceed the capability of traditional data processing technologies [2]. The incorporation of Big Data is changing Business Intelligence and Analytics by providing new tools and opportunities for leveraging large quantities of structured and unstructured data.
Big Data is notable not because of its size, but because of its relationality to other data. Due to the methods used to store the data, Big Data is fundamentally networked (threaded with connections). But these connections are not useful directly. The actual value comes from the patterns that can be derived from the related pieces of data about an individual, about individuals in relation to others, about groups of people, or simply about the structure of information itself [3]. Besides this, Big Data has enormous volume, high velocity, much variety and variation. These features of Big Data present the main challenges in analyzing Big data which are: (1) Efficient and effective handling of large data, (2) Processing time and accuracy of results trade –off; and (3) Filtering important and relevant data from all the data collected.
Traditionally, large data is handled through numerous data mining techniques. Recognizing patterns among data must borrow ideas from Machine learning algorithms. Thus, Big data analysis needs fusion of techniques for data mining with
those of machine learning. The k-means algorithm is one such algorithm which has presence in both the fields.
K-means[4, 5, 6] is one of the most famous partition clustering algorithms because it is a very simple, statistical and quite scalable method. Also it has linear asymptotic running time with respect to any variable of the problem. Yet, k-means cannot be used for Big Data analysis directly. It needs to be adapted to deal with sparse values, heterogeneity and velocity.
This paper emphasizes the need of filtering data before it is analyzed for information. The strategic information, that the Business Analysts seek, always has some defined line of interest. Filtering of data should reflect this so that results of analysis can be of value to the analysts. Also, given the high velocity of Big Data, the research should be directed towards approximate and heuristic solutions for clustering instead of ideal ones. Finding ideal clusters consumes time which in some cases may render the information deduced to be stale. Hence, an approximate algorithm which reduces the complexity of classic k-means by computing over only those attributes which are of interest is proposed here. The drawbacks of traditional clustering algorithms have been identified and the proposed solution is an effort to overcome them.
2.
CHALLENGES IN BIG DATA
2.1
Defining Big Data
Despite the realization that “Big Data” holds the key to many new researches, there is no consistent definition of Big Data. Till now, it has been described only in terms of its promises and features (volume, velocity, variety, value, veracity). Given below are few definitions by leading experts and consulting companies:
•The IDC definition of Big Data (rather strict and conservative): “A new generation of technologies and architectures designed to economically extract value from very large volumes of a wide variety of data by enabling high-velocity capture, discovery, and/or analysis" [7].
•Demchenko et al [10] proposed the Big Data definition as having the following 5V properties: Volume, Velocity, Variety that constitute native/original Big Data properties, and Value and Veracity are acquired as a result of data initial classification and processing in the context of a specific process or model.
It can be concluded that Big data is different from the data being stored in traditional warehouses. The data stored there first needs to be cleansed, documented and even trusted. Moreover it should fit the basic structure of that warehouse to be stored but this is not the case with Big data it not only handles the data being stored in traditional warehouses but also the data not suitable to be stored in those warehouses. Thus there is requirement of entirely new frameworks and methods to deal in Big Data. Currently, the main challenges identified for the IT Professionals in handling Big data are: i.)The designing of such systems which would be able to handle such large amount of data efficiently and effectively. ii.)The second challenge is to filter the most important data from all the data collected by the organization. In other words we can say adding value to the business.
2.2
Clustering Challenges of Big Data
Clustering in Big data is required to identify the existing patterns which are not clear in first glance. The properties of big data pose some challenge against adopting traditional clustering methods:
Type of dataset: The collected data in the real world contains both numeric and categorical attributes. Clustering algorithms work effectively either on purely numeric data or on categorical data; most of them perform poorly on mixed categorical and numerical data types.
Size of dataset: The size of the dataset has effect on both the time-efficiency of clustering and the clustering quality (indicated by the precision). Some clustering methods are more efficient than others when the data size is small, and vice versa.
Handling outliers/ noisy data: Data from real applications suffers from noisy data which pertains to faults and misreported readings from sensors. Noise (very high or low values) makes it difficult to cluster an object thereby affecting the results of clustering. A successful algorithm must be able to handle outliers/noisy data.
Time Complexity: Most of the clustering methods must be repeated several times to improve the clustering quality. Therefore if the process takes too long, then it can become impractical for applications that handle big data.
Stability: Stability corresponds to the ability of an algorithm to generate the same partition of the data irrespective of the order in which the data are presented to the algorithm. That is, the results of clustering should not depend on the order of data.
High dimensionality: “Curse of dimensionality”, a term coined by Richard E. Bellman is relevant here. As the number of dimensions increases, the data become increasingly sparse, so the distance measurement between pairs of points becomes meaningless and the average density of points anywhere in the data is likely to be low. Therefore, algorithms which partition data based on the concept of proximity may not be fruitful in such situations.
Cluster shape: A good clustering algorithm should be able to handle real data and their wide variety of data types, which will produce clusters of arbitrary shape. Many algorithms are able to identify only convex shaped clusters.
2.3
Clustering Algorithms for Large
Datasets
Clustering is a division of data into groups of similar objects. Each group, called a cluster, consists of objects that are similar to one another and dissimilar to objects of other groups. How this similarity is measured accounts for the difference between various algorithms.
The properties of clustering algorithms to be considered for their comparison from point of view of utility in Big Data analysis include:
• Type of attributes algorithm can handle • Scalability to large datasets
• Ability to work with high dimensional data • Ability to find clusters of irregular shape • Handling outliers
• Time complexity • Data order dependency
• Labeling or assignment (hard or strict vs. soft or fuzzy) • Reliance on a priori knowledge and user defined parameters • Interpretability of results
of the overall density function behave like density attractors forming clusters of arbitrary shapes. OptiGrid algorithm [17] is a dynamic programming approach to obtain an optimal grid partitioning. This is achieved by constructing the best cutting hyperplanes through a set of selected projections. These projections are then used to find the optimal cutting planes; each plane separating a dense space into two half spaces. It reduces one dimension at each recursive step hence is good for handling large number of dimensions.
3.
APPROXIMATE K-MEANS
CLUSTERING ALGORITHMS
The standard k-means algorithm [4, 5, 6], is an iterative refinement approach that minimizes the sum of squared distances between each point and its assigned cluster center. It consists of two iterative steps, the assignment step and the update step. The assignment step aims to find the nearest cluster for each point by checking the distance between the point and each cluster center; the update step re-computes the cluster centers based on current assignments. When clustering n points into k clusters, the assignment step costs O(nk). For applications with large nk, the assignment step in exact k-means becomes prohibitively expensive. Hence, various approaches have been proposed for approximate k-means in large-scale applications. The hierarchical k-means [18] uses a clustering tree instead of flat k-means to reduce the number of clusters in each assignment step. It first clusters the points into a small number (e.g., 10) of clusters, then recursively divides each cluster until a certain depth h is reached. For h = 6, one obtains one million clusters. However, when assigning a point to a cluster (e.g., quantizing a feature descriptor), it is possible that an error committed at a higher level of the tree leads to a sub-optimal cluster assignment.
In [19] approximate nearest neighbor search is used instead of the exact nearest neighbor search in the assignment step for each point. This approach was further improved in [20] in terms of convergence speed.
Zeng [21] proposed an approximation by identifying the data points which frequently change the assigned cluster, that is, the points which lie on cluster boundaries. Thus, the algorithm reduces computational complexity of the assignment step.
4.
PROPOSED ALGORITHM
4.1
Overview
While clustering Big Data, the major feature that can be considered is that if entire data is arranged into a matrix, with rows representing the data points and the columns representing attributes of each data point, then the matrix might not have defined values at many places. Also, the purpose towards a new algorithm is to aid in Business Intelligence. The strategic information, that the Business Analysts seek, always has some defined line of interest. If the data can be arranged such that attributes of interest have some priority over other attributes, it will achieve:
i. All attributes need not be considered for clustering purposes ii. Cluster structure obtained will be more relevant to line of study
Hence, an approximate algorithm which reduces the complexity of classic k-means by computing over only those attributes which are of interest is proposed here.
The problem of indefinite iterations in k-means can be overcome by not arbitrary fixing the number of iterations, as is done in a few approximate algorithms, rather it should be
observed that the number of iterations required for better clustering is in fact a feature of the dataset itself. The number of iterations required in the proposed algorithm depends on the number of attributes to be considered for clustering. Moreover, it overcomes the problem of centroid initialization such that centroids don’t have to be updated every iteration.
4.2
Algorithm
Every data point has maximum M dimensions, that is, a data point can be represented as a tuple of M values
. Select m dimensions out of M dimensions of the data-points. These dimensions are selected based on relevance to the analysis. Arrange them in decreasing order of priority according the required focus of analysis, as .The first dimension d1, is the
primary dimension. Rest of the dimensions is called secondary. The number of clusters, k, is pre-decided. It is input to the algorithm.
Step 1: Variation of each dimension is computed as,
, where maxi is the maximum value of
ith dimension and mini is minimum value of ith dimension.
Step 2: Initial clusters are formed using following conditions For any data point, if
then the data point belongs to cluster j.
Step 3: Centroid of each cluster is computed as mean of all cluster points
Step 4: For every secondary dimension, 2≤j≤m, repeat the following
Step 4.1: Detect outliers of every cluster based on the condition: for every data point if then the data point is outlier based on dimension j. Here, valueij is value of the i
th
data point’s jth dimension, and valuecj
is value of the centroid’s jth
dimension.
Step 4.2: For each outlier data point, compute distance from each centroid up to jth dimension as
. Decide the cluster of the data point according to the minimum distance.
4.3
Benefits
The benefits of the proposed algorithm over classic k-means for Big Data analysis are:
•Number of iterations is predetermined – The number of iterations in k-means is undetermined. For some approximate algorithms it is fixed till a limit of permissible error is achieved. While, it is fixed to the number of attributes (dimensions) in the proposed algorithm.
•Cluster shape is polyhedral – The k-means is able to identify only convex shaped clusters. Proposed algorithm produces polyhedral shaped clusters which can assimilate both convex shaped and irregular clusters.
4.4
Mathematical Analysis
computed. Thus, computation time is O(mnk) in worst case. Theoretically, it seems larger than the runtime of traditional k-means, but is actually much lesser since ‘m’ might represent a very large number in traditional k-means, while it is fixed for the proposed algorithm. Also, the distance calculation involved in k-means needs more number of operations as compared to ours.
5.
IMPLEMENTATION RESULTS
The algorithm was implemented as a MATLAB program on Intel i3 processor running Windows 7.
[image:4.595.325.532.69.189.2]5.1
Results on Scalability
[image:4.595.319.539.220.308.2]Table 1 shows the runtime of proposed algorithm when run on a dataset of 54 attributes (only 20 were selected), and varying number of instances. The value of k is fixed to 4.
Table 1.Run-time for increasing number of instances
Number of Instances Run-time (in milliseconds)
100 14
1000 47
10000 303
100000 3609
1000000 39143
The effect on runtime with increase in number of dimensions can be viewed as shown in Table 2. At fixed value of k=2, and number of data points 100, number of dimensions is increased. Cluster adjustment is done over every secondary dimension, hence increase in number of dimensions directly increases the run-time.
Table 2.Run-time for increasing number of dimensions
Number of Dimensions Run-time (in milliseconds)
10 3
50 7
100 15
500 172
1000 563
5000 26329
10000 110662
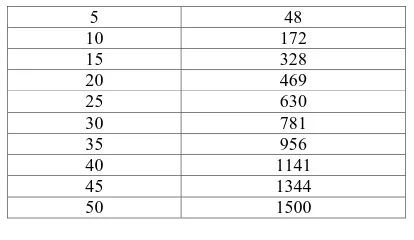
Effect of number of clusters on the runtime should be studied because the number of centroids depends on number of clusters, hence the time required for distance calculation increases when the number of clusters increase. Table 3 shows the variation in run-time with increasing number of clusters over dataset of 1000 instances of 20 dimensions.
5.2
Data Order Dependency
Table 4 shows the precision obtained by changing the priority order of the attributes in Iris dataset. This demonstrates how the order of attributes can affect the clustering. Also, it emphasizes that including all dimensions of a dataset is not mandatory; a good result can be obtained even by picking the most relevant dimensions.
Table 3.Run-time for increasing number of clusters
Number of Clusters Run-time (in milliseconds)
2 10
5 48
10 172
15 328
20 469
25 630
30 781
35 956
40 1141
45 1344
50 1500
Table 4.Precision obtained for Iris dataset with different order of attributes
Primary Attribute Secondary Attribute Precision
1 2,3,4 0.7733
3 1,4,2 0.9467
4 3,1,2 0.96
1 4,2 0.7667
3 4,1 0.9467
4 3,2 0.96
4 1 0.9533
5.3
Comparison Over Cluster Recovery
and Precision
In order to compare with other algorithms, cluster recovery is computed over two different datasets:
1. Iris dataset: This dataset contains 4 attributes for three different varieties of Iris flowers. The dataset contains 150 instances, 50 instances of each variety (Iris Setosa, Iris Versicolor and Iris Virginica). These varieties are known and hence result of clustering can be compared against it. 2. Heart disease dataset: This data generated at the Cleveland Clinic, is a mixed data set with eight categorical and five numeric features. It contains 303 instances belonging to two classes – normal (164) and heart patient (139).
Table 5 shows cluster recovery result for Iris dataset for k-means algorithm, Ahmad and Dey’s [22] algorithm and the proposed algorithm.
Table 5.Cluster Recovery Results for Iris Dataset
Cluster No
Iris Setosa
Iris Versicolor
Iris Virginica
k-means 1 50 0 0
2 0 42 10
3 0 8 40
Ahmad and Dey’s Algorithm
1 50 0 0
2 0 47 5
3 0 3 45
Proposed Algorithm
1 50 0 0
2 0 48 4
3 0 2 46
[image:4.595.64.271.257.323.2] [image:4.595.58.275.422.510.2]Another point of view to look at the clustering results is the precision. It is the ratio of correctly clustered data points to total number of data points. The precision computed using the cluster recovery for various algorithms over Iris dataset is tabulated in Table 6.
Table 6.Comparison of the precision obtained for Iris dataset
Algorithm No of data objects in correct
cluster (out of 150) Precision
k-means 132 0.88
Ahmad and
Dey’s 142 0.946
Proposed
Algorithm 146 0.96
[image:5.595.310.549.70.353.2]Cluster recovery for Heart disease dataset is shown for SBAC[23], ECOWEB[24], Huang’s[25], Ahmad and Dey’s[22] and proposed algorithm in Table 7. The recovery of first cluster is highest (85%) with Ahmad and Dey’s algorithm and second highest (80%) with the proposed algorithm. the recovery for second cluster is 85% with ECOWEB algorithm, while it is 100% with proposed algorithm. Hence, the proposed algorithm is better than others in context of the Heart disease dataset since it indicates none of the patients as normal.
Table 7. Cluster recovery results for Heart disease dataset
Cluster No
Normal Heart
Patient
SBAC 1 126 37
2 38 102
ECOWEB 1 105 20
2 59 119
Huang’s Algorithm
1 116 55
2 48 84
Ahmad & Dey’s Algorithm
1 139 21
2 25 118
Proposed Algorithm
1 132 0
2 32 139
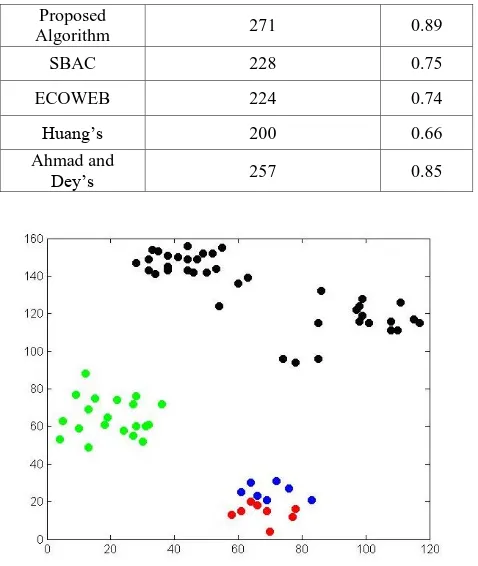
Table 8 lists the precision obtained over the Cleveland heart disease dataset. As can be seen in both the cases the precision achieved by the proposed algorithm is highest among other clustering algorithms being compared.
5.4
Visualizing Comparison
An artificial dataset, created by Ruspini[26], is used to compare various clustering algorithms. A comparison of the proposed algorithm with k-means algorithm, at k=4 was drawn over this dataset. As can be observed in Fig 1, k-means does not produce proper cluster for cluster number 3 and 4. Fig 2 shows the clusters produced by the proposed algorithm. It produces proper clustering, with only two data points wrongly assigned.
Table 8.Comparison of precision obtained for Heart disease dataset
Algorithm No of correctly clustered
data objects Precision
Proposed
Algorithm 271 0.89
SBAC 228 0.75
ECOWEB 224 0.74
Huang’s 200 0.66
Ahmad and
Dey’s 257 0.85
Fig 1: Clusters for Ruspini dataset using k-means at k=4
Fig 2: Clusters for Ruspini dataset using proposed algorithm at k=4
6.
CONCLUSION
[image:5.595.320.508.381.534.2]is also higher than most of them since the proposed algorithm does not reject any data.
The concept of hierarchical clustering can be used along with the proposed algorithm to handle very large number of dimensions. Proposed work can be modified for rejecting flash data. The algorithm presented here cannot handle categorical data well until it is converted into equivalent numerical data. Exploring clustering big data in terms of categorical data could be another possible extension. Deciding primary and secondary attributes is considered in the proposal to be provided as an input by the user (which indicates the view point of study). Machine learning concepts can be used to decide the priority of attributes instead of asking from the user.
7.
REFERENCES
[1] http://www-01.ibm.com/software/data/bigdata/
[2] Gartner's Big Data Definition Consists of Three Parts, Not to Be Confused with Three "V"s, By Svetlana Sicular, Gartner, Inc. 27 March 2013. [online] http://www.forbes.com/sites/gartnergroup/2013/03/27/ga rtners-big-datadefinition-consists-of-three- parts-not-to-be-confused-with-three-vs/.
[3] Italiano G.F. Algorithms for Big Data: Graphs and Memory errors. July 2013. Available online at almada2013.ru/files/courses/italiano/00-Intro.pdf [4] Forgy, E. W. Cluster analysis of multivariate data:
Efficiency versus interpretability of classifications. Biometrics, 21:768–780, 1965.
[5] MacQueen, J.B. Some methods for classification and analysis of multivariate observations. In Proc. of 5th Berkeley Symposium on Mathematical Statistics and Probability, volume 1, pages 281–297, 1967.
[6] Lloyd, S. P. Least squares quantization in PCM. IEEE Transactions on Information Theory, 28(2):129–137, March 1982.
[7] Extracting Value from Chaos, By Gantz, J. and Reinsel, D. IDC IVIEW June 2011. [online] http://www.emc.com/collateral/analyst-reports/idc-extracting-value-from-chaos-ar.pdf.
[8] The Big Data Long Tail. Blog post by Bloomberg, Jason.
On January 17, 2013. [online]
http://www.devx.com/blog/the-big-data-long-tail.html. [9] The Fourth Paradigm: Data-Intensive Scientific
Discovery. Edited by Hey, T. , Tansley, S. and Tolle, K.. Microsoft Corporation, October 2009. ISBN 978-0-9825442-0-4.
[10]Demchenko, Y., Membrey, P., Grosso, C. de Laat, Addressing Big Data Issues in Scientific Data Infrastructure. First International Symposium on Big Data and Data Analytics in Collaboration (BDDAC 2013). Part of The 2013 Int. Conf. on Collaboration Technologies and Systems (CTS 2013), May 20-24, 2013, San Diego, California, USA.
[11]Kaufman, L., and Rousseeuw, P. J. Finding Groups in Data: An Introduction to Cluster Analysis, John Wiley & Sons, Inc., New York, NY, 1990.
[12]Fahad, A, Alshatri, N., Tari, Z., AlAmri, A., Zomaya, Y., Khalil, I., Foufou, S., Bouras, A, "A Survey of Clustering Algorithms for Big Data: Taxonomy & Empirical Analysis," Emerging Topics in Computing, IEEE Transactions on ,vol.PP, no.99, pp.1,1. 2014
[13] Ng, R. T., and. Han, J. Clarans: A method for clustering objects for spatial data mining. IEEE Transactions on Knowledge and Data Engineering (TKDE), 14(5):1003– 1016, 2002.
[14] Bezdek, J. C., Ehrlich, R., and Full, W. Fcm: The fuzzy c-means clustering algorithm. Computers & Geosciences, 10(2):191–203, 1984.
[15] Zhang, T., Ramakrishnan, R., and Livny, M. Birch: an efficient data clustering method for very large databases. ACM SIGMOD Record, volume 25, pp. 103–114, 1996. [16] Hinneburg, A., and Keim, D. A. An efficient approach
to clustering in large multimedia databases with noise. Proc. of the ACM SIGKDD Conference on Knowledge Discovery ad Data Mining (KDD), pp. 58-65, 1998. [17] Hinneburg, A., and Keim, D. A. Optimal
Grid-clustering:Towards breaking the curse of dimensionality in high-dimensional clustering. In Proceedings of the 25th
Conference on VLDB, 506-517, 1999.
[18] Nister, D., and Stewenius, H. Scalable recognition with a vocabulary tree. In CVPR, 2006.
[19] Philbin, J., Chum, O., Isard, M., Sivic, J., and Zisserman, A. Object retrieval with large vocabularies and fast spatial matching. In Proceedings of the Conference on Computer Vision and Pattern Recognition (CVPR), 2007.
[20] Philbin, J. Scalable Object Retrieval in Very Large Image Collections. PhD thesis, University of Oxford, 2010.
[21] Zeng, G. Fast Approximate k-Means via Cluster Closures. In Proceedings of the 2012 IEEE Conference on Computer Vision and Pattern Recognition (CVPR), IEEE Computer Society, Washington, DC, USA, pp 3037-3044.
[22] Ahmad, A., and Dey, L. A k-mean clustering algorithm for mixed numeric and categorical data, Data & Knowledge Engineering, Vol 63, Issue 2, November 2007, Pages 503-527, ISSN 0169-023X, http://dx.doi.org/10.1016/j.datak.2007.03.016.
[23] Li, C., Biswas, G. Unsupervised learning with mixed numeric and nominal data, IEEE Transactions on Knowledge and Data Engineering 14 (4) (2002) 673– 690.
[24] Reich, Y., Fenves, S. J. The formation and use of abstract concepts in design, in: Fisher, D. H., Pazzani, M. J., Langley (Eds.), P. Concept Formation: Knowledge and Experience in Unsupervised Learning, Morgan Kaufman, Los Altos, Calif, 1991, pp. 323–352
[25] Huang, Z. Clustering large data sets with mixed numeric and categorical values, in: Proceedings of the First Pacific-Asia Conference on Knowledge Discovery and Data Mining, World Scientific, Singapore, 1997. [26] Ruspini, E. H. Numerical methods for fuzzy clustering.
Inform. Sci. 2, 319–350, 1970.Chen, S., Mulgrew, B., and Grant, P. M. “A clustering technique for digital communications channel equalization using radial basis function networks,” IEEE Trans. on Neural Networks, vol. 4, pp. 570-578, July 1993