http://dx.doi.org/10.4236/jgis.2014.62013
GIS and Networks: Business Anomalies and
Topological Errors, Linear Elements Case
Omar Bachir Alami1, Hatim Lechgar2, Mohamed El Imame Malaainine2, Fatima Bardellile1 1Ecole Hassania des Travaux Publics, Casablanca, Maroc2Faculté des Sciences Ain Chock, Université Hassan II, Casablanca, Maroc
Email: [email protected], [email protected], [email protected], [email protected]
Received 21 January 2014; revised 20 February 2014; accepted 5 March 2014
Copyright © 2014 by authors and Scientific Research Publishing Inc.
This work is licensed under the Creative Commons Attribution International License (CC BY). http://creativecommons.org/licenses/by/4.0/
Abstract
The quality control of geographic data, especially from a topological and semantic perspective, is a must for its good management and use. However, while updating spatial data, some sorts of ano-malies are affecting it, due to negligence or non-respect of business and topological rules. Hence the necessity of a solution that enables detecting theses anomalies. Nowadays, Geographic Infor-mation Systems (GIS) have become essential for decision-making in any project that manages spa-tial data. GIS functionalities and tools give the possibility of defining the topology of vector data. Nevertheless, the topology alone does not respond to the needs in matter of defining specific rules for every facility network. This means, we could find topological errors in the spatial database, but taking into account business rules, they are correct and vice versa. The main objective of this ar-ticle is firstly to define business rules for the linear elements of a network. Secondly to premedi-tate the algorithms that detect the violation of the defined rules in order to have a good quality control of geographic data.
Keywords
GIS; Networks, Geodatabase, Topology, Business Rule
1. Introduction
servic-es (updating, extraction of certain themservic-es, and conversion to certain data format) [2].
Thus, this definition of quality has been adapted to the specific domain of geographic information, while splitting the quality in two parts:
• The intern quality which consists of measuring the adequacy of database to its specifications. • The extern quality which consists of measuring the adequacy to the users’ needs.
The creation or update of Geodatabase (GDB) might be source of several anomalies which are due to human omission or to non respect of topological or business rules, hence the interest of having a tool that would control the quality of GDB. In fact, every advanced GIS functionality requires a high standard GDB. For example, to determine the impact zones during electricity power failure, and intervene as quickly as possible, the electric network has to be completely connected and respects the topological and business rules. Nevertheless, we might have data with topological errors in GDB but taking into account business criteria those data are correct, or vice versa.
The verification of geographic data following the standard procedures offered by GIS software, which by the way does not take into consideration business rules, turns out to be limited, repetitive and tedious. Whence the need of proposing algorithms is to detect errors and anomalies, in particular topological and business ones which are the most recurrent in GDBs for linear elements in a utility network.
2. Methodology
The present work is based on a dataset of elements from utilities network, namely: canalizations of potable wa-ter and waste wawa-ter networks, high voltage (HV) and low voltage (LV) networks sections.
Our methodological approach consisted firstly of the study of the relationships between linear GDB entities to determine the most common business rules in utilities network, and secondly of the development of algorithms to detect anomalies which violate these rules.
In order to detect the violation of a predefined rule, all concerned entities have to be scanned. Nevertheless, we are dealing with huge quantities of geographic data and the spatial queries tends to be rather complex. So, a linear scan of the GDB records to spot nonconformities to a rule takes a lot of time. That is why we adopted the following general method in order to accelerate anomalies detection, and thus optimize search time.
The first step, which is filtering, aims to cast aside all entities whose attributes does not fit the controlled business rule criteria, then throw out all remaining entities that are not close to the controlled entity. The next step is refinement, in which the exact search for violations takes place so that entities subjects of anomalies are detected (Figure 1).
Start
1) Filtering step
2) Refinement step
Validated Validated Validated no no no
Test on exact geometry Candidate entities
Candidate entities
Results Test on attributes
Test on envelope
3. Results
3.1. Rules for Linear Elements
A detailed study of the relationships between these entities in the GDB has allowed us to define these generaliz-ing rules:
3.1.1. Rule 1: Must Be Connected
This rule ensures that two polylines whose ends are close by a distance “d” must be connected. “d” is a margin specified by the quality controller while defining this rule (Figure 2).
3.1.2. Rule 2: Must Be Connected to
In this rule, two polylines of two different feature classes whose ends are close by a distance “d” must be con-nected. “d” is a margin specified by the quality controller while defining this rule. For instance; a low voltage power cable must be connected to a cable of the same type or of medium voltage power and a combined sewer pipe must be connected to a storm water sewerage pipe.
3.1.3. Rule 3: Must Have the two Extremities on
In this rule, the two ends of a polyline must be on other polylines. For example; two ends of an electric cable must be above a connecting node and both ends of potable water canalization, which must be above a node.
3.1.4. Rule 4: Should Not Have an End near the Inside of
This rule requires that the end of a polyline must not be close by a distance “d” to the inside of another polyline as with the case of a drinking water or wastewater pipe which should never touch the inside of another pipe (Figure 3).
3.1.5. Rule 5: Should Not Be Connected to
This rule ensures that the end of a polyline must not coincide with the end of another polyline. This is the case of a rainwater pipe which should not be connected to waste water pipe.
3.1.6. Rule 6: Must Not Overlap
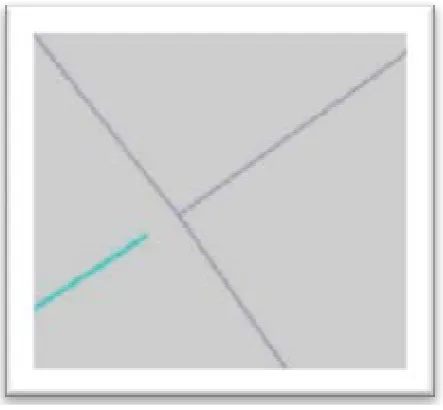
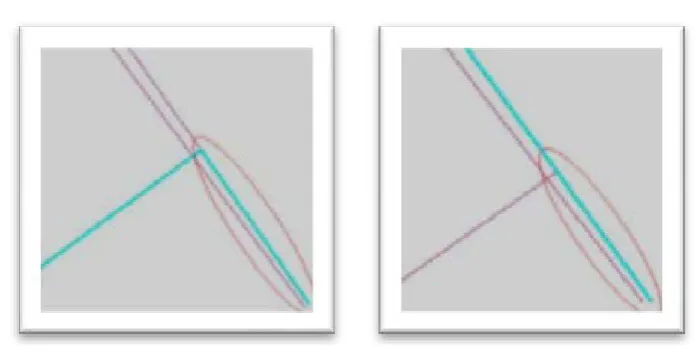
In this rule, the segments of a line should not occupy the same location with different line segments. This is the case of duplicate drinking water pipes, sewerage or electrical cables. One element must be deleted. The following
[image:3.595.204.426.480.685.2]Figure 4 shows the overlapping anomaly of two pipes of potable water (successively selected in cyan blue): the two circles locate the overlapping.
3.1.7. Rule 7: Must Not Self Overlap
In this rule, the segments of a polyline must not occupy the same location with segments of the same polyline. A drinking water pipe should never self overlap.
3.1.8. Rule 8: Should Not Cross
This rule requires that a polyline should not cross another polyline. This is to check for the three businesses (water, sanitation and electricity), save the case when it is just a warning and not a systematic error, since some pipes with different elevations may appear intersecting. Z is to take into account in the detection algorithm of this rule.
3.1.9. Rule 9: Should Not Self Cross
In this rule, a segment of a polyline must not cross another segment of the same polyline. This is applicable on a drinking water and sanitation pipes (Figure 5).
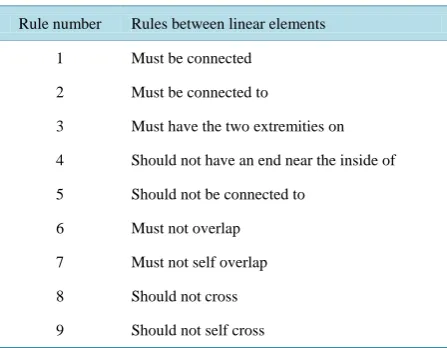
The following Table 1 summarizes all the business rules studied.
3.2. Algorithms for Detecting Anomalies on Linear Elements
In this section we detail the algorithms developed to find violations of defined topological constraints. We opted to use the intersection of geographical entities envelopes instead of their exact geometry because it is a function managed intrinsically and effectively by GDBs.
Figure 3. Anomaly example: the end of an electric line is close to the inside of another power line.
[image:4.595.204.423.367.502.2] [image:4.595.137.485.530.708.2]
Figure 5. Anomaly example: a drinking water pipe that self crosses.
Table 1.List of rules between the linear elements.
Rule number Rules between linear elements
1 Must be connected
2 Must be connected to
3 Must have the two extremities on
4 Should not have an end near the inside of
5 Should not be connected to
6 Must not overlap
7 Must not self overlap
8 Should not cross
9 Should not self cross
3.2.1. Detection Algorithm of Rules 1 and 2 For the rule “Must be connected”:
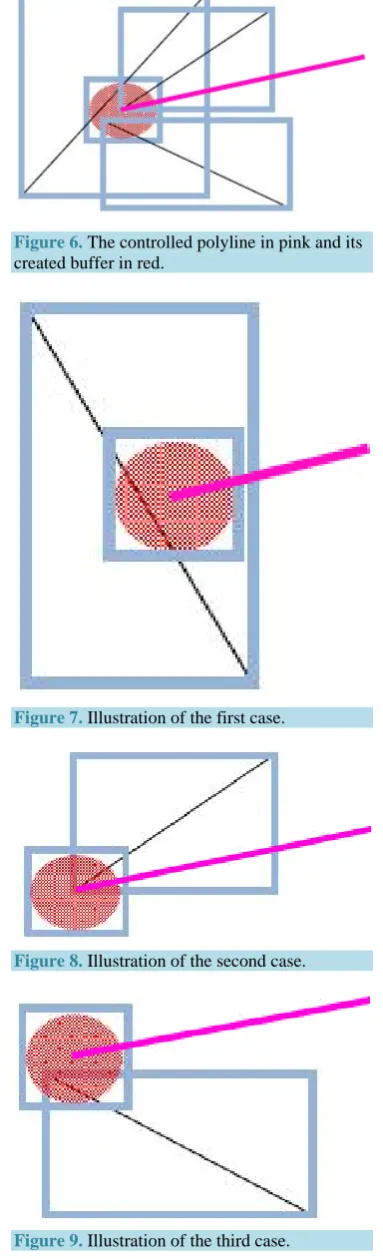
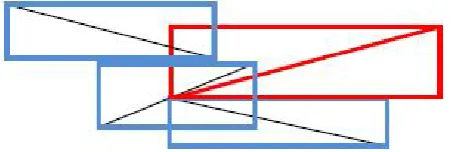
For every polyline whose entity class is defined in the rule, we create a buffer disk of radius “d” around its first end. We restrict the search to polylines whose envelope intersects the envelope of buffer as illustrated in the following Figure 6.
Three cases are then distinguished:
1) The envelope of a polyline intersects the buffer’s envelope without having any of its two ends belonging to the buffer (Figure 7).
→ Rejected case.
2) The polyline envelope intersects the buffer’s envelope, and one of its ends is contained in the buffer be-longs while coinciding with the end of the controlled polyline (Figure 8).
→ Rejected case (no anomaly)
3) The polyline envelope intersects the buffer’s envelope, and one of its ends is within the buffer without coinciding with the end of the first controlled polyline (Figure 9).
→ Case detected as anomaly.
The same procedure is followed for the second end of the polyline (endpoint). Identifying the types of ends (end or start) involved in the detected anomaly is essential for the visualization and correction of the anomaly.
For rule 2, the detection algorithm is the same as that of Rule 1, except that in this case polylines do not be-long to the same class of entities.
3.2.2. Detection Algorithm of Rule 3
[image:5.595.199.423.246.420.2]Figure 6. The controlled polyline in pink and its created buffer in red.
Figure 7.Illustration of the first case.
Figure 8. Illustration of the second case.
[image:6.595.217.409.93.724.2]knowingly: searching for polylines whose start and end points intersect no polyline).
For this we look at first for the group of all polylines whose start point is at the top of another polyline then we search the group of all polylines with the End point above another polyline. So the Polylines source of ano-maly are those who belong neither to the first group nor to the second group.
• Method to find the first group
To find the first group we seek polylines whose end startpoint is above another polyline. To do this, we cal-culate for each polyline the distance “d” between the startpoint and other polylines, from the second class of ent-ities, whose envelope intersects the envelope of the polyline in question (Figure 10).
So the first group is the set of polylines with distance d = 0.
• Method to find the second group
Then we look for polylines whose endpoint is above another polyline in the same manner as for the startpoint. Therefor group 2 is the set of polylines with a distance “d” of zero. Polylines considered anomalies are then those not belonging to either group1 or to group 2.
3.2.3. Detection Algorithm of Rule 4
We create a buffer disk of radius “d” around an end of the polyline subject to rule control. Thereafter, the search will be restricted to polylines intersecting with the buffer (Figure 11).
The following cases are to get rid of:
• The end of the polyline in question touches another polyline result of the first filter, at its inside or at its end.
• The extremity of the other polyline is in the buffer, since this case is treated in interconnection anomaly de-tecting.
3.2.4. Detection Algorithm of Rule 5
We create a buffer disk of radius “d” around the end (start point) of the polyline to be examined. Next, we check whether the start point coincides with an end of another polyline (We are interested in polylines intersecting with the already established buffer). Polylines considered as anomaly are those with the “start point” or “end point” which coincides with the end of another polyline.
3.2.5. Detection Algorithm Rules 6 and 7
[image:7.595.203.429.482.558.2]For the rule “should not overlap”, we seek for each polyline the polylines overlapping it among those whose envelope is interesting its envelope. For the rule “should not self overlap,” the same algorithm as the rule “should not overlap” is applied, except that in this case we are interested in the relationship of the same polyline.
[image:7.595.200.430.588.697.2]Figure 10.The polyline in question and its envelope are in red.
3.2.6. Detection Algorithm Rules 8 and 9
For the rule “should not cross” for each polyline we look for crossing polylines from those having the envelope intersecting with its envelope. For the rule “should not self cross” we apply the same algorithm of the previous rule except that this is about the same polyline.
4. Conclusions
In conclusion, we have proposed the most widely used business rules in the field of network utilities and algo-rithms for detecting violations of these rules on linear elements of these networks (drinking water, sanitation and electricity).
This work is intended for the use of quality controllers and business agents in order to define business rules on their networks. It is also intended to detect report and correct anomalies in order to have more clean and reliable geographic data which is an essential precondition to any spatial analysis or GIS application.
It should be noted that available GIS solutions do not allow meeting all and each business’s set of rules, which is why it is necessary for companies that manage network utilities to develop according their specific needs, solutions for the detection and automatic or semi-automatic correction of their business anomalies and that, based on our algorithms and others.
References
[1] ISO (1994) International Organization for Standardization, Norme Internationale—Management de la qualité et assurance qualité—Vocabulaire. ISO 8402:1994 (E/F/R), 2ème édition.
[2] Bonin, O. (2002) Modèle d’erreurs dans une base de données géographiques et grandes déviations pour des sommes pondérées; application à l’estimation d’erreurs sur un temps de parcours. Thèse de doctorat, Université de Paris VI, 147.