Translation and Retrieval of Image Information
to and from Sound
Kunal Hossain
School of Education Technology, Jadavpur University, Kolkata - 700032, India
Jyotismita Chaki
School of Education Technology, Jadavpur University, Kolkata - 700032, India
Ranjan Parekh
, PhD School of Education Technology,Jadavpur University, Kolkata - 700032, India
ABSTRACT
With the rapid growth of both Internet and Multimedia the subject of hidden exchange of information has gained a great importance. The current work is based on translation of information of a digitized image into a sound file. Later the image file can be retrieved by authorized personnel by performing the reverse process on the sound file. The three dimensional RGB image matrix is converted into a two dimensional sound file. During the retrieving time, the reverse procedure is performed on the sound file in order to get back the original image file.
General Terms
Steganography, Image Encryption, Data Security, Information Hiding, Noise, Correlation, Degradation.
Keywords
Steganography, Encoding, Decoding, Data Security, Information Hiding, Image to Sound Mapping, Additive White Gaussian Noise, RGB Values, Correlation, Degradation.
1.
INTRODUCTION
The word Steganography is derived from the Greek for concealed writing or information. It means ‘to hide in plain sight’. Cachin [1] defined Steganography as the art and science of communication where the actual message is not detected.
Since few years, the publishing and broadcasting industries have been showing interest in the processes of encryption for embedding their copyright marks secretly in books, images, digital films, audio recordings and other multimedia products as in today’s world copying digital files have become too easy.
Although both Data Encryption and Steganography have a similar role, i.e. to hide information yet there is a significant distinction between the two methods. In Data Encryption it is clear for anybody that two parties are secretly communicating whereas in Steganography the existence of the secret message always remains confidential i.e. unrecognizable.
The art of Steganography on Image had also been used in history. For example, according to Herodotus [2] sometime around 400B.C. the head of a slave was shaved and tattooed holding secret information that disappeared when the hair had re-grown. Thus the slave was used to relay information.
In the modern time of digitization, Image Steganography had been used where a secret image had been hidden inside another image using an encoder and later retrieved using a decoder.
Organization of the work in this paper is as follows: section 2 describes the previous works related to Steganography, section 3 describes the approach proposed in this paper, section 4 describes the experimentations done and the results obtained from those experimentations, section 5 describes analysis of the entire work and comparing this approach with the previously used approaches by other researchers, section 6 provides the conclusion part along with the future scopes and in section 7 all the references are provided.
2.
RELATED WORK
The Least Significant Bit (LSB) algorithm has been used by
Anderson and Petitcolas in their Steganographic approach [3].
The model devised by Niels [4] used two methods. One is the probabilistic embedding to minimize modifications of the cover medium. Another method included the error correcting code that allowed the embedding process to select the bit to be modified in a manner that would decrease the probability of the secret message from being detected by unauthorized users.
In [5] an image based steganography is presented where the researchers have used Least Significant Bit (LSB) for generating the stego-image, Discrete Cosine Transform (DCT) for transforming stego-image from spatial domain into the frequency domain. Quantization and runlength coding algorithms are used in order to compressing the stego-images in order to improve the security. The reverse process is done to retrieve the hidden image from the stego image.
In [6] the authors have used the method of substitution of Least Significant Bit to encode information in an image.
In [7] the author has presented a new method for steganography in MMS messages. For concealing information in text a method used in steganography in SMS was used. Here, a combination of abbreviated words was used. For concealing the data in image, the LSB of the color pixels was used. Each byte of information was hidden in two pixels.
In [8] the authors have used the generalized collage steganography where the secret message was kept hidden by integrating object images with transparent features into a cover image.
3.
PROPOSED APPROACH
In the current work the main objective is to convert an image file into a corresponding sound file. First the sender selects a secret image.
3.1
Encoding
The secret image I is in the form of RGB. The width, height and depth of the image are stored in separate variables m, n and r. Image data is reshaped into a one dimensional matrix (ID).
ID = {I1, I2….I (m,n,r)} (1)
The value of m, n and r are normalized by a predetermined constant c. A one dimensional matrix is created (SD) as follows:
(2)
A combined matrix (CD) is created with horizontal combination of the size of data between SD and ID.
CD = [SD ID] (3) The value of m and n are altered as the size of CD. A new 2 column matrix (AD) is created by reshaping CD.
AD = {CD(1to q/2); CD((q/2)+1 to q)} (4)
Where q is the total number of elements in CD.
This AD is stored as stereo sound file with an extension .wav.
3.2
Decoding
On the recipient’s side the sound file is fed to the system. The recipient uses the reverse procedure of encoding for retrieving the image. The decoding process is as follows:
For this purpose the recipient enters a password after which the decoding program will execute and convert the sound file back to the image file. The width and height of AD is stored in a separate matrix. AD is a 2 dimensional matrix. This matrix is reshaped to form a one dimensional matrix CD.
(5) The position of ‘1’ in CD is detected. Then the size of the image which is converted into sound file is detected. The ID is detected from CD by the positioning of ‘1’which was used to create SD while encoding. ID is selected by selecting the values after the ‘1’ value. ID is reshaped by the size of the original image as detected previously. ID is multiplied with the constant value as set during the encoding procedure. ID is stored as a .jpg file. The Degradation of the retrieved image is calculated by finding out the Correlation Factor between the retrieved image and the original image.
Degradation (%) = [{(1 – Correlation) / 1} x 100] (6)
4.
EXPERIMENTATIONS AND
RESULTS
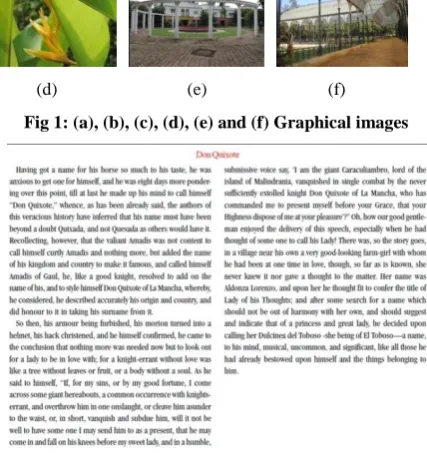
Experimentations were done with a set of fifty images. First twenty five samples were graphical images (Table 1) and the remaining twenty five were scanned textual content in image format (Table 2). Some samples of each category are shown in Figure 1 and Figure 2. The graphical images were picked from photographs previously shot by me. The copyright of those graphical images are restricted.
(a) (b) (c)
(d) (e) (f)
[image:2.595.316.528.71.209.2]Fig 1: (a), (b), (c), (d), (e) and (f) Graphical images
Fig 2: Scanned Textual content (image format)
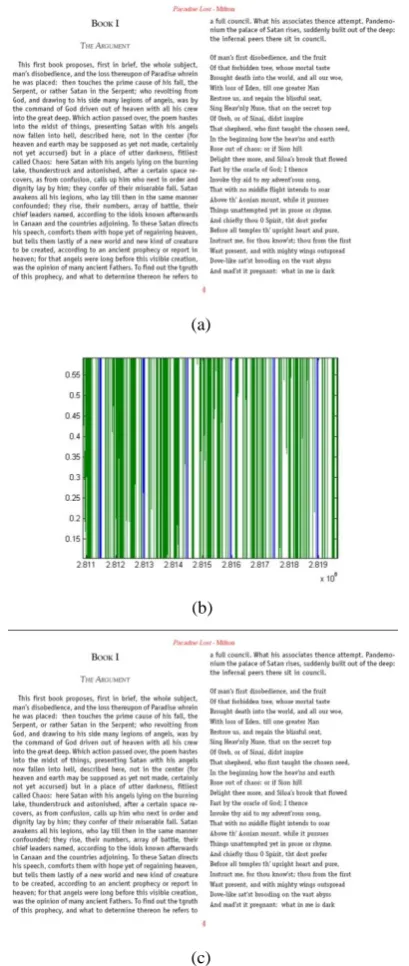
In this experiment, constant c is set to 10. A sound file is obtained from the image file as described in the proposed approach section. On the recipient’s side, the image is retrieved from the sound file. The original graphical image, the sound file and the retrieved graphical image are shown in Figure 3.
(a) (b)
(c)
[image:2.595.320.534.160.387.2] [image:2.595.321.537.488.685.2]Figure 4 below depicts the conversion of a textual content to a sound file and the retrieval of textual content from the sound file.
(a)
(b)
(c)
Fig 4: (a) Original textual content, (b) Converted sound file (zoomed view) and (c) Retrieved textual content
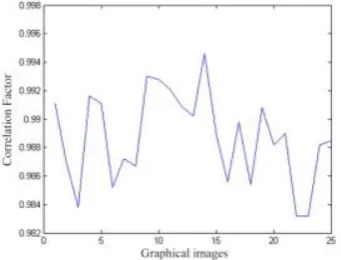
Table 1 below depicts some of the ‘graphical images’ that were tested. The correlation factor between the original images and the retrieved images and their degradation (%) were calculated from Equation 6. The degradation of the images were found to be very less in most cases. The plot depicting Correlation Factor of the graphical images is shown in Figure 5 (a) while Figure 5 (b) shows the plot of Degradation of the retrieved graphical images in Percentages.
Table 1: Graphical images with Correlation Factor and Degradation (%)
Image Index Number
Correlation Factor
Degradation (%)
01 0.9952 0.48
02 0.9911 0.89
03 0.9980 0.2
04 0.9952 0.48
05 0.9952 0.48
06 0.9891 1.09
07 0.9914 0.86
08 0.9934 0.66
09 0.9972 0.28
10 0.9976 0.24
11 0.9958 0.42
12 0.9956 0.44
13 0.9947 0.53
14 0.9984 0.16
15 0.9941 0.59
16 0.9910 0.90
17 0.9944 0.56
18 0.9907 0.93
19 0.9948 0.52
20 0.9908 0.92
21 0.9931 0.69
22 0.9870 1.30
23 0.9875 1.25
24 0.9910 0.9
25 0.9921 0.79
(a)
(b)
[image:3.595.331.526.98.427.2] [image:3.595.66.271.111.595.2] [image:3.595.344.514.422.722.2]Table 2 below depicts the degradation of the retrieved images when compared to the original ‘scanned textual content (images)’ are plotted in Figure 6. The textual content gave even better results than graphical images.
Table 2: Scanned textual content with Correlation Factor and Degradation
Image Index Number
Correlation Factor
Degradation (%)
26 0.9990 0.10
27 0.9985 0.15
28 0.9992 0.08
29 0.9992 0.08
30 0.9979 0.21
31 0.9980 0.20
32 0.9981 0.19
33 0.9980 0.20
34 0.9980 0.20
35 0.9979 0.21
36 0.9980 0.20
37 0.9980 0.20
38 0.9979 0.21
39 0.9985 0.15
40 0.9974 0.26
41 0.9975 0.25
42 0.9974 0.26
43 0.9975 0.25
44 0.9974 0.26
45 0.9975 0.25
46 0.9973 0.27
47 0.9974 0.26
48 0.9996 0.04
49 0.9996 0.04
50 0.9994 0.06
(a)
(b)
Fig 6: (a) Plot showing Correlation Factor and (b) Degradation (%) of textual content
Considering the fact that the converted sound would be transmitted through networks rigorous testing was performed. While travelling over the network in bits noise is a highly possible factor, resulting the sound files to get modified. For this purpose the sound files were subjected to forceful distortion.
The converted sound files were tested with Additive White Gaussian Noise. Here the Signal to Noise Ratio (SNR) value was varied to see how the retrieved image degrades from the original image. Image index number 08 is depicted here as an example in Figure 7 (a) below. The Correlation Factor and Degradation (%) is calculated as shown in Table 3 with some variable values of SNR.
Table 3: Effect of SNR value on Correlation Factor and Degradation (%)
Signal to Noise Ratio
Correlation Factor
Degradation (%)
16 0.9867 1.33
8 0.9364 6.36
4 0.8637 13.63
0.8 0.7665 23.35
0.4 0.7499 25.01
0.2 0.7436 25.64
0.02 0.7355 26.45
From the above table it must be noted that the sound file must always move through networks where the SNR value is moderately high as a result in Figure 7 (b). Otherwise undesired images would be retrieved as shown in Figure 7 (c).
(a) (b)
(c) Fig 7: (a) Original image, (b) Retrieved image with noise (SNR = 16) and (c) Retrieved image with noise (SNR = 0.02)
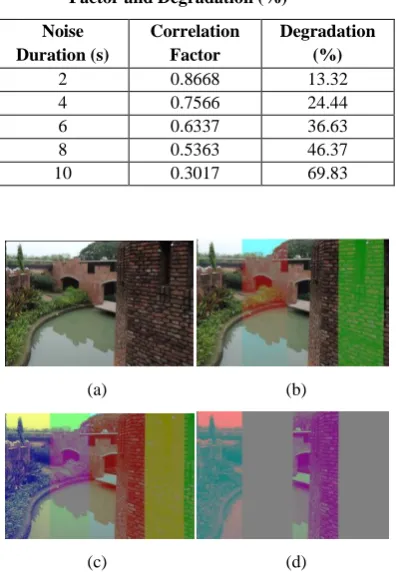
[image:4.595.345.516.621.751.2]The sound file (stego file) was also tested in commercial sound editor with noise. The example shown in Table 4 has a length of 12s (seconds). The sound samples along time length of 2s, 4s, 6s, 8s and 10s were modified. Figure 9 shows image index number 08 with noise introduced. Figure 10 is an example depicting comparison of a sound file in sound editor before and after noise is introduced along a part of the timeline.
Table 4: Effects of noise duration on Correlation Factor and Degradation (%)
Noise Duration (s)
Correlation Factor
Degradation (%)
2 0.8668 13.32
4 0.7566 24.44
6 0.6337 36.63
8 0.5363 46.37
10 0.3017 69.83
(a) (b)
(c) (d)
Fig 9: (a) No Noise, (b) Noise of 2s, (c) Noise of 6s and (d) Noise of 10s.
(a) (b) Fig 10: (a) No Noise and (b) Noise of 6s
5.
ANALYSIS
The low quality of image retrieval is the main drawback with the proposed Least Significant Bit (LSB) algorithm by Anderson and Petitcolas [3]. But in this paper the end quality of the retrieved image is always equivalent to that of the original image.
The model devised by Niels [4] was to keep the balance of the statistical properties of the cover image after embedding the pay load. The proposed approach here does not have the concept of cover image, so there is zero possibility for the existence of any payload.
In [5] the authors have used the Least Significant Bit- embedding algorithm to conceal an image in the cover image. The combination of the cover image and the hidden image forms the stego image. A discrete cosine transform is used to
transform the stego image from spatial domain to frequency domain. To compress the stego image for security purpose quantization and runlength coding is applied. On the receiver’s end they have carried out just the reverse procedure. For retrieving the hidden image from the encoded stego image using the inverse transform procedures like decompression, encoding of runlength algorithm, de-quantization and inverse DCT. The algorithm was run on the same dataset as used in the experimentations of this paper. Both categories of hidden images were tested on. In Table 5 below, an example is cited where the correlation of the cover image and stego image were calculated. In the same manner, the correlations for hidden and extracted image were also calculated. Thus the degradation percentages of the extracted image were derived.
Table 5: Comparing the quality of Cover Image with Stego Image and Hidden Image vs. Extracted Image by varying the LSB
Comparison LSB Results
Cover Image vs. Stego Image
2 Correlation = 0.9998 4 Correlation = 0.9961 6 Correlation = 0.9356 7 Correlation = 0.8025 Hidden Image vs.
Extracted Image
2 Correlation = 0.2707 Degradation = 72.93% 4 Correlation = 0.3505
Degradation = 64.95% 6 Correlation = 0.4945
Degradation = 50.55% 7 Correlation = 0.6353
Degradation = 36.47% From Table 5 we can say that decrease in LSB can generate a better stego image but failing in extracting the hidden image. Figure 11 depicts the images when LSB is 2 bit.
(a) (b)
(c) (d)
Fig 11: (a) Cover image, (b) Hidden image, (c) Stego image and (d) Extracted image
[image:5.595.69.268.178.470.2] [image:5.595.330.523.481.640.2]In [6] the method of substitution had been used for concealing information. The algorithm was run on the same datasets like [5]. Here the basic problem is same as that of [5] that is on decreasing the LSB value the stego image has a high correlation value. But the quality of the extracted image is poor when compared to the hidden image. Again if we increase the LSB value the extracted image quality is high but the stego image that is first generated is not good enough to hide the information it has been designed to. The hidden message is clearly visible. Although it is true that with such LSB the extracted image on the receiver’s end is nearly that of the original hidden image, but it contradicts the main objective that is to conceal information from unauthorized personnel. Table 6 below depicts the results achieved on performing the experiment.
Table 6: Comparing the Correlation Factor and Degradation (%)
Comparison LSB Results
Cover Image vs Stego Image
1 Correlation = 0.9999 2 Correlation = 0.997 4 Correlation = 0.9954 7 Correlation = 0.7702 Hidden Image vs
Extracted Image
1 Correlation = 0.8447 Degradation = 15.53% 2 Correlation = 0.9625
Degradation = 3.75% 4 Correlation = 0.9884
Degradation = 1.16% 7 Correlation = 0.9911
Degradation = 0.89%
In [6] there is another major problem like [5], that is, the algorithm cannot be applied on RGB images. So, first of all the color images need to be converted to grayscale images before. This paper has no such difficulties. The correlation value for almost all the images is high and degradation value most of the time remained least.
In [7] the author has used both text and image steganography. This included things like size and protection. Much more padding around the secret text is required so that the secret text isn’t revealed. Something simple like sending an email address or a phone number is fine. But a long text matter would be difficult. Whereas, using the proposed algorithm in this paper, the converted sound can be very easily transmitted to other ends via MMS, Bluetooth, WhatsApp, E-Mail, etc.
6.
CONCLUSIONS & FUTURE SCOPES
In this paper security of information in graphical images or text images has been successfully concealed and retrieved by authorized person. The main advantage in this procedure is that a different media i.e. sound media is used where the entire image information is translated into a .wav format which is unlikely for anybody to recognize its true contents. Many works related to Steganography was compared. The techniques used by most had certain disadvantages. Some had a flaw of deteriorated quality of the retrieved image, some had the issue of size of sink image and cover image. Some other methods had the chance of change in the original message. But this paper had no such problems at all. Moreover the main reason for steganography is hiding the secret information. In the previous approaches, only one kind of media mainly the image and text media were used for hiding information in them. That secret information used a cover image or text
steganography for concealing the secret message. That is two separate digitized files were used for concealing information of one file into another. In contrast, here only a single file is always used. While encoding only the secret image file is used. While decoding, only a single sound file is used.
The future scopes are the following: (i) Conversion can be possible from video frames into a single sound file, (ii) Conversion of audio file into a number of image files while sending.
7.
REFERENCES
[1] Cachin C., May 1998. An Information-Theoretic Model for Steganography. Proceedings of 2nd Workshop on, Information Hiding, MIT Laboratory for Computer Science.
[2] Herodotus, 1992. The Histories, chap. 5 - The fifth book entitled Terpsichore, 7 - The seventh book entitled Polymnia, J. M. Dent & Sons, Ltd.
[3] Anderson J. Ross, Petitcolas Fabien A.P. 1998. On the Limits of Steganography. IEEE Journal of Selected Areas in Communications, 16(4):474-481.
[4] Provos Niels. August 2001. Defending against statistical steganalysis. In Proceedings of the 10th USENIX Security Symposium, pp. 323-335.
[5] Raja K.B., Chowdary C.R., Patnaik Venugopal K R, L.M. 2005. A Secure Image Steganography using LSB, DCT, and Compression Techniques on Raw Images. In Proceedings of Third International Conference Intelligent Sensing and Information Processing. ICISIP, pp. 170-176.
[6] Amin M. M. Salleh M., Ibrahim S., Katmin M. R., Shamsuddin M. Z. I. 2003. Information hiding using Steganography. In Proceedings of Fourth National Conference on Telecommunication Technology Proceedings, Shah Alam, Malaysia, pp. 21-25
[7] Shirali-Shehreza Mohammad. 2007. Steganography in MMS. In Proceedings of International Multitopic Conference, pp. 1-4.
[8] Chen Mei-Ching, Agaian Sos S., Chen C. L. Philip. 2008. Generalized Collage Steganography on Images. In Proceedings of International Conference on Systems, Man and Cybernetics, pp. 1043-1047.
[9] Marwaha Piyush, Marwaha Paresh. 2010. Visual Cryptographic Steganography in Images. In Proceedings of Second International Conference on Computing, Communication and Networking Technologies, pp. 1-6.
[10] Zheng Yongzhen, Liu Fenlin, Yang Chunfang, Luo Xiangyang, Zhao Kun. 2011. Identification of steganography software Based on Core Instructions Template Matching. In Proceedings of Third International Conference on Multimedia Information Networking and Security, pp. 494-498.